6 questions to passersby on the street. 12 graphs with answers. 2550 respondents
Testing? Web Analytics? No, a big street poll!
For example, more than half of people compare you to about 4 competitors.
Charts, specific numbers and no advertising. All collected in a convenient statistics. Enjoy.
In the comments to one of my articles, one of the readers gave me the idea that it makes sense to conduct a survey among the population in order to get answers to exciting questions.
')
That is exactly what my friend and I did. Armed with folders, several pens, smiles and paper - we went to look for those who want to answer our questions. By the way, in the process we were joined by three more friends who wanted to help in the conduct of the survey.
Naturally, the survey concerns precisely b2c, since it would be difficult to find the right number of entrepreneurs on the street. At least, those who would not hurry about their business and would be ready to answer our questions.
In total, we surveyed exactly 2550 people. At first there were more of them, but we removed all the “refrained from answering” and all the sentences “to go H @ #”, leaving only what matters.
Let's be honest - the age was determined “by eye”, but if there were even the slightest doubts, they asked (the reaction to the question about age was calmer than we thought would be).
Considering the step in 10 years, we considered that “by eye” one can understand age, albeit with a meager error. One of the city parks in Dnepropetrovsk, Ukraine, became a survey site.
A. Yes
B. No
20-35 years:
A. “Yes” - 1402 people (94.8%)
B. “No” - 77 people (5.2%)
36-45 years:
A. “Yes” - 612 people (81.8%)
B. “No” - 136 people (18.2%)
46-55 years:
A. “Yes” - 137 people (42.4%)
B. “No” - 186 people (57.6%)
Below is a visualization of the answers to question number 1:
A. “Yes” - 2151 people use the Internet (84.4%)
B. “No” - 399 people do not use the Internet (15.6%)
These answers surprised us a little. We believed that nowadays at least 95% of people use the Internet, if we consider that Dnipropetrovsk is not the smallest city in Ukraine (read, “not the most backward”).
Then we were even more surprised. The second question involved those who use the Internet.
A. Yes
B. No
20-35 years:
A. “Yes” - 1079 people (77.0%)
B. “No” - 323 people (23.0%)
36-45 years:
A. “Yes” - 561 people (91.7%)
B. “No” - 51 people (8.3%)
46-55 years:
A. “Yes” - 60 people (43.8%)
B. “No” - 77 people (56.2%)
Below is a visualization of the answers to question number 2:

Interesting isn't it?
We believe that this is due to the fact that people aged 36-45 years have a special lack of time, and therefore they show increased (compared to other groups) activity in online stores.
A. “Yes” - 1700 people purchase goods and / or services on the Internet (79.0%)
B. “No” - 451 people do not purchase goods and / or services on the Internet (21.0%)
The third question involved those who responded that they were purchasing goods and / or services on the Internet.
A. Compare two sites (in total)
B. Compare from two to four sites (in total)
C. Compare over four sites
D. Do not compare
20-35 years:
A. “I compare two sites (in total)” - 221 people (20.5%)
B. “I compare from 2 to 4 sites (in total)” - 654 people (60.6%)
C. “Compare over four sites” - 127 people (11.8%)
D. “I do not compare” - 77 people (7.1%)
36-45 years:
A. "I compare two sites (in total)" - 110 people (19.6%)
B. “I compare from 2 to 4 sites (in total)” - 221 people (39.4%)
C. “Compare more than four sites” - 204 people (36.4%)
D. “I do not compare” - 26 people (4.6%)
46-55 years:
A. “I compare two sites (in total)” - 9 people (15.0%)
B. "I compare from 2 to 4 sites (in total)" - 17 people (28.3%)
C. “Compare more than four sites” - 0 people (0%)
D. “I do not compare” - 34 people (56.7%)
Below is a visualization of the answers to question number 3:

A. "I compare two sites (in total)" - 340 people (20.0%)
B. "I compare from 2 to 4 sites (in total)" - 893 people (52.5%)
C. “Compare more than four sites” - 331 people (19.5%)
D. “I do not compare” - 136 people (8.0%)

It turns out that on average you are compared to about 4 competitors. This is probably due to the fact that people simply open the first 3-4 links in a search engine, but we may be wrong about this.
Question 4 was attended by those who replied that they use the Internet.
A. Yes
B. No (Understand what I am asking, but “they do not see much difference.” This option was added in the process, as the respondents clarified this point)
C. I do not understand what is being said
20-35 years:
A. “Yes” - 1096 people (78.2%)
B. “No” - 187 people (13.3%)
C. “I do not understand what is being said” - 119 people (8.5%)
36-45 years:
A. “Yes” - 493 people (80.5%)
B. “No” - 77 people (12.6%)
C. “I do not understand what is at stake” - 42 people (6.9%)
46-55 years:
A. “Yes” - 34 people (24.8%)
B. “No” - 60 people (43.8%)
C. “I do not understand what is at stake” - 43 people (31.4%)
Below is a visualization of the answers to question number 4:
A. “Yes” - 1624 people see the difference between one-page and multi-page sites (75.5%)
B. “No” - 323 people do not see the difference between one-page and multi-page sites (15.0%)
C. “I don’t understand what I’m talking about” - 204 people did not understand which multi-page and one-page websites we asked the question (9.5%)

Here we were very surprised that so many people actually answered that they saw / understood the difference between the multipage site and the landing page.
A year ago we were interested in the exact same question (it was not a poll, but it turned out that you managed to find out about ~ 200 people about it), and the number of people who answered "Yes" was about 30%, 2 times less than present value. And at that time we asked this question to people who, on average, were 25-35 years old.
The fifth question was attended by those who replied that he sees or understands the difference between single-page and multi-page sites. The answered “Yes” and “No” in the previous question.
A. On a one-page website
B. On a multipage website
C. No difference
20-35 years:
A. “On a one-page website” - 442 people (34.5%)
B. “On a multi-page site” - 263 people (20.5%)
C. “Without a difference” - 578 people (45.0%)
36-45 years:
A. “On a one-page site” - 195 people (34.2%)
B. “On a multi-page site” - 162 people (28.4%)
C. “Without a difference” - 213 people (37.4%)
46-55 years:
A. “On a one-page website” - 34 people (36.2%)
B. “On a multi-page site” - 17 people (18.1%)
C. “Without a difference” - 43 people (45.7%)
Below is a visualization of the answers to question number 5:

A. “On a one-page website” - 671 people (34.5%)
B. “On a multi-page site” - 442 people (22.7%)
C. “Without a difference” - 834 people (42.8%)
It is possible that people prefer the landing page precisely because navigation is usually easier there than on a multi-page site.
We can assume that this is especially convenient for “non-advanced” users who simply get lost on a site with a large number of pages and cannot find what interests them (very often not the most convenient search engines on the sites).
Then there were those who responded that they were purchasing goods and / or services on the Internet.
Question number 6: how do you feel about the sites on which the action is valid and it shows how much time is left until its end?
A. Positive. Conveniently, I know how much time I have to manage to use the action.
B. Negative. Such sites cause a feeling of panic - I want to leave the site
C. Positive. (another reason)
D. Negative. I think this is a hoax and the action won't end.
E. Neutral / I do not understand what kind of action is in question
20-35 years:
A. “Positive. It’s convenient that I know how much time I have to use the action ”- 85 people (7.9%)
B. “Negative. Such sites cause a feeling of panic - I want to leave the site ”- 246 people (22.8%)
C. “Positive. (another reason ") - 196 people (18.2%)
D. “Negative. I think this is a hoax and the action will not end ”- 374 people (34.6%)
E. “Neutral / I don’t understand what kind of action we are talking about” - 178 people (16.5%)
36-45 years:
A. “Positive. It’s convenient that I know how much time I have to use the action ”- 161 people (28.8%)
B. “Negative. Such sites cause a feeling of panic - I want to leave the site ”- 127 people (22.6%)
C. “Positive. (another reason ") - 68 people (12.1%)
D. “Negative. I think this is a hoax and the action will not end ”- 94 people (16.7%)
E. “Neutral / I don’t understand what kind of action we are talking about” - 111 people (19.8%)
46-55 years:
A. “Positive. It’s convenient that I know how much time I have to use the action ”- 17 people (28.3%)
B. “Negative. Such sites cause a feeling of panic - I want to leave the site ”- 9 people (15.0%)
C. “Positive. (another reason) - 0 people (0%)
D. “Negative. I think this is a hoax and the action will not end ”- 9 people (15.0%)
E. “Neutral / I don’t understand what kind of action we are talking about” - 25 people (41.7%)
Below is a visualization of the answers to question number 6:
A. “Positive. It’s convenient that I know how much time I have to use the action ”- 264 people (15.5%)
B. “Negative. Such sites cause a feeling of panic - I want to leave the site ”- 383 people (22.5%)
C. “Positive. (another reason) - 262 people (15.4%)
D. “Negative. I think this is a hoax and the action will not end ”- 476 people (28.0%)
E. “Neutral / I don’t understand what kind of action we are talking about” - 315 people (18.5%)
We expected more negative reviews about the countdown counters, but even such statistics are already making you think. The whole survey was done to answer this question, since our article touched on b2b, and we wondered how things were going on b2c.
Share statistics. I am sure someone of your friends will be surprised at the result. ;)
For example, more than half of people compare you to about 4 competitors.
Charts, specific numbers and no advertising. All collected in a convenient statistics. Enjoy.
In the comments to one of my articles, one of the readers gave me the idea that it makes sense to conduct a survey among the population in order to get answers to exciting questions.
')
That is exactly what my friend and I did. Armed with folders, several pens, smiles and paper - we went to look for those who want to answer our questions. By the way, in the process we were joined by three more friends who wanted to help in the conduct of the survey.
Naturally, the survey concerns precisely b2c, since it would be difficult to find the right number of entrepreneurs on the street. At least, those who would not hurry about their business and would be ready to answer our questions.
In total, we surveyed exactly 2550 people. At first there were more of them, but we removed all the “refrained from answering” and all the sentences “to go H @ #”, leaving only what matters.
In the process, all people were divided into three groups:
- People age 20-35 years (1479 people)
- People aged 36-45 years (748 people)
- People age 46-55 years (323 people)
Let's be honest - the age was determined “by eye”, but if there were even the slightest doubts, they asked (the reaction to the question about age was calmer than we thought would be).
Considering the step in 10 years, we considered that “by eye” one can understand age, albeit with a meager error. One of the city parks in Dnepropetrovsk, Ukraine, became a survey site.
Let's start without unnecessary lyrical digressions.
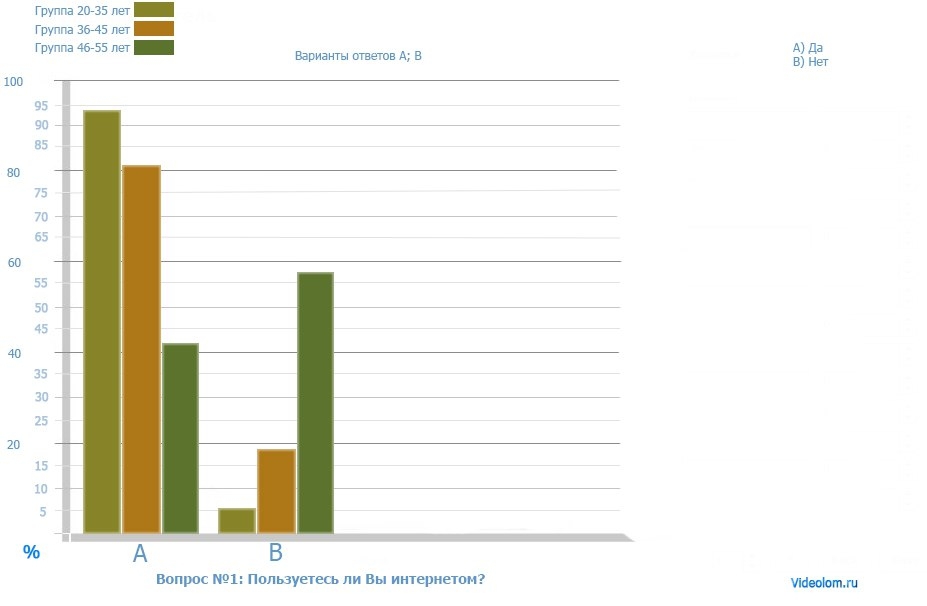
Question number 1: Do you use the Internet?
Variants of answers:
A. Yes
B. No
Answers:
20-35 years:
A. “Yes” - 1402 people (94.8%)
B. “No” - 77 people (5.2%)
36-45 years:
A. “Yes” - 612 people (81.8%)
B. “No” - 136 people (18.2%)
46-55 years:
A. “Yes” - 137 people (42.4%)
B. “No” - 186 people (57.6%)
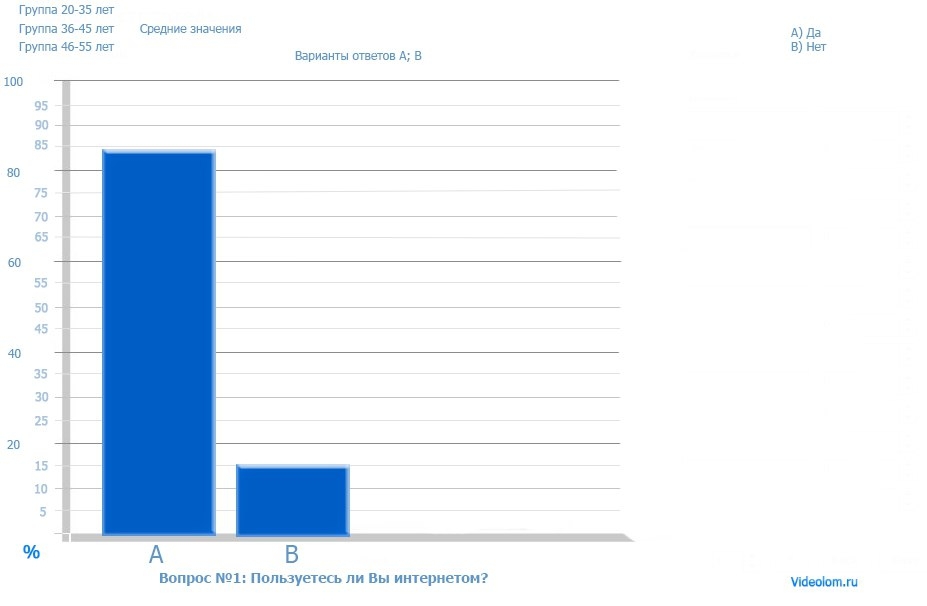
Below is a visualization of the answers to question number 1:
Average values (averaged statistics):
A. “Yes” - 2151 people use the Internet (84.4%)
B. “No” - 399 people do not use the Internet (15.6%)
These answers surprised us a little. We believed that nowadays at least 95% of people use the Internet, if we consider that Dnipropetrovsk is not the smallest city in Ukraine (read, “not the most backward”).
Then we were even more surprised. The second question involved those who use the Internet.
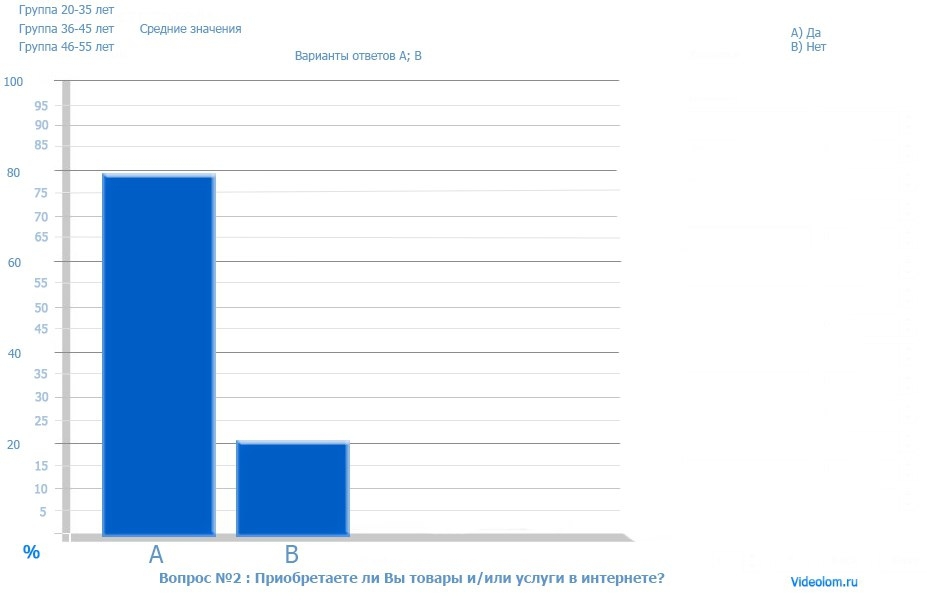
Question number 2: Do you buy goods and / or services on the Internet?
Variants of answers:
A. Yes
B. No
Answers:
20-35 years:
A. “Yes” - 1079 people (77.0%)
B. “No” - 323 people (23.0%)
36-45 years:
A. “Yes” - 561 people (91.7%)
B. “No” - 51 people (8.3%)
46-55 years:
A. “Yes” - 60 people (43.8%)
B. “No” - 77 people (56.2%)
Below is a visualization of the answers to question number 2:
Interesting isn't it?
We believe that this is due to the fact that people aged 36-45 years have a special lack of time, and therefore they show increased (compared to other groups) activity in online stores.
Average values (averaged statistics):
A. “Yes” - 1700 people purchase goods and / or services on the Internet (79.0%)
B. “No” - 451 people do not purchase goods and / or services on the Internet (21.0%)
The third question involved those who responded that they were purchasing goods and / or services on the Internet.
Question number 3: Do you compare the prices for the same services and products among different sites before buying?
Variants of answers:
A. Compare two sites (in total)
B. Compare from two to four sites (in total)
C. Compare over four sites
D. Do not compare
Answers:
20-35 years:
A. “I compare two sites (in total)” - 221 people (20.5%)
B. “I compare from 2 to 4 sites (in total)” - 654 people (60.6%)
C. “Compare over four sites” - 127 people (11.8%)
D. “I do not compare” - 77 people (7.1%)
36-45 years:
A. "I compare two sites (in total)" - 110 people (19.6%)
B. “I compare from 2 to 4 sites (in total)” - 221 people (39.4%)
C. “Compare more than four sites” - 204 people (36.4%)
D. “I do not compare” - 26 people (4.6%)
46-55 years:
A. “I compare two sites (in total)” - 9 people (15.0%)
B. "I compare from 2 to 4 sites (in total)" - 17 people (28.3%)
C. “Compare more than four sites” - 0 people (0%)
D. “I do not compare” - 34 people (56.7%)
Below is a visualization of the answers to question number 3:
Average values (averaged statistics):
A. "I compare two sites (in total)" - 340 people (20.0%)
B. "I compare from 2 to 4 sites (in total)" - 893 people (52.5%)
C. “Compare more than four sites” - 331 people (19.5%)
D. “I do not compare” - 136 people (8.0%)
It turns out that on average you are compared to about 4 competitors. This is probably due to the fact that people simply open the first 3-4 links in a search engine, but we may be wrong about this.
Question 4 was attended by those who replied that they use the Internet.
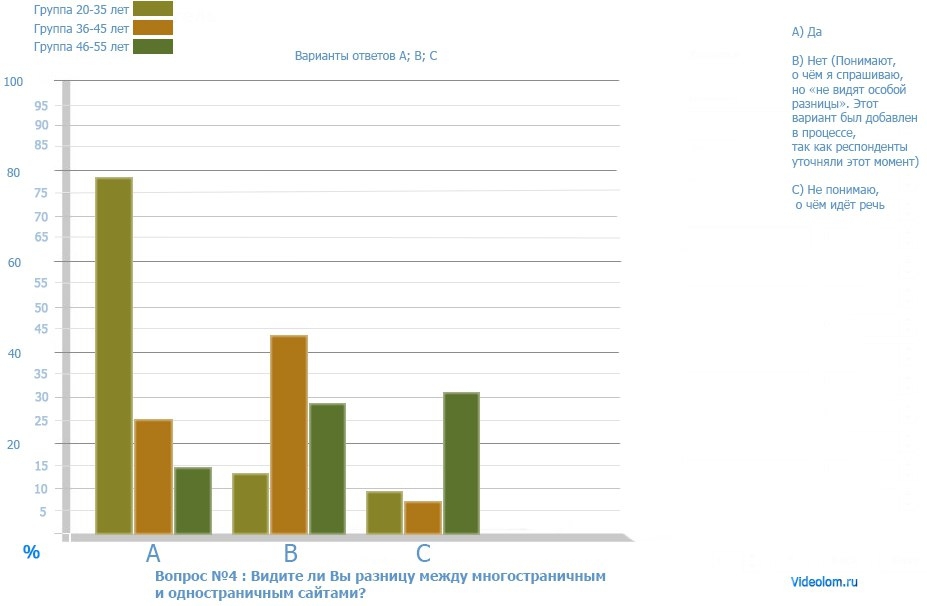
Question number 4: Do you see the difference between multi-page and single-page sites?
Variants of answers:
A. Yes
B. No (Understand what I am asking, but “they do not see much difference.” This option was added in the process, as the respondents clarified this point)
C. I do not understand what is being said
Answers:
20-35 years:
A. “Yes” - 1096 people (78.2%)
B. “No” - 187 people (13.3%)
C. “I do not understand what is being said” - 119 people (8.5%)
36-45 years:
A. “Yes” - 493 people (80.5%)
B. “No” - 77 people (12.6%)
C. “I do not understand what is at stake” - 42 people (6.9%)
46-55 years:
A. “Yes” - 34 people (24.8%)
B. “No” - 60 people (43.8%)
C. “I do not understand what is at stake” - 43 people (31.4%)
Below is a visualization of the answers to question number 4:
Average values (averaged statistics):
A. “Yes” - 1624 people see the difference between one-page and multi-page sites (75.5%)
B. “No” - 323 people do not see the difference between one-page and multi-page sites (15.0%)
C. “I don’t understand what I’m talking about” - 204 people did not understand which multi-page and one-page websites we asked the question (9.5%)
Here we were very surprised that so many people actually answered that they saw / understood the difference between the multipage site and the landing page.
A year ago we were interested in the exact same question (it was not a poll, but it turned out that you managed to find out about ~ 200 people about it), and the number of people who answered "Yes" was about 30%, 2 times less than present value. And at that time we asked this question to people who, on average, were 25-35 years old.
The fifth question was attended by those who replied that he sees or understands the difference between single-page and multi-page sites. The answered “Yes” and “No” in the previous question.
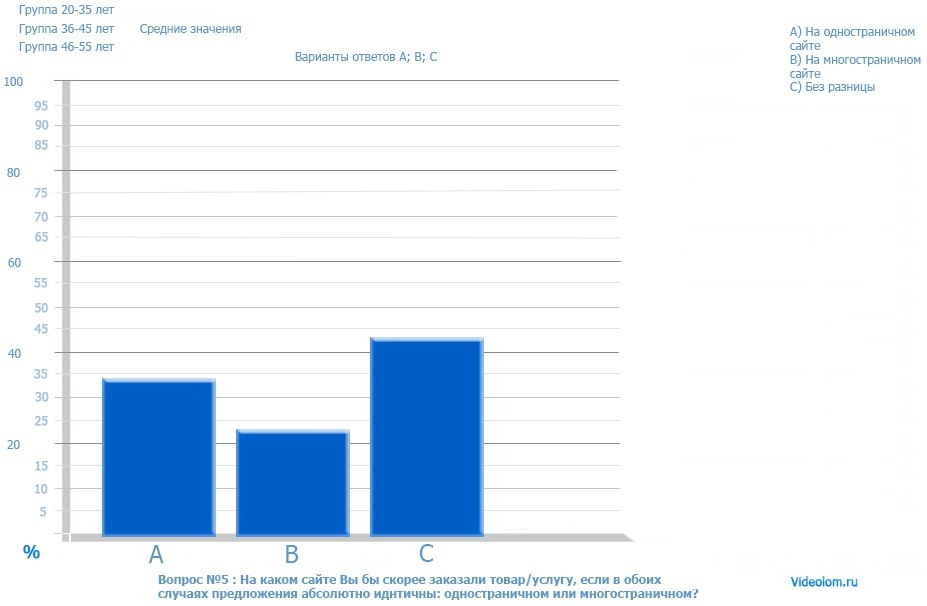
Question number 5: On which website would you rather order a product / service, if in both cases the offers are absolutely identical: single-page or multi-page?
Variants of answers:
A. On a one-page website
B. On a multipage website
C. No difference
Answers:
20-35 years:
A. “On a one-page website” - 442 people (34.5%)
B. “On a multi-page site” - 263 people (20.5%)
C. “Without a difference” - 578 people (45.0%)
36-45 years:
A. “On a one-page site” - 195 people (34.2%)
B. “On a multi-page site” - 162 people (28.4%)
C. “Without a difference” - 213 people (37.4%)
46-55 years:
A. “On a one-page website” - 34 people (36.2%)
B. “On a multi-page site” - 17 people (18.1%)
C. “Without a difference” - 43 people (45.7%)
Below is a visualization of the answers to question number 5:
Average values (averaged statistics):
A. “On a one-page website” - 671 people (34.5%)
B. “On a multi-page site” - 442 people (22.7%)
C. “Without a difference” - 834 people (42.8%)
It is possible that people prefer the landing page precisely because navigation is usually easier there than on a multi-page site.
We can assume that this is especially convenient for “non-advanced” users who simply get lost on a site with a large number of pages and cannot find what interests them (very often not the most convenient search engines on the sites).
Then there were those who responded that they were purchasing goods and / or services on the Internet.
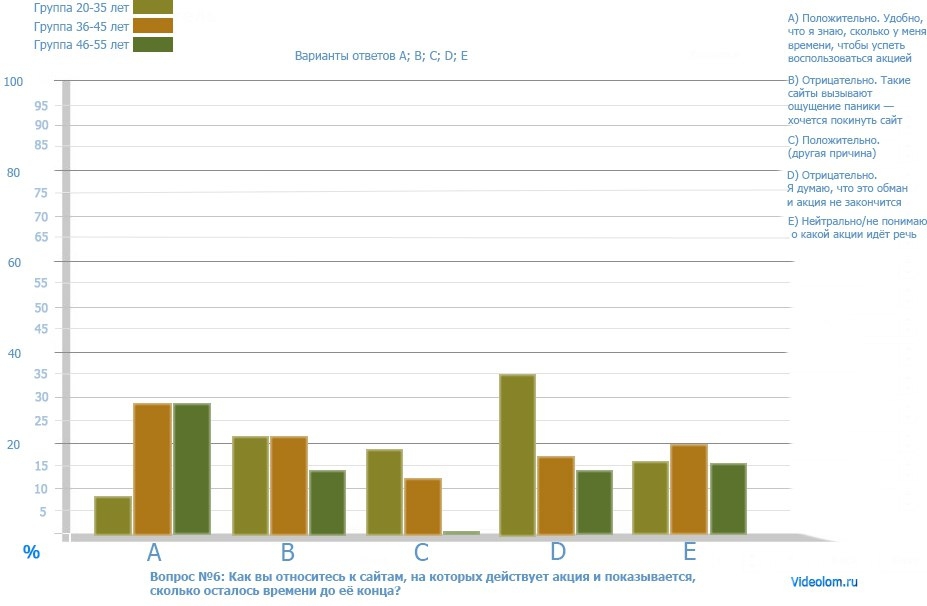
Question number 6: how do you feel about the sites on which the action is valid and it shows how much time is left until its end?
Variants of answers:
A. Positive. Conveniently, I know how much time I have to manage to use the action.
B. Negative. Such sites cause a feeling of panic - I want to leave the site
C. Positive. (another reason)
D. Negative. I think this is a hoax and the action won't end.
E. Neutral / I do not understand what kind of action is in question
Answers:
20-35 years:
A. “Positive. It’s convenient that I know how much time I have to use the action ”- 85 people (7.9%)
B. “Negative. Such sites cause a feeling of panic - I want to leave the site ”- 246 people (22.8%)
C. “Positive. (another reason ") - 196 people (18.2%)
D. “Negative. I think this is a hoax and the action will not end ”- 374 people (34.6%)
E. “Neutral / I don’t understand what kind of action we are talking about” - 178 people (16.5%)
36-45 years:
A. “Positive. It’s convenient that I know how much time I have to use the action ”- 161 people (28.8%)
B. “Negative. Such sites cause a feeling of panic - I want to leave the site ”- 127 people (22.6%)
C. “Positive. (another reason ") - 68 people (12.1%)
D. “Negative. I think this is a hoax and the action will not end ”- 94 people (16.7%)
E. “Neutral / I don’t understand what kind of action we are talking about” - 111 people (19.8%)
46-55 years:
A. “Positive. It’s convenient that I know how much time I have to use the action ”- 17 people (28.3%)
B. “Negative. Such sites cause a feeling of panic - I want to leave the site ”- 9 people (15.0%)
C. “Positive. (another reason) - 0 people (0%)
D. “Negative. I think this is a hoax and the action will not end ”- 9 people (15.0%)
E. “Neutral / I don’t understand what kind of action we are talking about” - 25 people (41.7%)
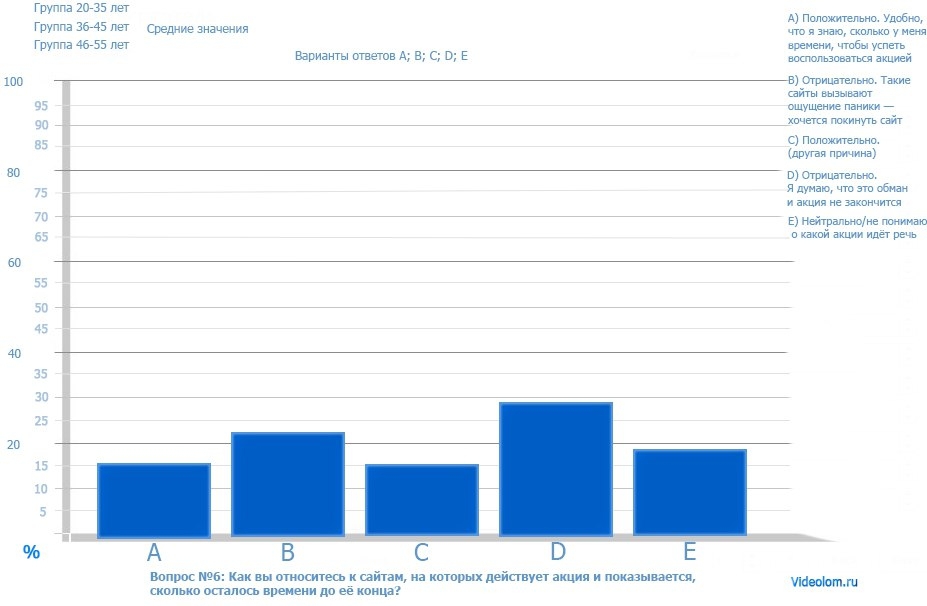
Below is a visualization of the answers to question number 6:
Average values (averaged statistics):
A. “Positive. It’s convenient that I know how much time I have to use the action ”- 264 people (15.5%)
B. “Negative. Such sites cause a feeling of panic - I want to leave the site ”- 383 people (22.5%)
C. “Positive. (another reason) - 262 people (15.4%)
D. “Negative. I think this is a hoax and the action will not end ”- 476 people (28.0%)
E. “Neutral / I don’t understand what kind of action we are talking about” - 315 people (18.5%)
We expected more negative reviews about the countdown counters, but even such statistics are already making you think. The whole survey was done to answer this question, since our article touched on b2b, and we wondered how things were going on b2c.
Share statistics. I am sure someone of your friends will be surprised at the result. ;)
Source: https://habr.com/ru/post/294698/
All Articles