Fear has big eyes, or New Metric, hello
New Yandex Metrika is a pain for most marketers. But the point is not in the Metric, but in the habits of Internet specialists and in their limited time. We turn to web analytics every day when it is necessary to draw conclusions, make corrections, write a report, find a mistake and save a dying campaign. Agree, at this moment we are busy with the need to quickly find a solution to the problem, rather than a desire to learn the beautiful and useful functionality of the new Metric.
What is funny, colleagues find time to complain about the inconvenience of the new interface, to write an angry letter to Plato, but somehow they don’t get their hands on the novelty. We gathered our strength, sorted it out and were pleasantly surprised by the new features. We are happy to share!
Before we begin to talk about simple and understandable, we warn you: now in the interface your main button is “Segment”!
1. Where is the usual “Sources / Summary” path ?!
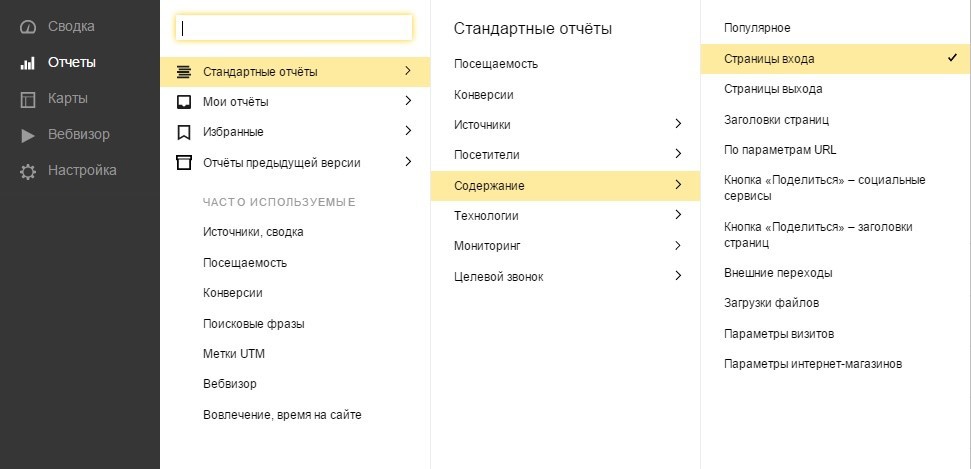
Everything remained in place, without panic. On the left there is a magic button "Reports", where only 4 sections:
My reports (you could not create them yet, but still a little bit - and they will appear);
Favorites (these are all your reports, but only those that you specify as your favorite);
Reports of the previous version (Yandex took care of you, and all the reports that you built with such love in the previous version, saved);
Standard reports (this is exactly the section that you previously found along the Sources / Summary path). Select sources, and there is a section "Sources / Summary". Do you recognize?
')

2. More room for creativity
In the old Metric there were clear limitations of the parameters that can be grouped, combined and analyzed. To quickly get some data on the necessary parameters, it was necessary to create reports and segments in advance. New Metric allows you to add absolutely any parameters right here and right now.
For example, you really want to see in the old Metric, who are the people who made thousands of organic transitions in the last month. In the old Metric will have to stomp in the "Designer" and build a report. In the new Metric you do it without departing from the cash register.
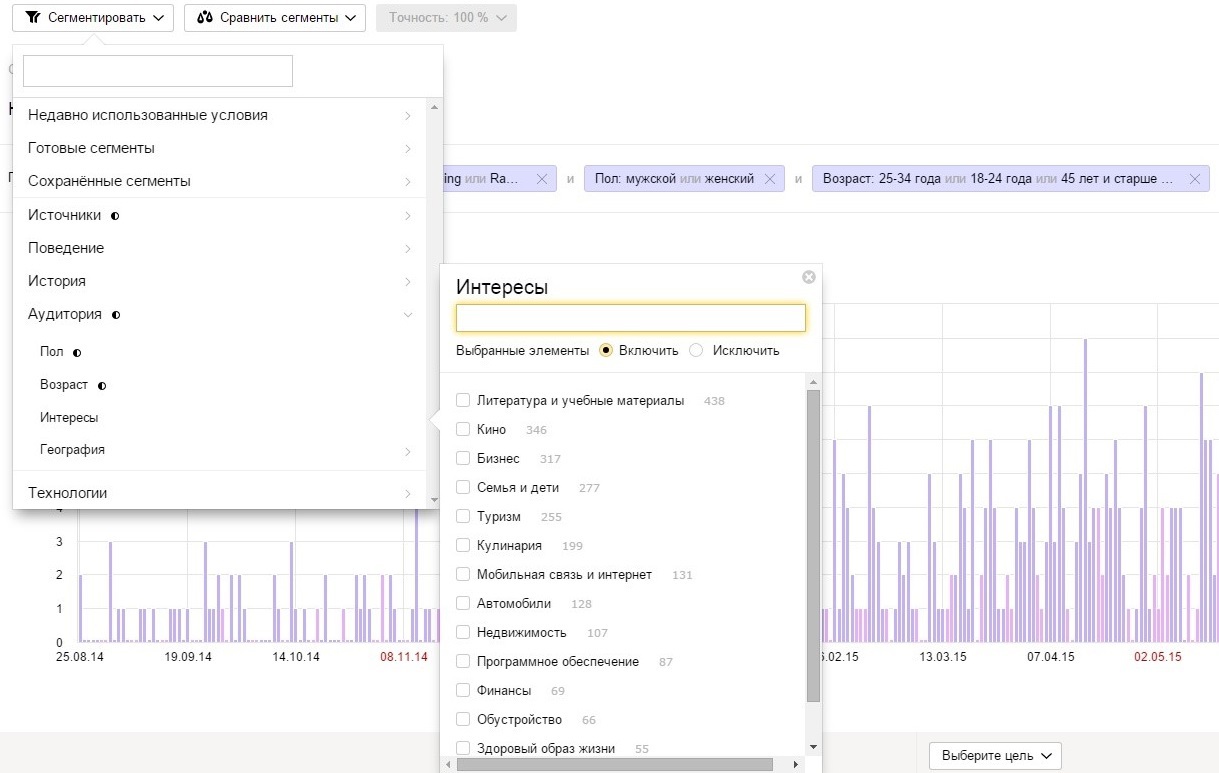
Let's take an example of how many people access our website from tablets via social networks. Press the "Segment" button, as in the old Metric, select "Technology / Device / Smartphones".

Again "Segment / Last Source (why last, I will tell a little later) / Social Networks." Then choose the social networks of interest or (again, a huge plus of the new Metric) separate groups in these social networks, if they are known.

So, Metric helped us get a report on the selected data.

Then you can specify how many of them are men, what age, from which cities, and what goals they fulfill on our website. Choose parameters and add - you are not limited by anything!
If you really liked what happened in the preparation of the report, and you want to save this algorithm, since you are going to use it often, click on the "Save" button in the upper right corner.

Next to it is an up arrow that allows you to upload data. By the way, now in pdf, which was not in the old Metric.
3. Actually, still faster.
And indeed, when quickly searching for a particular parameter for analysis, you don’t even have to choose it - simply find the item you need, and the new Metric will find everything for you.

4. Find 10 differences
Now it is possible to quickly compare data for different periods of time, efficiency from different sources, from different key requests, and receive visual graphs.

Again, then everything depends on your desires and fantasies. You can compare the behavior of different audiences for the same period of time from the same traffic source, the effectiveness of the same key request at different time periods, etc.
Such functionality is available on each page of the “Reports” - button “Compare segments”.
5. Who is the last?
The most painful question in determining the effectiveness of the channel is what to do when people come from contextual advertising, watch a site, go away, come back from organics and buy? How to track such orders, and what is considered effective in this case? New Metric solves this problem. Now all reports can be filtered on the first and last visit.

6. Yandex is thinking about agencies!
Do you have a large number of customers? It means that you have a sooo long page with Yandex Metrics counters. Was. In the old interface Metrics. In the new there is an opportunity to put down tags and separate old customers from new ones, guest counters from their own, selected and important customers from those to whom you go extremely rarely.

7. But what about the settings?
They are now also at hand! As before, you can make settings through a common interface.
But if you remembered that you want to add a new goal when you made a report, a button with Settings is waiting for you in the main interface menu. Inside the settings have not changed at all, so there is no comment here =)

8. Method from the reverse
The new Metric is much easier to analyze individual pages. Select the "Contents" section in the Reports and the page parameters you are interested in, for example, take the "Login pages".
And further we impose the facts of interest on the pages. For example, the number of transitions from organic issue. We go to the section
"Segment", select the desired source. Get data and analyze.

9. Stranger In!
Let us examine one more interesting functionality of the new Metrica - the possibility not to include one or another parameter. With it, you can easily filter out brand traffic. For example, go to the section "Attendance" and choose the type of traffic source "Transitions from search engines."

Then select the section “Search / Search phrases”. Click the "Exclude" option and specify an unwanted phrase, for example, "take the cake".

10. Yes, there is a lot from Analytics
Indeed, the main page is very similar to Google, but what's wrong with that? After all, now there is an opportunity to receive a lot of useful information immediately on the main page! The "Summary" section displays all popular data on one page. If this is not enough, there is a button “Library of widgets” in which you can select any section of interest and add it to the main summary.

Of course, Metric 2.0 is still at the stage of improvements and absolutely all the functionality of the old version is not yet available in it. For example, in the new Metric it is still impossible to track revenue from conversion, but Yandex managers promised to add this in the coming months.
We sorted out the main points that prevented us from working with the new Metric. It took no more than an hour to study, but now we have beautiful reports and a wonderful article. Have you encountered any other problems with the new interface Metrics? Let's discuss!
PS By the way, we got a report from the launch of the New Metrics, which sheds light on many things ...
What is funny, colleagues find time to complain about the inconvenience of the new interface, to write an angry letter to Plato, but somehow they don’t get their hands on the novelty. We gathered our strength, sorted it out and were pleasantly surprised by the new features. We are happy to share!
Before we begin to talk about simple and understandable, we warn you: now in the interface your main button is “Segment”!
1. Where is the usual “Sources / Summary” path ?!
Everything remained in place, without panic. On the left there is a magic button "Reports", where only 4 sections:
My reports (you could not create them yet, but still a little bit - and they will appear);
Favorites (these are all your reports, but only those that you specify as your favorite);
Reports of the previous version (Yandex took care of you, and all the reports that you built with such love in the previous version, saved);
Standard reports (this is exactly the section that you previously found along the Sources / Summary path). Select sources, and there is a section "Sources / Summary". Do you recognize?
')
2. More room for creativity
In the old Metric there were clear limitations of the parameters that can be grouped, combined and analyzed. To quickly get some data on the necessary parameters, it was necessary to create reports and segments in advance. New Metric allows you to add absolutely any parameters right here and right now.
For example, you really want to see in the old Metric, who are the people who made thousands of organic transitions in the last month. In the old Metric will have to stomp in the "Designer" and build a report. In the new Metric you do it without departing from the cash register.
Let's take an example of how many people access our website from tablets via social networks. Press the "Segment" button, as in the old Metric, select "Technology / Device / Smartphones".
Again "Segment / Last Source (why last, I will tell a little later) / Social Networks." Then choose the social networks of interest or (again, a huge plus of the new Metric) separate groups in these social networks, if they are known.
So, Metric helped us get a report on the selected data.
Then you can specify how many of them are men, what age, from which cities, and what goals they fulfill on our website. Choose parameters and add - you are not limited by anything!
If you really liked what happened in the preparation of the report, and you want to save this algorithm, since you are going to use it often, click on the "Save" button in the upper right corner.
Next to it is an up arrow that allows you to upload data. By the way, now in pdf, which was not in the old Metric.
3. Actually, still faster.
And indeed, when quickly searching for a particular parameter for analysis, you don’t even have to choose it - simply find the item you need, and the new Metric will find everything for you.
4. Find 10 differences
Now it is possible to quickly compare data for different periods of time, efficiency from different sources, from different key requests, and receive visual graphs.
Again, then everything depends on your desires and fantasies. You can compare the behavior of different audiences for the same period of time from the same traffic source, the effectiveness of the same key request at different time periods, etc.
Such functionality is available on each page of the “Reports” - button “Compare segments”.
5. Who is the last?
The most painful question in determining the effectiveness of the channel is what to do when people come from contextual advertising, watch a site, go away, come back from organics and buy? How to track such orders, and what is considered effective in this case? New Metric solves this problem. Now all reports can be filtered on the first and last visit.
6. Yandex is thinking about agencies!
Do you have a large number of customers? It means that you have a sooo long page with Yandex Metrics counters. Was. In the old interface Metrics. In the new there is an opportunity to put down tags and separate old customers from new ones, guest counters from their own, selected and important customers from those to whom you go extremely rarely.
7. But what about the settings?
They are now also at hand! As before, you can make settings through a common interface.
But if you remembered that you want to add a new goal when you made a report, a button with Settings is waiting for you in the main interface menu. Inside the settings have not changed at all, so there is no comment here =)
8. Method from the reverse
The new Metric is much easier to analyze individual pages. Select the "Contents" section in the Reports and the page parameters you are interested in, for example, take the "Login pages".
And further we impose the facts of interest on the pages. For example, the number of transitions from organic issue. We go to the section
"Segment", select the desired source. Get data and analyze.
9. Stranger In!
Let us examine one more interesting functionality of the new Metrica - the possibility not to include one or another parameter. With it, you can easily filter out brand traffic. For example, go to the section "Attendance" and choose the type of traffic source "Transitions from search engines."
Then select the section “Search / Search phrases”. Click the "Exclude" option and specify an unwanted phrase, for example, "take the cake".
10. Yes, there is a lot from Analytics
Indeed, the main page is very similar to Google, but what's wrong with that? After all, now there is an opportunity to receive a lot of useful information immediately on the main page! The "Summary" section displays all popular data on one page. If this is not enough, there is a button “Library of widgets” in which you can select any section of interest and add it to the main summary.
Of course, Metric 2.0 is still at the stage of improvements and absolutely all the functionality of the old version is not yet available in it. For example, in the new Metric it is still impossible to track revenue from conversion, but Yandex managers promised to add this in the coming months.
We sorted out the main points that prevented us from working with the new Metric. It took no more than an hour to study, but now we have beautiful reports and a wonderful article. Have you encountered any other problems with the new interface Metrics? Let's discuss!
PS By the way, we got a report from the launch of the New Metrics, which sheds light on many things ...
Source: https://habr.com/ru/post/294002/
All Articles