19 metrics you might not know about

Application analysis in most cases is reduced simply to monitoring the main metrics: DAU, MAU, WAU, ARPU, ARPPU and other abbreviations. The basic metrics of analytics are just those 20% of the functional of analytic systems that give 80% of the result. But do you need these 80%?
If not, our article is for you. We will talk about some metrics that would also be worth bearing in mind if you want to fully understand all the processes that occur in your application.
An overview of the main metrics can be read here.
')
Acquisition Metrics
So, users come to your application. (we recommend to watch the webinar on the topic of main metrics to attract users)
You measure the number of new users (New Users), the total number of users on a particular date (Total Users). You measure the cost of attracting users (CPI), the effectiveness of your investment (ROI).
But in order to start the flow of traffic from a partner, you must first find this partner, sign an agreement (agreed with lawyers, often not fast), integrate and agree on everything. That is, to spend both time and money: either on the salary of their employees, or on a one-time payment to the partner (it happens sometimes). Therefore, we recommend to calculate not only the usual CPI, but also the effective cost of attracting users ( eCPI ), which includes all third-party costs.
Accordingly, it is better to calculate ROI then by putting eCPI in the denominator. So you get eROI . And it may happen that, on the basis of eCPI and eROI, you will choose completely different partners.
User Retention / Retention
Here, classical retention is usually measured for 1 day, 7 days, 28 days, 60 days, and so on. Some prefer rolling (rolling) retention, in which the user is considered to be retained after, for example, 7 days if he returned to the application on the seventh day or later.
For a more detailed acquaintance with retention, we recommend you to watch our webinar “Everything about retention”
Do you measure the retention of the first session? Do you research FTUE (First Time User Experience)? But the first session determines almost everything . You will be surprised when you see how many users leave you already during the tutorial.
And since we started talking about the tutorial, we recommend measuring tutorial retention. In particular, for this you can use the report Tutorial Steps.
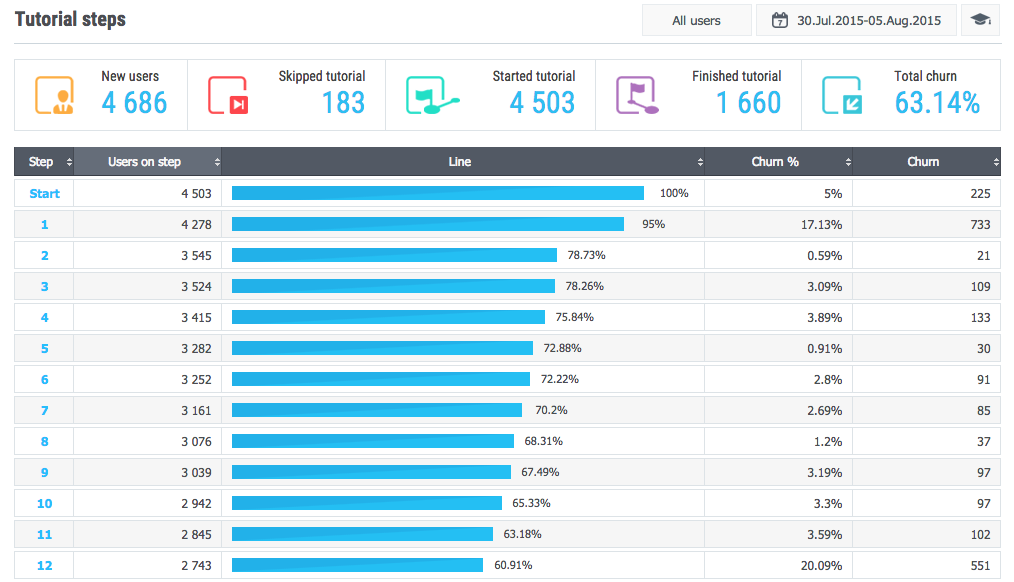
For you, each item in the menu is only an item in the menu, and for the mass of new users that comes to you every day, this is a bifurcation point at which users can make the final decision about leaving. That is why the tutorial can and should be divided into the smallest steps, look at what steps users leave and optimize these bottlenecks. To optimize your 1-day retention you need from your youth, namely - with the optimization of the tutorial.
We also recommend using a metric like 28/1-retention (28-days retention divided by 1-day retention). It is derived from two metrics you know, but using it will help you understand how many of the users who remained active every other day will remain active after 28 days. It is possible that the majority of users leave you on the first day, and those who stayed will stay with you for a long time (in this case, 28/1-retention becomes higher). In this case, all you have to do is optimize the retention of the first day.
This is like a transition from the usual to Bayesian probability (we hope you understand us now).
What users can be called active? Usually active users are those who have been in the application during the last week (sometimes two weeks). And what does the user become after this? Inactive? Wrong. Asleep If the user has not entered the application within a week, this does not mean that he will not return to you again. Give it a chance and highlight sleeping users in a separate category - dormant users . Define the boundaries for yourself: for example, the absence of entrances during the period from a week to six months. Sleeping users can still be returned, and the less the user “sleeps”, the higher the chance. Push notifications, deep-linking, interesting updates, regular tasks and tournaments in your hands.
And if the user suddenly “wakes up” and returns to the application, then such users can be called returning users , and now you definitely shouldn't let them go (daily quests, gifts for returning, individual adjustment of difficulty levels, and so on).
User activity metrics / engagement metrics
As a rule, these are metrics of the scale of your application: DAU, WAU, MAU, Users Online. Sometimes they also include the average session length and the user's lifetime.
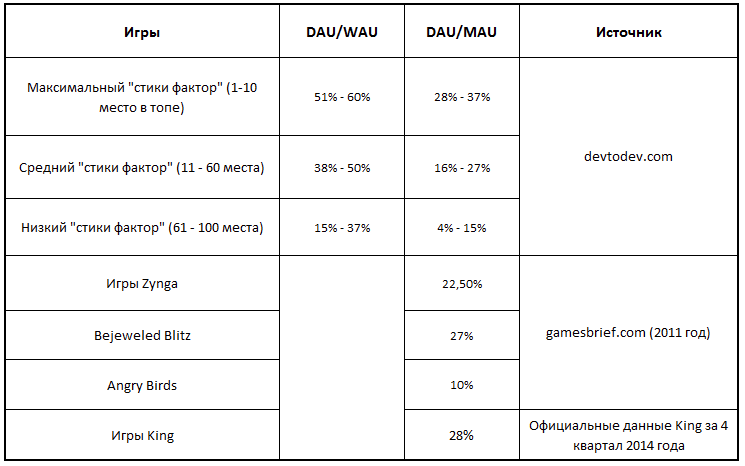
And if you divide DAU into MAU, then we get an interesting metric called Sticky Factor . Next, we quote our material on App2Top :
The described attitude speaks of the regularity of user inputs during the month: the more regularly users enter the application, the higher the “stick factor”.
If we assume that each user enters the game every day for a month, then DAU = WAU = MAU, and, consequently, the “stick factor” equals one hundred percent. But how is this achievable, and does this indicator really affect the commercial success of the game?
To answer this question, we in Devtodev.com analyzed about 100 mobile games and calculated the average values of the “sticks of the factor” for the first three months of 2015.
The average value of the indicator was 18%, while the minimum value was 4%, and the maximum - 37%.
Then we calculated the correlation between the “stick factor” and income. The correlation was 50-60%, depending on the category of the game. This suggests that there is certainly a link between the “sticks factor” and income, but it is not so strong that it can be said that only the ratio of DAU to MAU influences income.
Many consider the average session length. But the number of sessions per active user per day (Sessions / DAU) is not all. Meanwhile, it is also an excellent indicator of the regularity of inputs. Trevor McCalmont gives the following reference values of this quantity:
- good value - 3 sessions per user per day;
- for games with a longer session (RPG, for example) - 2 sessions;
- for games with a short session (casual, runners) - 4-5 sessions.
We see that for games with a short session the value is higher, and for games with a long session - below. Therefore, we can talk about another metric - game time per user per day ( Average Playing Time Per Day ). It allows you to abstract from the average session length and the number of sessions and perfectly characterizes the interest of users to the game.
We also recommend measuring the Frequency by Day - the frequency of user logins depending on the time from their first visit. As a rule, this value decreases. In some cases, slowly but surely, in some rapidly from the first day. Proper use of this metric will allow you to predict the future departure of the user from the game, and having found such a user, we are sure you will do everything to prevent him from leaving your project.
Monetization / Monetization
Here most often measure the total income (Gross, Revenue) and average values: ARPU, ARPPU, Average Check.
Also measure the number and share of paying: Paying Users, Paying Share, Paying Conversion.
Do you know how many users of those who made a payment today did it for the first time? We recommend using the New Paying Users metric. The probability of making a second payment after the first is approximately 70% - 90%. And the probability of the third payment after the second is already higher. And the further, the higher this probability will be. Therefore, the main thing that needs to be done is to get the first payment from the user. And then it will be easier. And the metric described will help you understand how many users are converted into paying users over a period.
We have already talked about the importance of learning FTUE. And for the purposes of monetization, the study of the FTPUE (First Time Paying User Experience) is just as important. It is important to understand what forces users to convert from non-paying to paying, for what period this conversion takes place, after what events in the game, at what balance of the game currency. In particular, you should look at what users bought, who made their first payment - First-Selling Items . They may differ from the most popular items. Their function is to ensure that the user makes his first payment. After studying what exactly these items could attract the user, you can use this experience in various promotions and take into account when making monetization decisions.
Also curious for considering the conversion of an in-game store : the number of purchases divided by the number of store openings. This is easily appreciated if you integrate a custom store opening event. And this metric gives you a way to optimize the store: perhaps you should arrange the items in a different order, change prices or simply rewrite descriptions and redraw the icons.
In general, the economy of the game can be studied for a long time. There are many methods that work. We recommend to get acquainted with our webinar on this topic.
Social Metrics / Social Metrics
If the user likes the game or any other product, he will be happy to share information about it, and you will receive feedback in the form of free organic traffic.
You can measure the number of invitations sent on average by one user: Invites Sent . It is not so difficult to measure: you need to either generate a unique link and count their number, or simply embed the corresponding custom event.
To measure the influence of all social factors, there is a so-called K-factor . For web projects, it is usually calculated as Invites Sent, multiplied by the conversion from invitation to registration. For mobile projects, however, it is usually difficult to estimate the number of users who saw the invitation (the invitation is usually not generated as a unique link, but as a post on a social network), so we offer the following formula:
K-factor = (New users on the channel Organika) / (DAU - New users)
What does K-factor mean? In fact, this is the average number of friends invited by one active user. In particular, the company Wooga voiced its K-factor, it is equal to 0.92. This means that one active player invites an average of 0.92 of his friend. That is, per 100 active players 92 new free players come into the game.
It also means that Wooga can safely multiply its player's LTV by the amount (1 + 0.92) and receive the so-called Social LTV, which will be almost twice as large. And Social LTV better characterizes the amount that one player brings: he not only pays himself, but invites his friends.
To measure user loyalty, there is also a metric called Net Promoter Score . To calculate this metric, you need to conduct a survey among your users. Ask them to rate the likelihood with which they can share information about your product with their friends, on a scale from 0 to 10.
Those who answered 9 or 10 - the so-called promoters (promoters) - are your most loyal friends. They are happy to tell friends about the product they like. Those who gave a rating from 0 to 6 (opponents / detractors) rate you low and, on the contrary, will spread negative information about your product.
By subtracting the percentage of detractors from the percentage of promoters, you get the Net Promoter Score you need, which characterizes the level of loyalty of your users to you.
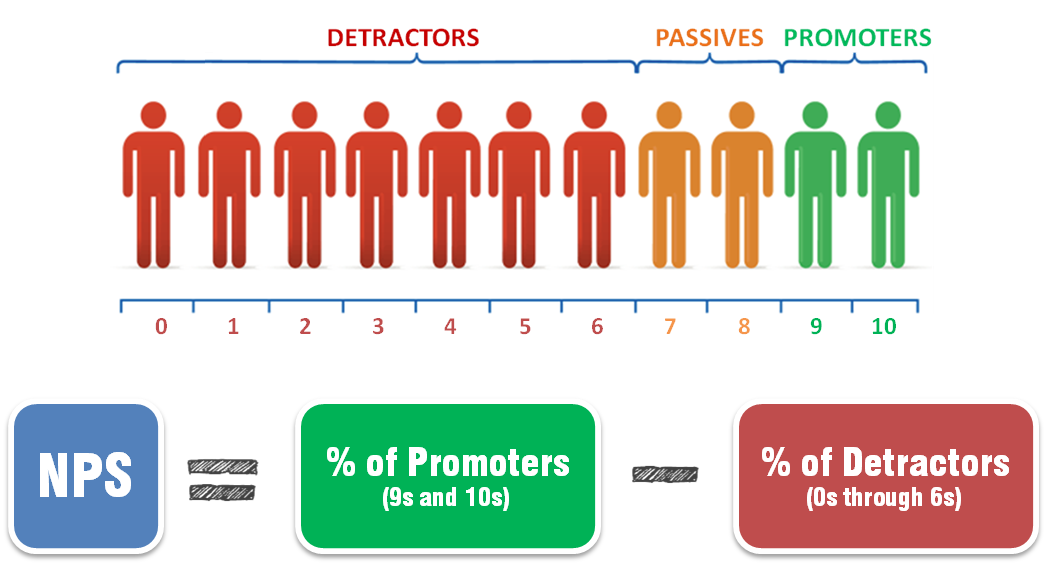
picture from here
Two tips for using Net Promoter Score:
- Do these polls regularly. For example, once in 3 months. Then you can appreciate the dynamics of user loyalty to you and understand whether you are moving correctly.
- Segment users in every way and rate the Net Promoter Score for each segment separately. So you can understand more about who you are making the game for, who your fans and opponents are. And based on this, you can make more accurate decisions in the future.
We hope that the metrics we described will be useful to you. And if you share these metrics with your friends, your Sticky Factor and Net Promoter Score will be close to 100%;)
Source: https://habr.com/ru/post/293776/
All Articles