Customer classification in the service center
Recently, we have accumulated a very significant base, on the basis of which we “trained on cats” and achieved some success.
7 words about our field of activity: we develop software for service centers. In the overwhelming case, our software works in service centers that repair laptops. It is in the accounting of repairs and in the accounting of turnover in the conditions of the service center, we are relatively successful. But working with clients in our software often stayed away from progress, which is even in vain. Just in case, we made the collection and storage of redundant information in the database, and this allowed us to make an analysis, on the basis of which this topic was created.
So here. Having spent 2 weeks studying the database of 10 service centers (of course, with their consent), and setting ourselves goals, we began to establish the right dialogue with customers.
What was required in the first place:
Finding and isolating intermediary clients from statistics is an important stage of preparation. This is not quite an interesting group of clients in their daily work, since they are forced to turn and will always turn on as long as their business exists and until the quality of repair of the service center is at a decent level.
')
Just in case, we leave the data for this group of users to identify the average level of their “contentment” (the description below is what it is all about).
How to identify this group of clients?
A clear sign of this group is, of course, the mark “regular customer”. Not everyone puts it, although this is already a sign of the poor performance of managers. But the most important indicator - it is from 3 laptops a week to repair, and comes for the repaired equipment within 2 hours from the moment of notification of readiness.
As in the previous group, we only look at the average level of “satisfaction” and display it only for the sake of information. In the service center, where 25-40 laptops are repaired per week, regular customers from 8 to 15. The scatter is significant, but somehow it is impossible to systematize - from the service center to the service center, the amount is different. In view of the average importance of statistics on these customers, we will not go deeper in their direction.
How to identify this group of clients?
It is necessary first of all to be guided by the mark “regular customer”. The number of repairs about 1 laptop per week, although most often 2-3 per month. Also in this group are customers who have more than 3 different repaired devices (4 or more).
Here! This is the most interesting group of customers. Their number is simply overwhelming in the bases. And we will work with these clients in the example below.
First of all, we reveal the level of "contentment". This value has values from 0 to 99. We are interested in customers with more than 49 points for any repair.
And we in one service center sent out SMS messages among clients with more than 49 points in the repair of the laptop, and the average score of customer “satisfaction” was over 49. The newsletter was in July 2015 and contained the text “Dear Ivan Ivanovich. It is a hot time! And it would be good to clean your laptop from dust, so that it does not overheat and fail. We offer you a discount on cleaning your laptop - 30%. " This message was “pulled” by 3 glued SMS and the cost of 1 message was ~ 3.6 rubles. Of the 250 messages sent, more than 200 clients came for cleaning (the number is slowly increasing - people are returning from holidays). We believe that this result is very indicative.
You should not send messages to customers with lower scores - these customers are often less loyal to the service center and you can receive complaints about spamming on your part. Even if you do not forget to add a clause about repair conditions for alerts and advertisements - there will still be a not entirely pleasant response from the client.
But! Now, no less important!
Low score "customer satisfaction" for repairs should alarm the service center management. And managers should study weaknesses and flaws in order to increase customer loyalty through better provision of equipment repair services.
And, returning to regular customers and intermediary customers - they should not be forgotten about them either. It is important that they provide the proper level of service and should be especially vigilant about punctures for repairs in their case.
We continue our research - there is just a huge amount of data for them. We plan to revise the scoring in the coming month. And we will try to make a more detailed report for managers, so that they can see the essence of the algorithm in a readable form.
There will be a continuation of the article - you only need to get permission from the service centers to publish some of their data. I think that live statistics in the conditions of service centers will be interesting.
7 words about our field of activity: we develop software for service centers. In the overwhelming case, our software works in service centers that repair laptops. It is in the accounting of repairs and in the accounting of turnover in the conditions of the service center, we are relatively successful. But working with clients in our software often stayed away from progress, which is even in vain. Just in case, we made the collection and storage of redundant information in the database, and this allowed us to make an analysis, on the basis of which this topic was created.
So here. Having spent 2 weeks studying the database of 10 service centers (of course, with their consent), and setting ourselves goals, we began to establish the right dialogue with customers.
What was required in the first place:
- find intermediary customers who carry wholesale mega equipment
- find all regular customers
- find all regular customers
Intermediary Clients
Finding and isolating intermediary clients from statistics is an important stage of preparation. This is not quite an interesting group of clients in their daily work, since they are forced to turn and will always turn on as long as their business exists and until the quality of repair of the service center is at a decent level.
')
Just in case, we leave the data for this group of users to identify the average level of their “contentment” (the description below is what it is all about).
How to identify this group of clients?
A clear sign of this group is, of course, the mark “regular customer”. Not everyone puts it, although this is already a sign of the poor performance of managers. But the most important indicator - it is from 3 laptops a week to repair, and comes for the repaired equipment within 2 hours from the moment of notification of readiness.
Regular customers
As in the previous group, we only look at the average level of “satisfaction” and display it only for the sake of information. In the service center, where 25-40 laptops are repaired per week, regular customers from 8 to 15. The scatter is significant, but somehow it is impossible to systematize - from the service center to the service center, the amount is different. In view of the average importance of statistics on these customers, we will not go deeper in their direction.
How to identify this group of clients?
It is necessary first of all to be guided by the mark “regular customer”. The number of repairs about 1 laptop per week, although most often 2-3 per month. Also in this group are customers who have more than 3 different repaired devices (4 or more).
Regular customers
Here! This is the most interesting group of customers. Their number is simply overwhelming in the bases. And we will work with these clients in the example below.
First of all, we reveal the level of "contentment". This value has values from 0 to 99. We are interested in customers with more than 49 points for any repair.
A bit about contentment counting
The calculation scheme is very subjective, but with all this - for statistics, this figure is very, very interesting. And, looking a little ahead, I will say that we checked in a real service - and the “hit the mark” was in more than 80%, which is a very serious indicator.
The program maintenance repair is divided into statuses. Each repair status is characterized by a designated maximum execution time. It may be exceeded, but this is not encouraged.
The standard set of statuses for ordinary repairs looks like this:
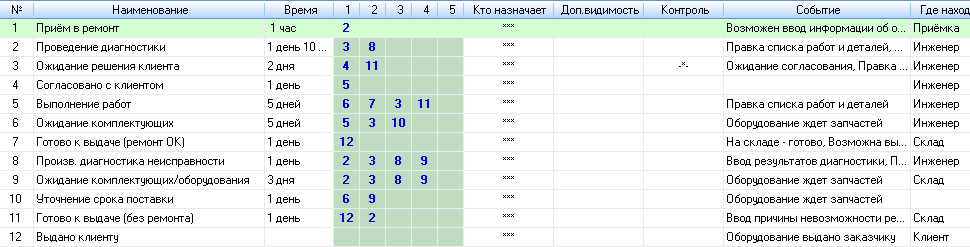
In the "event" column there is a set of properties for the status. And so it looks like:
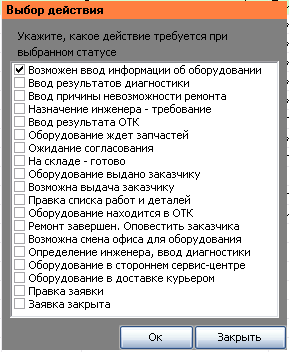
It is by properties that one should be guided in statuses, since far from all points are important for our analysis. Looking only related to the diagnosis, repair and waiting parts.
Each repair has a level of “customer satisfaction”; for a customer, you can get an average value or a sample for a group of equipment being repaired.
1. Choose a customer. We are looking for all the repairs on it, and as a rule they are from one to three. More than 3 is extremely rare, and in case of excess we transfer the client to the group "regular customers". If we have all 3 different devices, then we add 50 points. If 2 different devices, then add 25 points. If there is at least one repetition of repair - then 10/0 points (3/2 repair). If at least one repair has less than 10 points of “contentment”, then we deduct 10 points from the calculation.
1.a. If the client is an intermediary, then we add 25 points to it.
1.b. If a regular customer, then add him 20 points.
2. We identify the level of discipline of repair, namely, in part of the performance of work by the engineer. The engineer changed the statuses in one gulp or did it in stages. If the "salvo", then 0 points. If the status changes went step by step, with the time between shifts of 3 minutes, but no more than the designated time for the status, then we add 10 points.
3. We study the cost of repair relative to the average value of the cost of all repairs. Also - for parts that have been inserted into the repair, the difference between the price of receipt and the price in the sum of the cost of repair is revealed. If the "cost cheat" for parts is less than 10%, then +7 points. If the "cost cheat" for parts is less than 30%, then +5 points. If the "cost cheat" for parts more than 50%, then minus 10 points. If the total cost of repair is less than the average value of more than 10%, then +10 points, if the cost is within ± 10% - then 5 points, if it is above 10% - then 0 points.
4. If the client has viewed the repair card through the “client’s personal account”, then we will add 5 points. If you still leave a review, where there is the word "thank you" and there is no mate / curse, then add another 10 points. If there is at least one dirty word in the comments, then immediately minus 40 points. There are sometimes very funny comments, such as “thank you, b ** for oh *** ny repair”.
5. Term repair. If the repair was carried out within 2 working days, then add 10 points. If within 5 days, then add 5 points. If more than 14 days, then minus 15 points. More than a month - then minus 30 points.
6. If the client took the vehicle within 2 days after the status “ready to issue” - then plus 5 points.
7. For each service engineer who makes repairs, there is an assessment of the quality of their work. The value is from 0 to 99. On average, good masters have 60-70 points. The description of the counting algorithm is more objective, but we will describe the mechanism later, if necessary. So, if the master who made the repair of equipment in the order, has more than 60 points - then plus 5 points. If less, then nothing is added.
8. Loyalty score. Sets the manager - from minutes 30 to plus 30 points. All this is set at the discretion of the manager, who communicates with the client.
9. If the repair was not successful - then the score is reset.
As a result, if the sum of points exceeds 99, we truncate it to 99.
A good repair by statuses looks like this:
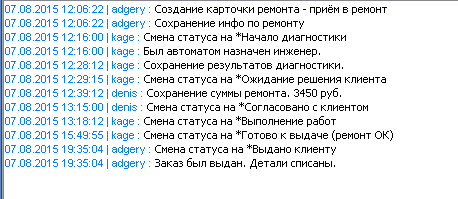
This is the second repair client. Previously, he also repaired a mobile phone in the same service center. Now the laptop, and the analysis of the status of repairs gave a positively high score.
I can upset many service providers. Of the 3,500 customer repairs with 49 points or more, about 250-270 are recruited. If you lower the score to 40, then already 550-700 customers. And, "cherry on the cake" - the average score of 37.
It was this repair (+ previous) that gave the customer 67 points of “satisfaction”.
The program maintenance repair is divided into statuses. Each repair status is characterized by a designated maximum execution time. It may be exceeded, but this is not encouraged.
The standard set of statuses for ordinary repairs looks like this:
In the "event" column there is a set of properties for the status. And so it looks like:
It is by properties that one should be guided in statuses, since far from all points are important for our analysis. Looking only related to the diagnosis, repair and waiting parts.
Each repair has a level of “customer satisfaction”; for a customer, you can get an average value or a sample for a group of equipment being repaired.
1. Choose a customer. We are looking for all the repairs on it, and as a rule they are from one to three. More than 3 is extremely rare, and in case of excess we transfer the client to the group "regular customers". If we have all 3 different devices, then we add 50 points. If 2 different devices, then add 25 points. If there is at least one repetition of repair - then 10/0 points (3/2 repair). If at least one repair has less than 10 points of “contentment”, then we deduct 10 points from the calculation.
1.a. If the client is an intermediary, then we add 25 points to it.
1.b. If a regular customer, then add him 20 points.
2. We identify the level of discipline of repair, namely, in part of the performance of work by the engineer. The engineer changed the statuses in one gulp or did it in stages. If the "salvo", then 0 points. If the status changes went step by step, with the time between shifts of 3 minutes, but no more than the designated time for the status, then we add 10 points.
3. We study the cost of repair relative to the average value of the cost of all repairs. Also - for parts that have been inserted into the repair, the difference between the price of receipt and the price in the sum of the cost of repair is revealed. If the "cost cheat" for parts is less than 10%, then +7 points. If the "cost cheat" for parts is less than 30%, then +5 points. If the "cost cheat" for parts more than 50%, then minus 10 points. If the total cost of repair is less than the average value of more than 10%, then +10 points, if the cost is within ± 10% - then 5 points, if it is above 10% - then 0 points.
4. If the client has viewed the repair card through the “client’s personal account”, then we will add 5 points. If you still leave a review, where there is the word "thank you" and there is no mate / curse, then add another 10 points. If there is at least one dirty word in the comments, then immediately minus 40 points. There are sometimes very funny comments, such as “thank you, b ** for oh *** ny repair”.
5. Term repair. If the repair was carried out within 2 working days, then add 10 points. If within 5 days, then add 5 points. If more than 14 days, then minus 15 points. More than a month - then minus 30 points.
6. If the client took the vehicle within 2 days after the status “ready to issue” - then plus 5 points.
7. For each service engineer who makes repairs, there is an assessment of the quality of their work. The value is from 0 to 99. On average, good masters have 60-70 points. The description of the counting algorithm is more objective, but we will describe the mechanism later, if necessary. So, if the master who made the repair of equipment in the order, has more than 60 points - then plus 5 points. If less, then nothing is added.
8. Loyalty score. Sets the manager - from minutes 30 to plus 30 points. All this is set at the discretion of the manager, who communicates with the client.
9. If the repair was not successful - then the score is reset.
As a result, if the sum of points exceeds 99, we truncate it to 99.
A good repair by statuses looks like this:
This is the second repair client. Previously, he also repaired a mobile phone in the same service center. Now the laptop, and the analysis of the status of repairs gave a positively high score.
I can upset many service providers. Of the 3,500 customer repairs with 49 points or more, about 250-270 are recruited. If you lower the score to 40, then already 550-700 customers. And, "cherry on the cake" - the average score of 37.
It was this repair (+ previous) that gave the customer 67 points of “satisfaction”.
And we in one service center sent out SMS messages among clients with more than 49 points in the repair of the laptop, and the average score of customer “satisfaction” was over 49. The newsletter was in July 2015 and contained the text “Dear Ivan Ivanovich. It is a hot time! And it would be good to clean your laptop from dust, so that it does not overheat and fail. We offer you a discount on cleaning your laptop - 30%. " This message was “pulled” by 3 glued SMS and the cost of 1 message was ~ 3.6 rubles. Of the 250 messages sent, more than 200 clients came for cleaning (the number is slowly increasing - people are returning from holidays). We believe that this result is very indicative.
You should not send messages to customers with lower scores - these customers are often less loyal to the service center and you can receive complaints about spamming on your part. Even if you do not forget to add a clause about repair conditions for alerts and advertisements - there will still be a not entirely pleasant response from the client.
But! Now, no less important!
Low score "customer satisfaction" for repairs should alarm the service center management. And managers should study weaknesses and flaws in order to increase customer loyalty through better provision of equipment repair services.
And, returning to regular customers and intermediary customers - they should not be forgotten about them either. It is important that they provide the proper level of service and should be especially vigilant about punctures for repairs in their case.
We continue our research - there is just a huge amount of data for them. We plan to revise the scoring in the coming month. And we will try to make a more detailed report for managers, so that they can see the essence of the algorithm in a readable form.
There will be a continuation of the article - you only need to get permission from the service centers to publish some of their data. I think that live statistics in the conditions of service centers will be interesting.
Source: https://habr.com/ru/post/293486/
All Articles