Modification of ABC analysis, or how to make a poorly working bit better
Introduction
ABC analysis is as ancient an instrument of marketers as it is clumsy. From the point of view of real data analysis, it is unlikely to be of interest. However, many who save time, and sometimes simply do not have other methods of studying the assortment matrix, resort to such a simple and in fact clumsy "ABC" analysis.
Ease of use and understanding - that's what catches the man in the street. In this article I will talk about how ABC modified the analysis for those who did not need to comprehend the details and characteristics of statistics and data analysis in the workflow. I work as an analyst in a restaurant holding and specialize in multi-format establishments, so examples will be relevant.
So organizationally it turned out that the chefs of various institutions have long used ABC as a tool for selecting dishes when forming the menu. At the same time, no attention was paid to what period was chosen (from several weeks to six months).
')
As a result, some dishes entered into the menu as special offers for a short period simply could not compete with dishes sold regularly. This happened for the reason that if a period of 3 months was chosen and salad X was on sale all 3 months, and a new salad Y was only 1, then salad X was much more likely to fall into group A or B than salad Y.
We are struggling with the disadvantage and see what happens.
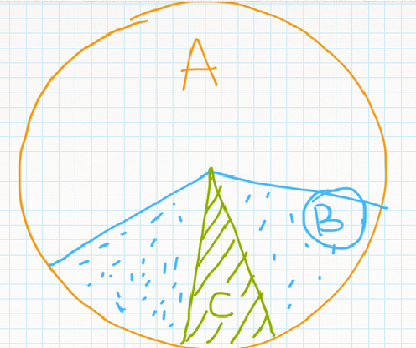
The idea of modifying ABC (let's call it “ABC +”) is to calculate for each position to which group it belongs, taking into account only the period when it was sold. That is, if this is a new product, or vice versa, it was withdrawn from the menu not so long ago, and also, if there were interruptions in the supply of ingredients, such an analysis would produce a more correct estimate for the sales of this product.
To show the differences between ABC and its modifications, for example, in the Excel package, we will create 1500 products, the sale of which per month is from 1 to 20 thousand rubles. In addition, each product appears from the 1st to the 12th month. Those. a situation will be set when different items appear in the menu at different times and are not output from sales.
Apply to ABC and ABC data with analysis A up to 50% of the cumulative (cumulative) total, B up to 80% (all above is Group C). Other gradations may be applied. In this case, counting in the ABC + array for each product including the amount of its turnover and the amount of turnover for all other products sold in the same periods with it. From this array it is calculated which group the product belongs to. A total of 1500 arrays are created (i.e. a matrix of 1500x1500). Compare the results obtained using ABC and ABC +. First, we calculate how often the products are in the same groups in different models, depending on the number of months to choose (from the very last).
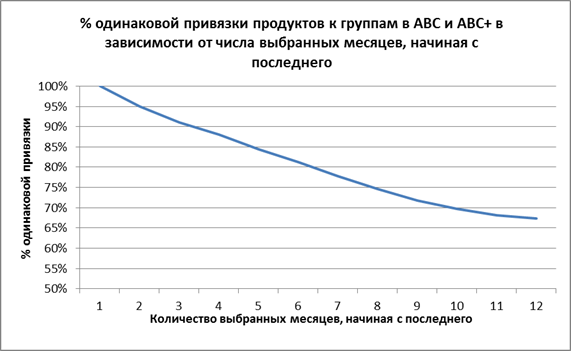
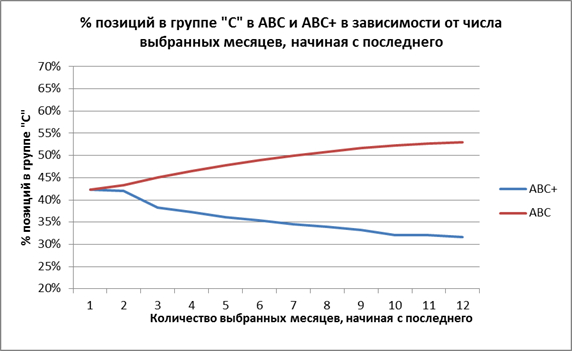
As you can see from the chart, choosing one last month, ABC + completely duplicates ABC. But considering wider time intervals, the similarity between the two instruments gradually disappears. The reason for the difference is that with increasing periods ABC is increasingly differentiating a group of products sold on a regular basis with high turnover. At the same time, ABC +, on the contrary, maximizes the potential of dishes, regardless of the number of periods. For example, let's show how the% of products in group C changes in different models with changes in the periods taken.
Conclusion
In this example, on a simplified model, it was demonstrated how, using a modification of the ABC tool, you can “smooth out” the problem that occurs when you include in the analysis of positions sold over a period not the entire selected interval. Such a tool is more suitable for workers whose duties do not directly include knowledge of statistics, but which are included in the decision-making process for entering or withdrawing products from sale.
Of course, ABC is a tool that can work with any type of metric data. It is not so important whether it is a question of a breakdown of goods, customers, expenses. However, like the usual ABC, the modification also has a number of drawbacks, namely: it does not work with seasonality, is sensitive to a small number of observations, and does not fully eliminate the principle “the rich become richer”, i.e. when the product is so loved by the customer that its popularity provides even more popularity in the future. In addition, like ABC, ABC + is better to use on a large number of data and with a large assortment matrix, additionally calculating XYZ analysis.
In conclusion, I would like to add that after the integration of ABC + in the menu of several cafes, dishes were again added that were not considered promising according to the results of the ABC analysis.
Source: https://habr.com/ru/post/293224/
All Articles