Case: How to organize work on an Internet project in Trello

Hi my name is Dima. I want to share with you the experience of working on the Carrot Quest service (link to the description of the project on Megamind). This is a service for communicating and managing users based on their behavior, in other words, marketing automation.
For a long time we were looking for a convenient form of work and how many tried various tools: we used Asana service, we worked with Scrum boards, even in Google Docs we managed to write down tasks. We were constantly looking for a methodology that was convenient for the whole team.
It seems we found what we were looking for. We want to tell you about this methodology and service.
')
About Us
We have combined the most important tools of Internet marketing in one service: eCRM, online chat, pop-up windows, email newsletter and web analytics. Synergy is a key element here, it is simply huge. Knowing about the actions of your user is more likely to involve him and bring him to the purchase.
Several programmers, a designer, a content marketer, an analyst and others are working on the project, tirelessly. The whole team does one thing in the same office, although sometimes there is remote work.
Here are our main tasks:
- product development;
- layout;
- mobile application development;
- service design;
- site design;
- content marketing (articles, cases, news, reviews, etc.)
- analytics (how our actions influence key indicators).
This is how we organized the project.
After checking the heap of services, we stopped at the most optimal - Trello .

The reasons are obvious:
- Trello is very easy to use for the whole team;
- It is ideal for task management;
- Equally important: it is free.
The tool is so great that it is not a pity to give money for it, but for some reason they chose such a business model.
In the service, you can create a large number of different boards (boards), which consist of sheets:
Boards are interconnected, and cards with azadachi can be transferred not only from one sheet to another (within one board), but also from one board to another. Just a couple of mono keys to add a picture to the task, responsible, leave a comment, etc. In general, cool.
Scrum-boards in Trello
Each startup and SaaS service should be developed by Agile, so we first used the Scrum methodology.
- We do weekly sprints;
- Saturday analysis of the sprint and planning the next one;
- Releases run on readiness.
We made several boards for the project:
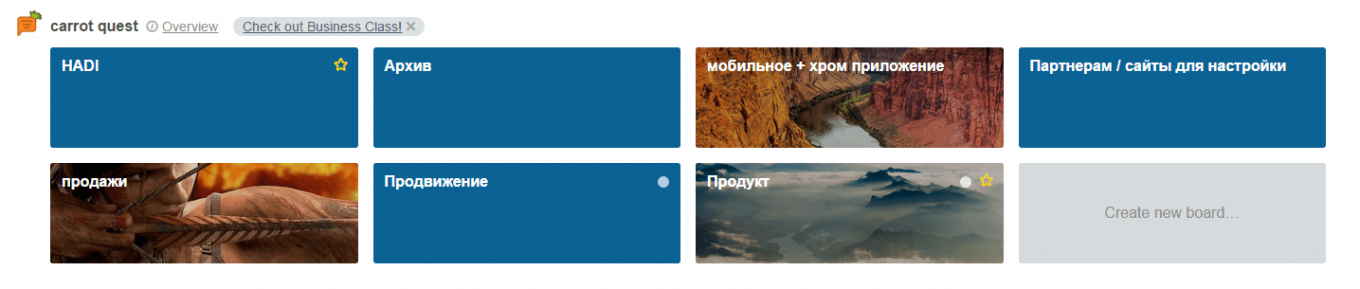
HADI board
HADI (Hypothesis, Action, Data Collection, Conclusions) is the methodology we recently talked about in detail. With the help of her, FRIA has already pumped more than 150 startups. In fact, the methodology is quite simple.
1. Hypothesis.
At the beginning of the week we set measurable hypotheses. Each hypothesis must be tied to a specific metric in order to understand what it is aimed at and to evaluate it later.
For example, if you put a video about the service in the first block of the main page, the conversion to registration will increase by 5%.
2. Action.
Do everything you need to test the hypothesis.
For example, prepare and record video, add subtitles, install video on the site, etc.
3. Data collection.
Start collecting data on indicators that are affected by the hypothesis. In our example, this is an indicator of transitions to registration. Additionally, you can watch the video viewing indicators and% registered after watching the video.
4. Conclusions.
At the end of the week draw conclusions. If the hypothesis is confirmed, then it is still necessary to work on it and improve it, if not, then test the next hypothesis.
Since in HADI, every change is tied to a metric, we had a constant problem. A lot of tasks, a lot of ideas, a mess ... It is difficult to ensure that these indicators are always tied to the task.
Trello helps us a lot in this.

We have created a board that is divided into several sheets:
- Planned (or ideas) is a list in which there are a lot of ideas and tasks that are not being solved yet. There was an idea - recorded here.
- It does not affect the metric, but it is important - not every task affects any metric. Or it is very difficult to define a dependent metric. For example: "collect and modify all jscss". In general, without a clue what it will affect, but it must be done.
- CPA - tasks that affect the CPA.
- Sreg - all that will help improve the conversion to registration, is still a hypothesis.
- Activation is an indicator that determines whether the user understood the value of the product. We have a separate method for its calculation.
- C1 - conversion to the purchase, everything that affects it.
- C2-Cn - similarly, only repeated purchases.
In fact, these are different stages of a regular sales funnel. We see how many upcoming tasks we have, and most importantly - what stage of the funnel they influence. If today the main problem of the project with activation and C1 - then we begin to solve problems from sheet C1 and Activation.
It is very important that in the comments to each task the current figures on these indicators are indicated (we are still trying to indicate where it is better to indicate this). For each metric, we made our own color - this is not just done.
Six seconds, I will tell.
At the beginning of each HADI cycle, we take several untested hypotheses and transfer them to another board (a board with current tasks). So that during further work you understand which metrics are affected by the tasks being solved. Previously, we did not look so structurally and clearly, now everyone from the team can understand everything in a split second.
Board "product"
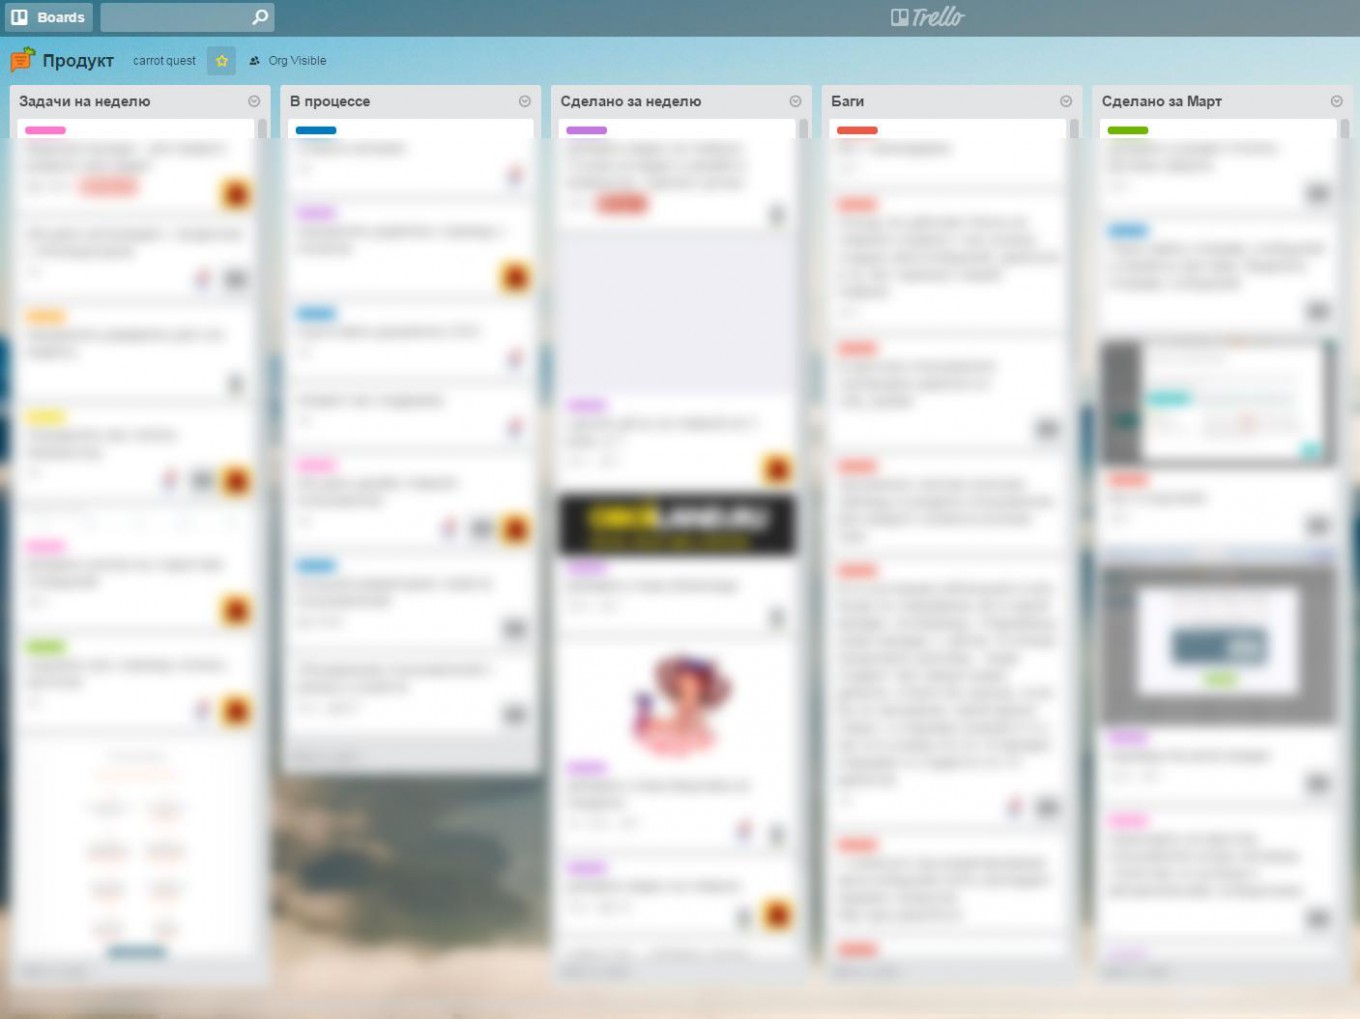
Here is presented and ongoing daily work on the project.
This is where the daily work on the project is reflected. Here is how it works:
- “Tasks for the week” - here are those tasks that we have planned for the current week or transferred them from the HADI board.
- “In process” - when each employee starts solving a problem, he simply drags it here;
- “Made in a week” - the task is completed, so I got here;
- "Bugs" - all the bugs that need to be solved.
- “Made in March” (or another month) - At the end of any month we can see what exactly was done for the period and how it affected. This information helps shape our news.
As you noticed, color is assigned to each task, this color refers them to the metrics of the HADI board. The whole team sees what the task will affect. When collecting data, we add new indicators in the comments to the tasks. We draw conclusions and decide whether to return or continue the changes.
So we organized our work. This helps to make the whole process understandable, and most importantly, controllable. The key here is to see how change affects our project.
With pleasure, the Carrot Quest team.
If you liked the article, the following materials will be useful:
1. What tools do we use to work and communicate with users
http://megamozg.ru/company/carrotquest/blog/15636/
2. How we integrated our service with Slack
http://megamozg.ru/company/carrotquest/blog/15318/
Source: https://habr.com/ru/post/291964/
All Articles