Guide: how to find a bunch of problems on your landing page

Almost everyone knows that WebVisor is behind such a tool, but for some reason many don't use it. Yes, they just do not know how to work from it to get real benefits. How to set up, what parameters to observe, what to look for, how to analyze user behavior, etc. We publish 13 basic tips on how to find the problems of your landing page in the web browser.
In May 2015, IIDF, together with Carrot Quest and Ilya Krasinsky, held an open event, Hadiweek, which aimed to boost the economy of five startups. The event analyzed the current performance of the Landing startups to pull up their problem areas. The lead speaker of the event was Ilya Krasinsky (expert and trainer of the Accelerator of IIDF, the founder of AppCraft, mentor, coach and entrepreneur in Magic Ink). One of the tools to work at the event was just Webvisor.
There are two options for analyzing the work of Landing: “quality” and “quantitative”.
')
Quantitative is a collection of metrics: the number of users from the channel and the conversion by different actions. For example, in the Carrot Quest service we collect information about all the individual actions of the user, we know all those who “fell off at any of the stages”. In the future, we turn personally to different segments and due to this we bring them to the purchase.
But it is not always possible to understand why this user left exactly at this moment or stage, for this we turn on Webvisor and make a qualitative analysis of user actions on the site.
A web browser is a tool that records the activities of visitors on your site and allows you to view them “through the eyes of the user.”
The web visitor repeats exactly:
- mouse movement;
- clicks;
- scrolling pages;
- keystrokes and form filling;
- selection and copying of text;
- visitor screen resolution.
The most important advantage of the Webvisor is: you see how the user “reads your landing page”, stops at it and carefully looks at what it misses, whether it runs faster from the main page to other sections. With the help of WebVizor Lego find errors in the structure and design of the page.
For example, when analyzing many sites, we found that some visitors in the first session did not view the main page completely, but run to the page with tariffs (sometimes this is bad, because you could not manage to activate it into the product, respectively, the value and price in the user's head may not match).
Aerobatics aerobatics - to identify some patterns (patterns) of user behavior and find out what actions prevent them from registering, activating in the product, or, conversely, that this helps. All this will help to find problem areas on the landing page, fix them and, as a result, increase the conversion.
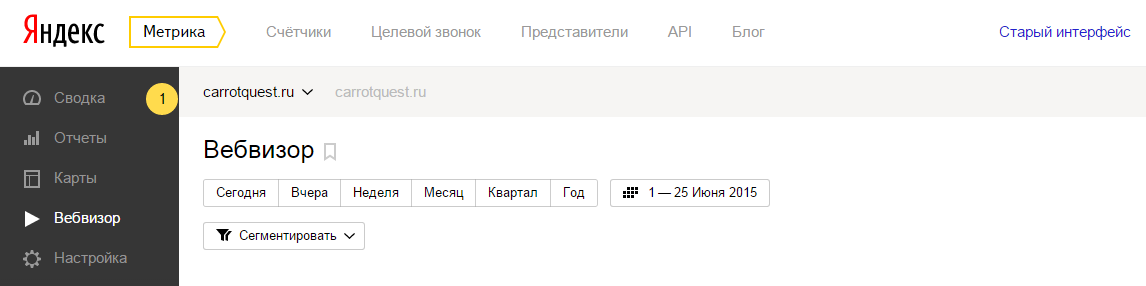
How to select users for analysis
First you need to create groups that you will check, because you must find the relationship of a certain behavior with the performance of targeted actions with a specific audience, channels of attraction (to understand the visitor's motives), etc. To do this, you can add conditions (filters) according to which you define groups of "subjects" to Yandex Metric.
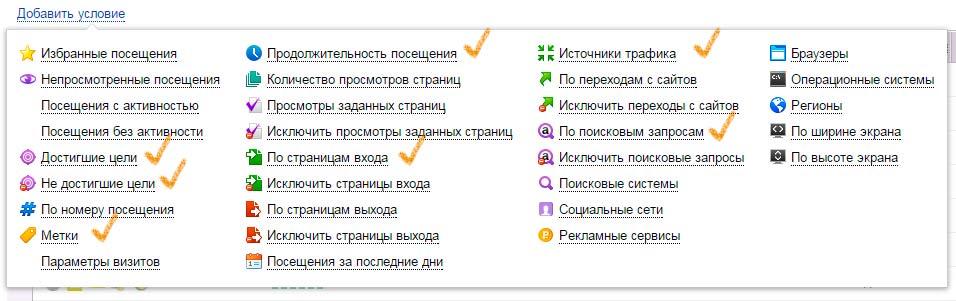
We believe that in most cases it makes sense to use just a few conditions (filters):
1. Period of time.
It seems to me that everyone is familiar with this condition. By choosing the time, you can test different versions of landing pages (compare user behavior on them). Yandex only stores the data of the webmaster for 14 days, consider this.
2. Traffic sources.
Here you choose any channel of your attraction. Channels need to be divided, because the audience in each channel is different (its level of awareness, at what stage of thinking about the purchase it is, the motives for making a purchase, etc.). Paint the differences in your audience by channels and, based on this, build your analysis.
3. Tags.
You choose the utm-tag to highlight the audience not only by channel, but also by advertising campaign. Here the main feature I see is the ability to divide the audience by the level of awareness of your product.
For example, if you are engaged in content marketing and publish articles, then you know that not all materials can write something about your company (often you write just educational material without advertising, for example, like in this article). If you tell about yourself in detail in the article, then the audience will come to you quite knowledgeable, and its behavior will differ from the audience that comes from the article without a description of you.
The Google service will help you put together such tags.
4. Duration of the visit.
Two options.
The first. You can define groups of users with a very short visit duration and analyze why they behave this way and which elements of the landing do not “cling” them and do not hold them.
Second. Select a group with a high visit duration and see where the visitor has difficulty, maybe he cannot figure out what to do and where to go on your site.
It is important that the filter with a long visit will come across those who simply turned the page and did not sit on it all this time. To cut off these users, you must additionally rank the group by ACTIVITY.
5. Achieved goals (users).
If you set up target actions for visitors in Yandex Metrics, you can filter the audience by this parameter in Webvisor. Watching such a group, you can find those actions or landing elements that help the user understand the value of the product and purchase it.
For example, 90% of the users who achieved the goal twisted the main one to the end and stopped at one of the blocks in detail, unlike those who did not reach the goal. This means that the considered block of the site plays an important role in convincing the visitor. Your task is to make sure that nobody passes by this block.
6. Not reached the goal (users).
Almost the same with the previous parameter. Only here we look at those actions that could have a negative impact on the visitor’s decision to purchase.
Everything is similar with the previous example, only for the segment that did not reach the goal.
7. Login page.
To start, be sure to test the user login page (most often, this is the main page). It defines the main patterns of behavior of the audience.
If you meaningfully devote 10-15 minutes to your webmaster every day, then you will very quickly type in a list of what can or should be changed on the site. Choose one user group for each week and analyze it daily by day.
How to analyze and what to pay attention
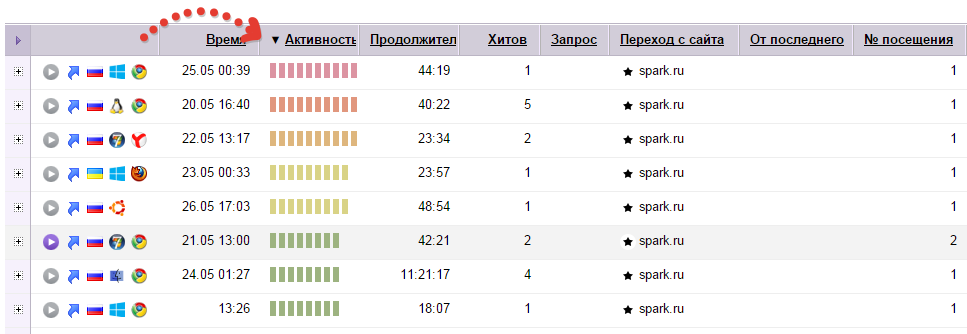
After you have selected groups of "subjects", select individually users. In this case, the choice depends on your specific goals. You can rank the list by various parameters and view additional information about users.
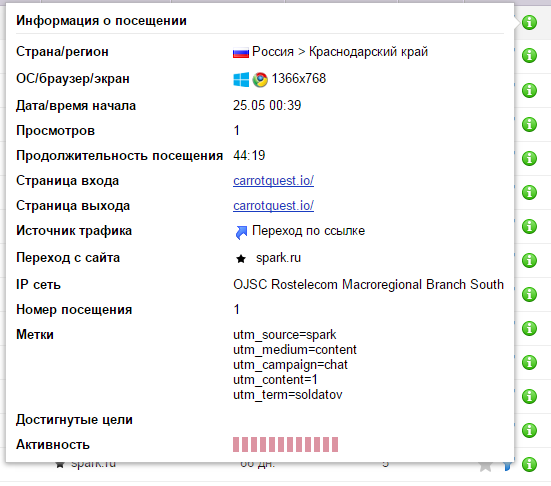
Also, the user can see a brief information (icons), so as not to open the expanded sheet of him. Below are the icons. In order: play button, arrow (means that the user came by reference), his country, operating system, browser, time and activity.

What actions to watch:
1. Reading headlines.
Landing headings play a decisive role. On average, they are read by 70-85% of visitors. Pay attention to how long the visitor stops on the headlines, whether they use the mouse over them (often while reading the text, users do this), what action they take after reading (starts to study you in detail or quickly runs through the text and leaves the site).
Here is a screenshot from the web browser when analyzing our landing page (a service for communication and user management based on their behavior) - Carrot Quest . Please note that the visitor leads the mouse through the text. It is evident that he read the main headline, he already paid less attention to the subtitle and “went” to watch a video about the service.
Remember, headlines should contain benefits for your audience - the vast majority of Internet business in Russia forgets about it. Headings can be compared with your sales department, their functions are similar.
2. Reading the text under the headings.
Usually these texts are read by only 5-15%, so do not leave the most important information in them. Pretend how much time the user sits on one block of the site, what text he can read during this time.
3. How to browse (scroll) site.
Most often, when the user is not hooked, he quickly scrolls the site to the end, quickly scrolls up and leaves. Pay attention to this behavior. If it occurs very often, it's time to think about adjusting the landing page.
Conversely, if the user stopped at some block of the landing page - this is a signal: perhaps this value proposition interested him.
3. How to interact with the forms on the site.
Do users easily fill out forms, click on buttons, etc.? Or are there any difficulties? Not everything is as simple as it may seem at first glance when designing a landing page.
It is worth seeing where users have problems filling out registration forms.
4. How your site works in other browsers and permissions.
It is advisable, of course, to check this in advance, although an extra check will not hurt.
5. Quick exit from the main page.
We already spoke about it above, but let's repeat. If the user does not yet know the value of your product (for example, came from a channel where there was almost no word about the company), then, getting to the main page, immediately “runs” from it to others (for example, to the page with tariffs), perhaps this is a problem. The main page does not cause the user to want to view it, and most often your main value is described on the main page. No value - no sales.
We often use this undervalued tool. For example, if we have changed something on the site or connected a new channel of attraction, with the help of WebVizor, we can very quickly check the audience reaction. In the example with new channels of attraction, this will prevent empty waste of your budget (otherwise landing pages may not work on this channel, and money will be spent on attracting traffic).
PS
By the way, Yandex Webvisor does not show what is happening in your admin area, because it monitors users only on the landing page. If you have a SaaS service, and you want to perform the same analysis of user behavior in the admin panel or use more features, then we recommend that you look at Web- like services: inspectlet.com , fullstory.com , mousestats.com , mouseflow.com , www.hotjar.com .
Write about your experience, share your views, ask.
With pleasure, the Carrot Quest team
Source: https://habr.com/ru/post/291924/
All Articles