Web analytics and Chinese comics: how to understand the meaning
- Holmes, web analytics shows that we have a high bounce rate. Roll up!
- Watson, but what does this have to do with payback?
Web counters generate a huge number of tsiferok, summaries and graphs, causing an unbearable ease of being a marketer. Here he read 10 tips on how to increase conversion in Yandex.Direct, looked at his charts and began to redistribute the budget until it was over. Buddy, stop! You did everything wrong.

The experience of communicating with clients and colleagues has shown that many read the metrics incorrectly and, as a result, make the wrong decisions. As a result, they simply master the budget, instead of making it work on high ROMI. We came to talk about what lies behind the zeros and bars.
')
All examples describe real events, no abstract comparisons, and tips are easy to scale for small and medium budgets.
Go.
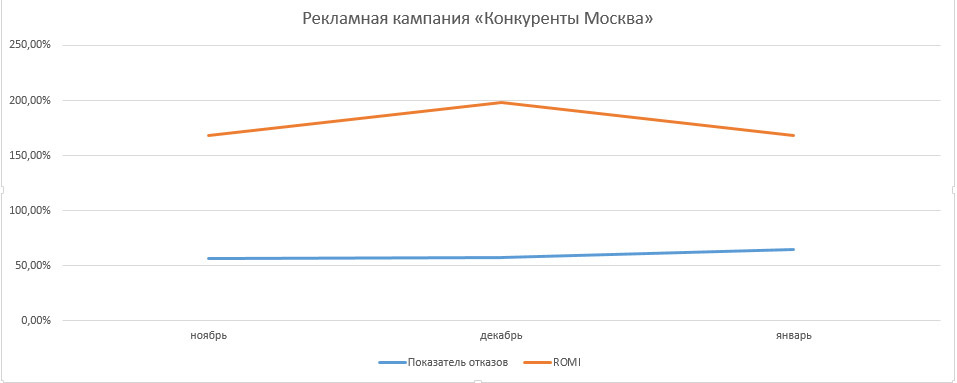
Client: I saw a bounce rate in the web counters above 50% for a number of ads and requests, this is a lot. Let's give up working with these requests, we are losing money!
Web analyst: A high bounce rate still does not say anything. For all topics and sites, the concept of a “high failure rate” is different, and you can understand which figure is yours only by trial and error. The main evaluation criteria are payback and conversion. Let's take a closer look at the ads in this campaign. We worked with semantics containing the names of competitors' brands, and the campaign had the highest failure rates - this is logical and predictable. However, such requests have low rates, and they cost a penny (literally a penny), and revenue is included in the 10 most profitable campaigns. Conclusion: you should not refuse requests, perhaps it makes sense to rewrite the text of the ad for eliminating non-target audiences.
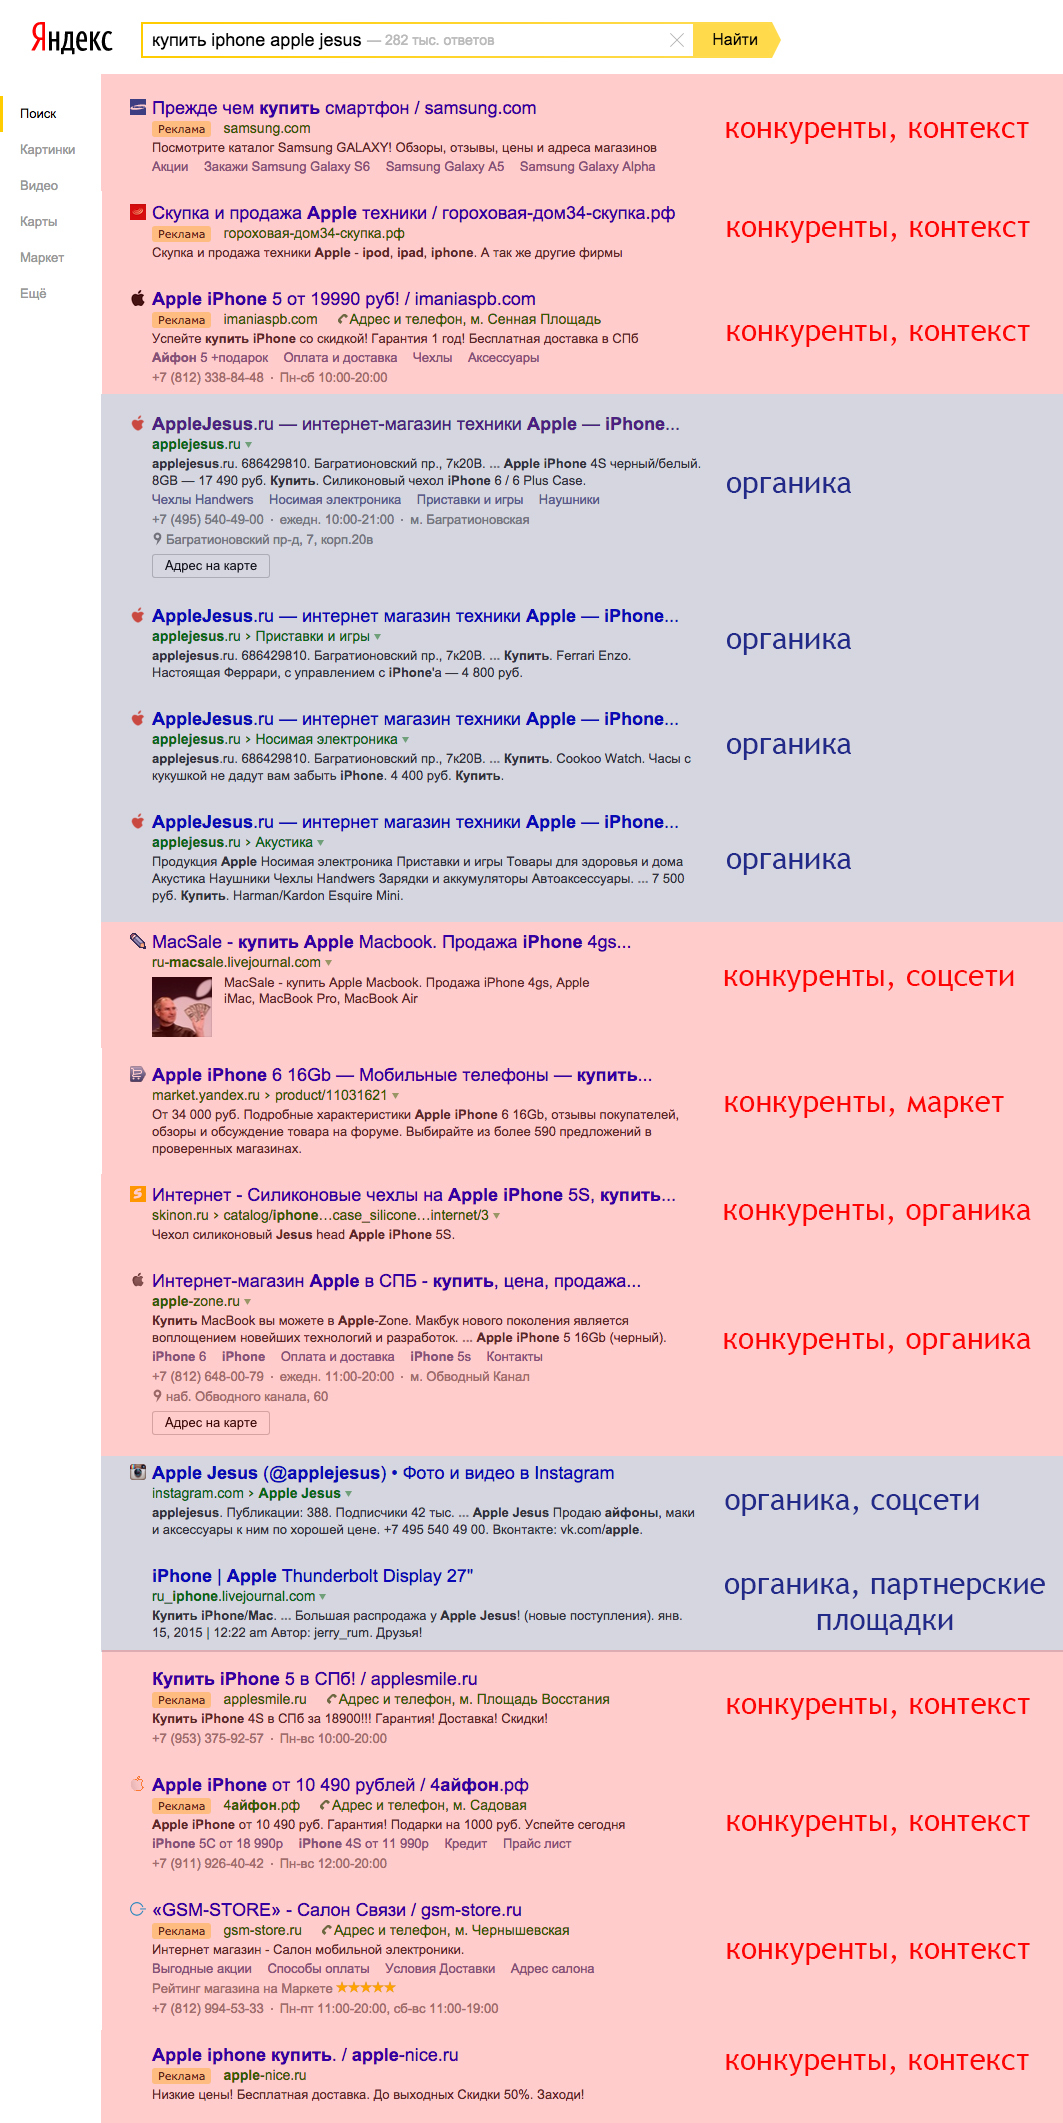
Client: Why do you offer me to give contextual ads for queries, where is the name of my brand? The company is already found, it will be in the issuance. I think this is a waste of money.
Web analyst: Indeed, it is still considered strange to buy contextual advertising for your branded search queries, because the benefits of this are not obvious. And you buy, while your brand traffic is not intercepted by competitors. First of all, the situation from the first example is quite indicative: if you do not take your place, the competitor will do it and will take away the “cheap” clients who actually were looking for you.
Secondly, customers of companies from certain topics may not understand where search results are located in search results, and where advertising is (for example, embroiderers).
Thirdly, on the search results page from 10 places of presence. It is important to fill them with as much as possible. First of all, it is a free presence at the expense of organic issuance (including through social networks and “Pictures”). 4-5 places you have provided yourself. But why not take another place? Brand traffic is, again, inexpensive, but as efficient as possible. Total, at least 50% of your issuance, and the chance that they will come to you is 1: 2 in your favor.
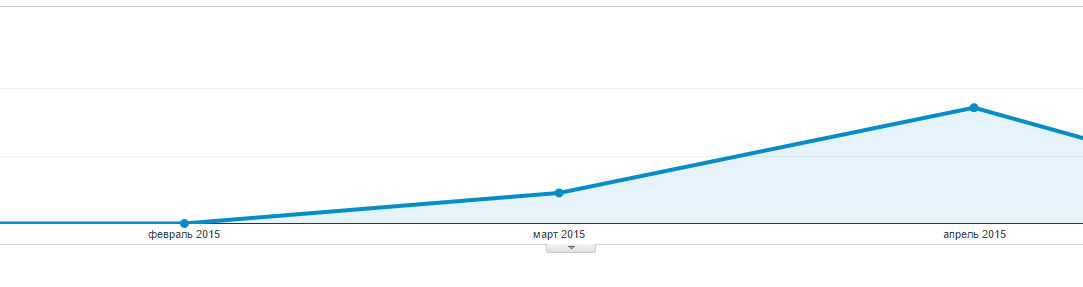
Client: We ordered and paid priority placement on Yandex Maps for three months - of course there is traffic, but the income is minimal, the conversion is low, ROMI is negative. I see no reason to develop this tool.
Web analyst: Evidence of the effectiveness of geolocation does not need to look in the counters - they are not there. People use maps for the same thing as 100 years ago - to get there, to get, to find yourself. Indirect indicators of successful work with geolocation: we observed an increase in live traffic to online and offline stores (online traffic increased 3.6 times in a month), tracked the effectiveness of the channel through call tracking on phone numbers set specifically for geolocation cards. Bottom line: we started working more closely with traffic through geolocation, encouraging customers to leave feedback on cards, periodically changing the description for current promotions.
The growth of traffic on the channel "Maps"
Client: I looked at web analytics and saw that email is among the top three tools with the lowest conversion. We are sending something, but people are not very actively buying. Let's turn off this channel, concentrate on Direct.
Web analyst: The sensible return in numbers from email and display advertising will always be questionable. These are tools from the fog, which are almost not visible in the counters. For example, the other day we have sent out a January 16 newsletter. Rechecked, really from January 16th. The buyer can read the letter, postpone it, change his mind, forget, remember, save up and buy. Buy from another device, from another mail, at another time, and the counter will not show that the delivery has led it.
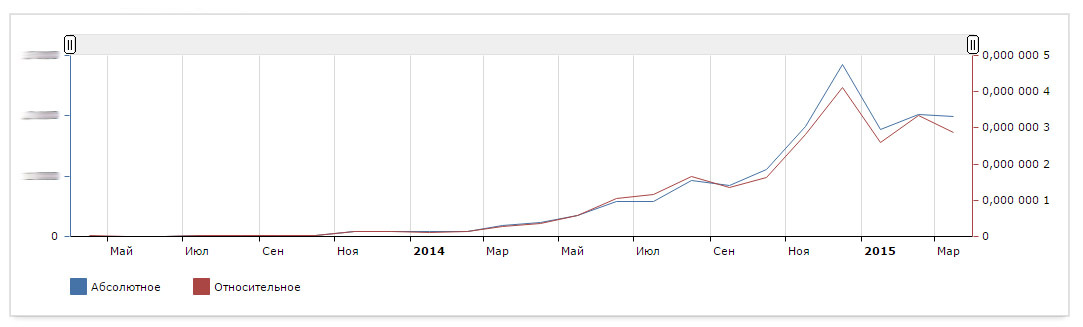
With the magic one is even more difficult: it is shown for the most part not to stimulate purchases. This is image advertising, which works on quality indicators (formation and retention of interest, loyalty, etc.), and not on quantitative ones. But the exhaust in numbers can be traced indirectly: with the launch of display advertising and email marketing, organic brand traffic should grow steadily. On our graphics from Wordstat you can clearly see how brand traffic began to rise with the start of work on awareness raising in October.
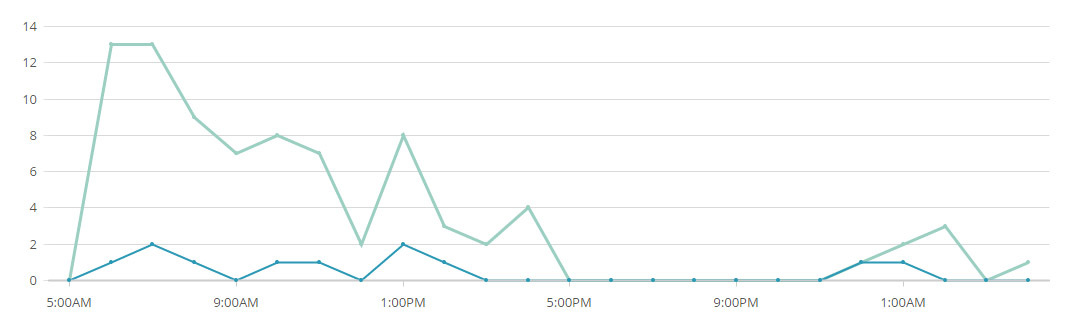
In addition, you need to take into account the peculiarities of the purchase process in each product category. For example, in the “large household appliances” category, people place orders mainly on weekends, carefully study offers, consult with their family, plan a place in the budget and delivery time, etc. A long period of customer ripening does not allow to accurately track all orders: a letter with a share can come to the mail of the father of the family, and the order will be made in 2 weeks from the grandmother's phone However, knowledge of the features of the audience still allows for a more accurate setting of advertising campaigns. For example, we began to announce stocks 10 days before they begin, so that the client would “ripen” for a certain time before buying. Indeed, the “tail” of discoveries and clicks stretches steadily for 2-3 weeks.
Heterogeneous daily activity graph
Tail length of 3 months

Client: Why do people spend so little time on the site? My friend’s average viewing depth is up to 20 minutes! Let's redo the site, it's bad, people don't like it.
Web analyst: Viewing depth is another indicator that can be interpreted in different ways, as well as the level of failures. Behind the great depth of viewing, bad usability can be hidden: people are persistently looking for a feedback form all over the site and cannot find it. And in a parallel universe, customers find the right information in 30 seconds on the first page and, satisfied, leave. Meanwhile, the counter registers a small depth of views.
Client: I counted ROMI for contextual advertising, this tool is unprofitable, let's give it up.
Web analyst: It is worth digging deeper and separating the wheat from the chaff. It is possible (as it was with us) that you should turn off not the entire campaign, but individual unprofitable ads, or maybe just some separate request in this ad. There is a high probability that unprofitable ads pumped a lot of money out of the budget, sharply turning the campaign payback to minus. This problem is not solved by analytics, but by continuous testing of the entire ad pool for each campaign. We started with a pool of 34 ads, during testing and rigorous selection we turned off 31 ineffective ads, leaving only 3 for the entire campaign, but from ROMI to 755%. The budget was redistributed among them, and the campaign began to generate revenue.
PS What do we want to say with all this? Analytics needs analytics. Namely, in a competent analyst, who will look through his eyes, he will think with his head and will refer to logic, and not to the figure in the summary. Because the number itself means little.
Last tip on how not to do:
If you are confronted with a strange or one-way interpretation of data from the meters, welcome to the comments - share your impressions and misconceptions.
- Watson, but what does this have to do with payback?
Web counters generate a huge number of tsiferok, summaries and graphs, causing an unbearable ease of being a marketer. Here he read 10 tips on how to increase conversion in Yandex.Direct, looked at his charts and began to redistribute the budget until it was over. Buddy, stop! You did everything wrong.
The experience of communicating with clients and colleagues has shown that many read the metrics incorrectly and, as a result, make the wrong decisions. As a result, they simply master the budget, instead of making it work on high ROMI. We came to talk about what lies behind the zeros and bars.
')
All examples describe real events, no abstract comparisons, and tips are easy to scale for small and medium budgets.
Go.
Bounce rate
Client: I saw a bounce rate in the web counters above 50% for a number of ads and requests, this is a lot. Let's give up working with these requests, we are losing money!
Web analyst: A high bounce rate still does not say anything. For all topics and sites, the concept of a “high failure rate” is different, and you can understand which figure is yours only by trial and error. The main evaluation criteria are payback and conversion. Let's take a closer look at the ads in this campaign. We worked with semantics containing the names of competitors' brands, and the campaign had the highest failure rates - this is logical and predictable. However, such requests have low rates, and they cost a penny (literally a penny), and revenue is included in the 10 most profitable campaigns. Conclusion: you should not refuse requests, perhaps it makes sense to rewrite the text of the ad for eliminating non-target audiences.
Brand traffic
Client: Why do you offer me to give contextual ads for queries, where is the name of my brand? The company is already found, it will be in the issuance. I think this is a waste of money.
Web analyst: Indeed, it is still considered strange to buy contextual advertising for your branded search queries, because the benefits of this are not obvious. And you buy, while your brand traffic is not intercepted by competitors. First of all, the situation from the first example is quite indicative: if you do not take your place, the competitor will do it and will take away the “cheap” clients who actually were looking for you.
Secondly, customers of companies from certain topics may not understand where search results are located in search results, and where advertising is (for example, embroiderers).
Thirdly, on the search results page from 10 places of presence. It is important to fill them with as much as possible. First of all, it is a free presence at the expense of organic issuance (including through social networks and “Pictures”). 4-5 places you have provided yourself. But why not take another place? Brand traffic is, again, inexpensive, but as efficient as possible. Total, at least 50% of your issuance, and the chance that they will come to you is 1: 2 in your favor.
Geolocation
Client: We ordered and paid priority placement on Yandex Maps for three months - of course there is traffic, but the income is minimal, the conversion is low, ROMI is negative. I see no reason to develop this tool.
Web analyst: Evidence of the effectiveness of geolocation does not need to look in the counters - they are not there. People use maps for the same thing as 100 years ago - to get there, to get, to find yourself. Indirect indicators of successful work with geolocation: we observed an increase in live traffic to online and offline stores (online traffic increased 3.6 times in a month), tracked the effectiveness of the channel through call tracking on phone numbers set specifically for geolocation cards. Bottom line: we started working more closely with traffic through geolocation, encouraging customers to leave feedback on cards, periodically changing the description for current promotions.
The growth of traffic on the channel "Maps"
Email and Media
Client: I looked at web analytics and saw that email is among the top three tools with the lowest conversion. We are sending something, but people are not very actively buying. Let's turn off this channel, concentrate on Direct.
Web analyst: The sensible return in numbers from email and display advertising will always be questionable. These are tools from the fog, which are almost not visible in the counters. For example, the other day we have sent out a January 16 newsletter. Rechecked, really from January 16th. The buyer can read the letter, postpone it, change his mind, forget, remember, save up and buy. Buy from another device, from another mail, at another time, and the counter will not show that the delivery has led it.
With the magic one is even more difficult: it is shown for the most part not to stimulate purchases. This is image advertising, which works on quality indicators (formation and retention of interest, loyalty, etc.), and not on quantitative ones. But the exhaust in numbers can be traced indirectly: with the launch of display advertising and email marketing, organic brand traffic should grow steadily. On our graphics from Wordstat you can clearly see how brand traffic began to rise with the start of work on awareness raising in October.
In addition, you need to take into account the peculiarities of the purchase process in each product category. For example, in the “large household appliances” category, people place orders mainly on weekends, carefully study offers, consult with their family, plan a place in the budget and delivery time, etc. A long period of customer ripening does not allow to accurately track all orders: a letter with a share can come to the mail of the father of the family, and the order will be made in 2 weeks from the grandmother's phone However, knowledge of the features of the audience still allows for a more accurate setting of advertising campaigns. For example, we began to announce stocks 10 days before they begin, so that the client would “ripen” for a certain time before buying. Indeed, the “tail” of discoveries and clicks stretches steadily for 2-3 weeks.
Heterogeneous daily activity graph
Tail length of 3 months
Viewing depth
Client: Why do people spend so little time on the site? My friend’s average viewing depth is up to 20 minutes! Let's redo the site, it's bad, people don't like it.
Web analyst: Viewing depth is another indicator that can be interpreted in different ways, as well as the level of failures. Behind the great depth of viewing, bad usability can be hidden: people are persistently looking for a feedback form all over the site and cannot find it. And in a parallel universe, customers find the right information in 30 seconds on the first page and, satisfied, leave. Meanwhile, the counter registers a small depth of views.
Unprofitable campaigns
Client: I counted ROMI for contextual advertising, this tool is unprofitable, let's give it up.
Web analyst: It is worth digging deeper and separating the wheat from the chaff. It is possible (as it was with us) that you should turn off not the entire campaign, but individual unprofitable ads, or maybe just some separate request in this ad. There is a high probability that unprofitable ads pumped a lot of money out of the budget, sharply turning the campaign payback to minus. This problem is not solved by analytics, but by continuous testing of the entire ad pool for each campaign. We started with a pool of 34 ads, during testing and rigorous selection we turned off 31 ineffective ads, leaving only 3 for the entire campaign, but from ROMI to 755%. The budget was redistributed among them, and the campaign began to generate revenue.
PS What do we want to say with all this? Analytics needs analytics. Namely, in a competent analyst, who will look through his eyes, he will think with his head and will refer to logic, and not to the figure in the summary. Because the number itself means little.
Last tip on how not to do:
If you are confronted with a strange or one-way interpretation of data from the meters, welcome to the comments - share your impressions and misconceptions.
Source: https://habr.com/ru/post/290556/
All Articles