How to use data for planning a startup budget?
Rotem Landa is CFO at Yotpo. Prior to that, he worked for PriceWaterhouse Coopers for seven years as a senior manager of a high-tech group in Israel, working mainly with start-ups and VC.
How can a startup use data to create a formula if it is at an unpredictable growth stage? Costs are inextricably linked to the flow of profits, but in the case of a startup, forecasting costs is more like a fortune telling on a magic ball. In such an unstable environment, a planned budget can collapse for a variety of reasons: unmet goals, unpredictable success, or a shift in focus. In any case, the data can still (and should) be used in budget planning.
Over the past ten years, I have been following a large number of startups and companies, including the few that have entered the market. During this time, I have seen many companies that could barely keep afloat, because their budget has dried up.
Investors recommend start-ups that need a few more years before their initial public offering to look at developed companies and plan their budget. At the moment, too many companies continue to focus on where they are now, instead of planning where they want to go.
When I came to Yotpo, I put together a formula that we used at Yotpo and that can help other financial directors and senior executives plan a budget for SaaS startups after stage B. Although it’s a fairly high-level tool, it can help you understand the direction in which to move so you can create a budget based on the available data.
')
Choose from five to ten similar and successful public companies. It is very important to focus on companies that have the same audience and the average number of orders. For example, Yotpo focused on ZenDesk and Hubspot, among other things, which are listed in the table below.
Find each company’s first public report. For companies in the New York Stock Exchange, you can find them here.
Look at their profits and losses two years before the first stock offering, and find their S-1 / F-1 reports for the first year. For example, to see S-1 for a company that completed an IPO based on the results as of December 31, 2014, find its results as of December 31, 2012.
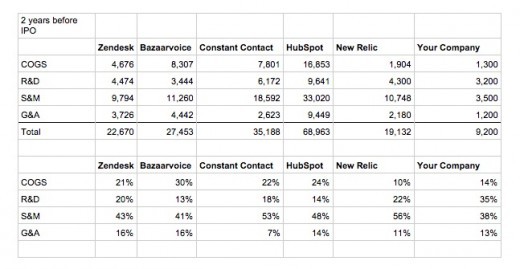
Using this data, examine the cost of sales / cost of sales and operating expenses of each company. Collect the values and calculate for each indicator the percentage of total costs.
Below is an example we have made with a general conclusion at which stage your company's indicators may get stuck.
After determining the percentage of indicators, create a graph to visualize how your plans are moving in the right direction.
Use charts to understand how the breakdown of these companies' expenditures corresponds to your planned budget and use of funds.
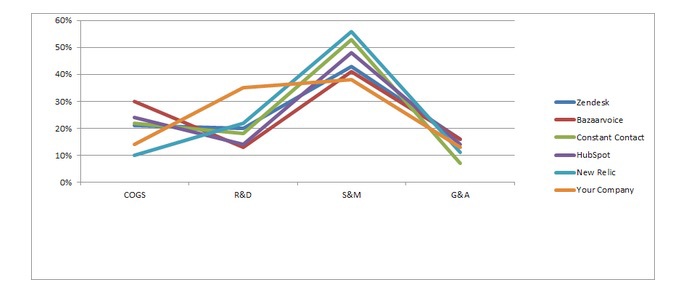
In this example, you can see that the compared company had more research and development costs, but less marketing and implementation costs than the rest at our growth stage.
In general, we learned from this example that companies at this stage of growth had a 2: 1 ratio - for every $ 1 spent on research and development, they spent $ 2 on marketing. Too many young startups, it may seem illogical, but everything indicates that growth is essential to give priority to sales and marketing.
More research costs - If you have even more than two years before the initial public offering, you should increase research costs, since most of the resources should be spent on development in the initial stages, and software can be very difficult (as in the case of New Relic). At the same time, do not let this assumption destroy your budget: watch carefully whether your technical director or research director does not require more resources than necessary, or if there is an imbalance created by research, resulting in insufficient funds for other departments.
Less sales and marketing costs - Again, if you have more than two years prior to the initial public offering, this is reasonable, but not like having to check if your marketing team gets enough resources, because during the years of growth you should focus on marketing a large amount of resources.
Less implementation costs - In general, we can say that companies with weak support and account management usually have less implementation costs, but if this is not your case, and you receive a large number of requests, registrations and calls, check whether there are enough resources You are directing into this sphere.
This formula allows you to highlight the main weaknesses of your budget, while giving you a clear understanding of how to plan for the future. Comparing the budget of your own company with other successful companies, you can understand exactly what you need to do and what you want to come to.
How can a startup use data to create a formula if it is at an unpredictable growth stage? Costs are inextricably linked to the flow of profits, but in the case of a startup, forecasting costs is more like a fortune telling on a magic ball. In such an unstable environment, a planned budget can collapse for a variety of reasons: unmet goals, unpredictable success, or a shift in focus. In any case, the data can still (and should) be used in budget planning.
Over the past ten years, I have been following a large number of startups and companies, including the few that have entered the market. During this time, I have seen many companies that could barely keep afloat, because their budget has dried up.
Investors recommend start-ups that need a few more years before their initial public offering to look at developed companies and plan their budget. At the moment, too many companies continue to focus on where they are now, instead of planning where they want to go.
When I came to Yotpo, I put together a formula that we used at Yotpo and that can help other financial directors and senior executives plan a budget for SaaS startups after stage B. Although it’s a fairly high-level tool, it can help you understand the direction in which to move so you can create a budget based on the available data.
')
Stage 1: Look at developed companies
Choose from five to ten similar and successful public companies. It is very important to focus on companies that have the same audience and the average number of orders. For example, Yotpo focused on ZenDesk and Hubspot, among other things, which are listed in the table below.
Stage 2: Begin to dig into the data
Find each company’s first public report. For companies in the New York Stock Exchange, you can find them here.
Look at their profits and losses two years before the first stock offering, and find their S-1 / F-1 reports for the first year. For example, to see S-1 for a company that completed an IPO based on the results as of December 31, 2014, find its results as of December 31, 2012.
Step 3: Calculate the percentage of indicators
Using this data, examine the cost of sales / cost of sales and operating expenses of each company. Collect the values and calculate for each indicator the percentage of total costs.
Below is an example we have made with a general conclusion at which stage your company's indicators may get stuck.
Stage 4: Create a Result Graph
After determining the percentage of indicators, create a graph to visualize how your plans are moving in the right direction.
Step 5: Compare and Plan
Use charts to understand how the breakdown of these companies' expenditures corresponds to your planned budget and use of funds.
In this example, you can see that the compared company had more research and development costs, but less marketing and implementation costs than the rest at our growth stage.
In general, we learned from this example that companies at this stage of growth had a 2: 1 ratio - for every $ 1 spent on research and development, they spent $ 2 on marketing. Too many young startups, it may seem illogical, but everything indicates that growth is essential to give priority to sales and marketing.
More research costs - If you have even more than two years before the initial public offering, you should increase research costs, since most of the resources should be spent on development in the initial stages, and software can be very difficult (as in the case of New Relic). At the same time, do not let this assumption destroy your budget: watch carefully whether your technical director or research director does not require more resources than necessary, or if there is an imbalance created by research, resulting in insufficient funds for other departments.
Less sales and marketing costs - Again, if you have more than two years prior to the initial public offering, this is reasonable, but not like having to check if your marketing team gets enough resources, because during the years of growth you should focus on marketing a large amount of resources.
Less implementation costs - In general, we can say that companies with weak support and account management usually have less implementation costs, but if this is not your case, and you receive a large number of requests, registrations and calls, check whether there are enough resources You are directing into this sphere.
This formula allows you to highlight the main weaknesses of your budget, while giving you a clear understanding of how to plan for the future. Comparing the budget of your own company with other successful companies, you can understand exactly what you need to do and what you want to come to.
Useful Paysto solutions for Megamind readers:
→ Get paid by credit card right now. Without a site, PI and LLC.
→ Accept payments from companies via the Internet. Without a site, PI and LLC.
→ Acceptance of payments from companies for your site. With document circulation and exchange of originals.
→ Automation of sales and service transactions with legal entities. Without intermediary in the calculations.
→ Accept payments from companies via the Internet. Without a site, PI and LLC.
→ Acceptance of payments from companies for your site. With document circulation and exchange of originals.
→ Automation of sales and service transactions with legal entities. Without intermediary in the calculations.
Source: https://habr.com/ru/post/289928/
All Articles