Manager's Daily Report
It often happens that several remote teams are working on the implementation of a single project. Each team is in its own office, in its own city or even country. It also happens that teams share not only distances, but also time zones. It is necessary to somehow coordinate the work of these teams.
The first goal. In large and medium-sized projects, often the necessary information does not reach the recipients at the right time. It is necessary to bring information to the interested persons in time.
The second goal. Communication should be established between remote teams. If the work of one team is blocked by inaction or by some actions of another team, then this should be reported as soon as possible.
')
The third goal. People involved in a large project are often overloaded with work. There is not enough time to work directly - not the same as preparing a report. Nevertheless, it is better to adhere to the principle - to simplify the work of colleagues. No matter how busy you are, your colleagues may be more busy. Therefore, in spite of the fact that often the necessary information can be extracted by consumers independently, it is better to prepare this information for your colleagues themselves. Agree that it is much easier to read someone’s already prepared report than to extract the same information independently from the task control system.
The manager’s daily report is issued as an e-mail and sent to the Daily Reports group, to which all project participants are subscribed.
Practice shows that a manager spends about 15 minutes writing a report. Most correctly, if the manager writes a report not before leaving the office, but forms it during the working day.
The daily report of the manager consists of 4 sections.
Status
In this section, the manager reports on the current status of the project. Three values are possible:
If the manager indicates the status “as planned”, this means that the team manages to complete all the planned tasks by the deadline, and there are no prerequisites for disrupting the project.
If the manager indicates that the project is “under supervision,” this means that the team is moving at a slower speed than necessary in order to be on time with the implementation of all tasks. However, the risk of “not having time” is not too strong, and it can be eliminated by overtime. This should take into account one important aspect - the time for which the team is late, should not exceed the day the work of the whole team. Those. it should be easily compensated by overtime. The status of “under observation” should also be put when there are any risks or problems that could lead to a breakdown of the deadlines, but the probability of their triggering is not high.
If the manager indicates the status “under threat”, then this means that there is a high risk of disrupting the project. The team’s backlog from the schedule is significant, and one day of overtime work cannot compensate for this backlog. The status of “threatened” also makes sense when there are threats that can disrupt the project, and the likelihood of their triggering is high, and the negative consequences are serious.
If the manager puts the status "under threat" or "under supervision", then he must offer solutions to that part of the problems that depend on his team.
Statistics
In this section, the manager provides some team statistics. As a rule, this is the amount of work (in man-hours) and available resources (in man-hours), which remained until the end of the sprint.
EXAMPLE.
Workload: 532 hours
Resources: 480 hours
Backlog: 52 hours
Progress
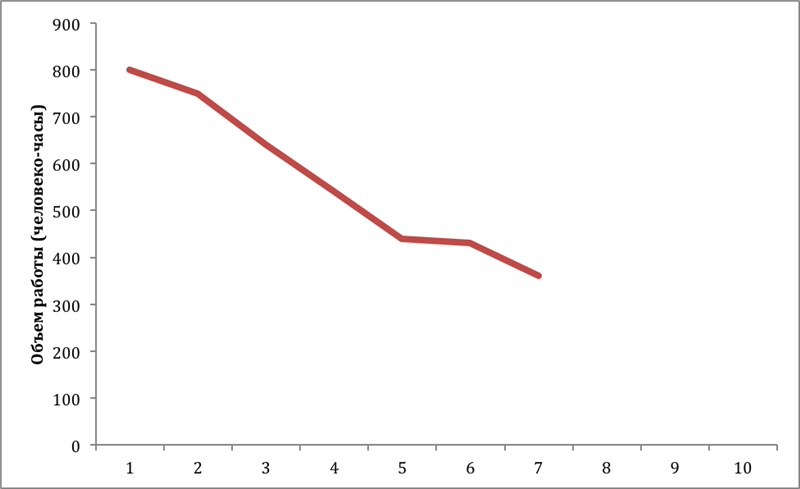
In this section, the manager provides objective information about the progress of the team. If a report is written at the production stage, then such information includes statistics - how much tasks (in man-hours) have already been completed and how much is left. Often, such statistics are presented in graphical form - in the form of a task combustion diagram. The diagram is a broken line that shows the change in the amount of work over an interval of time. In fact, this is the speed at which the team performs the work.
EXAMPLE. Task combustion diagram for a team of 10 engineers for a two-week sprint.
If the report is generated at the stage of post-production, then the information on the progress includes the number or list of defects corrected for the current day.
EXAMPLE.
Fixed: 35 defects
Plan: 40 defects
Backlog: 5 defects
Risks and problems
In this section, the manager lists risks, threats, problems, or dependencies on other teams that could lead to deadlines and that cannot be fixed by the efforts of the local team.
EXAMPLES.
Online jobs are blocked because there is no connection to the server.
Unable to add changes because the build is broken. It is necessary to fix the build.
Targets and goals
The first goal. In large and medium-sized projects, often the necessary information does not reach the recipients at the right time. It is necessary to bring information to the interested persons in time.
The second goal. Communication should be established between remote teams. If the work of one team is blocked by inaction or by some actions of another team, then this should be reported as soon as possible.
')
The third goal. People involved in a large project are often overloaded with work. There is not enough time to work directly - not the same as preparing a report. Nevertheless, it is better to adhere to the principle - to simplify the work of colleagues. No matter how busy you are, your colleagues may be more busy. Therefore, in spite of the fact that often the necessary information can be extracted by consumers independently, it is better to prepare this information for your colleagues themselves. Agree that it is much easier to read someone’s already prepared report than to extract the same information independently from the task control system.
rules
The manager’s daily report is issued as an e-mail and sent to the Daily Reports group, to which all project participants are subscribed.
Practice shows that a manager spends about 15 minutes writing a report. Most correctly, if the manager writes a report not before leaving the office, but forms it during the working day.
Report template
The daily report of the manager consists of 4 sections.
Status
In this section, the manager reports on the current status of the project. Three values are possible:
- the project is proceeding as planned;
- the project is being monitored;
- The project is under threat.
If the manager indicates the status “as planned”, this means that the team manages to complete all the planned tasks by the deadline, and there are no prerequisites for disrupting the project.
If the manager indicates that the project is “under supervision,” this means that the team is moving at a slower speed than necessary in order to be on time with the implementation of all tasks. However, the risk of “not having time” is not too strong, and it can be eliminated by overtime. This should take into account one important aspect - the time for which the team is late, should not exceed the day the work of the whole team. Those. it should be easily compensated by overtime. The status of “under observation” should also be put when there are any risks or problems that could lead to a breakdown of the deadlines, but the probability of their triggering is not high.
If the manager indicates the status “under threat”, then this means that there is a high risk of disrupting the project. The team’s backlog from the schedule is significant, and one day of overtime work cannot compensate for this backlog. The status of “threatened” also makes sense when there are threats that can disrupt the project, and the likelihood of their triggering is high, and the negative consequences are serious.
If the manager puts the status "under threat" or "under supervision", then he must offer solutions to that part of the problems that depend on his team.
Statistics
In this section, the manager provides some team statistics. As a rule, this is the amount of work (in man-hours) and available resources (in man-hours), which remained until the end of the sprint.
EXAMPLE.
Workload: 532 hours
Resources: 480 hours
Backlog: 52 hours
Progress
In this section, the manager provides objective information about the progress of the team. If a report is written at the production stage, then such information includes statistics - how much tasks (in man-hours) have already been completed and how much is left. Often, such statistics are presented in graphical form - in the form of a task combustion diagram. The diagram is a broken line that shows the change in the amount of work over an interval of time. In fact, this is the speed at which the team performs the work.
EXAMPLE. Task combustion diagram for a team of 10 engineers for a two-week sprint.
If the report is generated at the stage of post-production, then the information on the progress includes the number or list of defects corrected for the current day.
EXAMPLE.
Fixed: 35 defects
Plan: 40 defects
Backlog: 5 defects
Risks and problems
In this section, the manager lists risks, threats, problems, or dependencies on other teams that could lead to deadlines and that cannot be fixed by the efforts of the local team.
EXAMPLES.
Online jobs are blocked because there is no connection to the server.
Unable to add changes because the build is broken. It is necessary to fix the build.
Source: https://habr.com/ru/post/289274/
All Articles