How to collect reports from employees and not get into Excel Hell
Earlier, we already wrote about Excel Hell and possible solutions. Today we want to consider in more detail one of the cases - namely, the mess that occurs when collecting data from employees or branches in Excel files.
The task of collecting data from departments is relevant if we do not have a single accounting system from which we can always get information. For medium and large businesses, these can be periodic reports sent to the parent company, and for small businesses, for example, daily time-sheets or project reports.
There is a manager who is interested in obtaining a summary of the divisions. He sets the task for his nearest subordinate (let's call him “analyst”) about receiving this report.
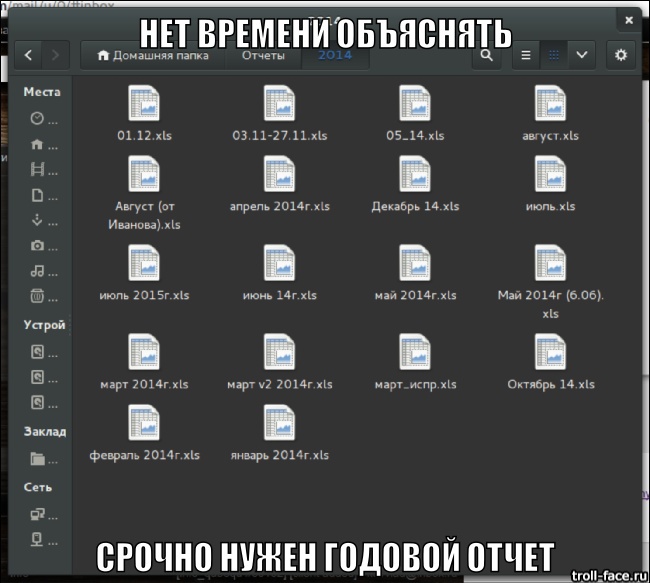
The obvious solution for the analyst is to create an Excel template, which he sends out to departments. In turn, there are employees in the units who possess this information. They fill out the templates and send the files back to the analytics by mail. Half of them are wrong and send the corrected file the next day.
As a result, the analyst spends two days consolidating all these files into one and preparing a summary report. The manager, after reviewing the summary report, understands that there is not enough data in it, and asks to add another column that the analyst has not provided. And the whole chain is repeated from the beginning, “v2.xls templates” are sent, reporting staff fill them in and send them back. As a result, the analyst has two data sets, and only he can understand which of them are relevant.
')
And now the manager is starting to like this report and he wants to receive it every month. After some time, he wants to watch it in dynamics and by department, which means that our analyst will have to process all the accumulated files for previous periods, including sort out their versions, merge into a new summary report, etc. etc. So we got a large block of useful data that no one can use.
This is a typical Excel Hell situation in an organization.
Consider the main problems in this process.
Each of the voiced problems, of course, has a solution.
Errors when filling? - You can limit the available values in the cells.
Different versions of the data? - get a spreadsheet in Google Spreadsheet or put Sharepoint.
Typical operations? - write a macro in Excel.
Historical data? - make Excel spreadsheet or develop your database.
Changing the structure? - to train SQL analytics, if at the previous stage DB was made.
Efficiency? - Regulate the process and pay premiums for meeting deadlines.
However, all these decisions require a systematic approach, putting in order all the processes and data sources, often also external consulting. You can also implement a comprehensive solution for a year and a half, automating all processes, thanks to which, theoretically, there will be no need to assemble such a report.
We think that there is a solution that does not require large expenditures on the implementation and restructuring of your business processes, but facilitates access to your information and work with it.
There is a set of conditions that must be met in this process.
Now we will try, under these conditions, to get rid of the problems described above:
We tried to implement all this in our system - QuBeQu (Kubeku). The basic unit of information is not a file, but an indicator with a set of analytical features. In QuBeQu, there is a form and report designer, where the user can quickly create a form of a specific structure consisting of a set of indicators with the specified attributes. When filling out the form, the data will be stored in a single repository, as the value of the indicator for the specified values of signs.
Accordingly, in the summary report, the values of this indicator will be automatically delivered (or calculated by the formula). For ease of filling out forms, we support import from Excel, copy-paste via the clipboard and keyboard navigation on the table. All data is fully versioned. Even if we delete the value in the cell, we can show what number was there, who entered it and who deleted it. In addition, to ensure the traceability of information, all calculated and aggregated values can be disclosed to the original data - you do not need to run through Excel cells and understand what a particular formula means. Formulas are not written in terms of the position of the cells in the table, but in terms of indicators and their signs, i.e. in QuBeQu “Revenue” = ”Revenue” - ”Expense”, not “A1 = B1-C1”.
You will surely say that the support of such a system is costly, because it does not happen that “everything works by itself”. But try to compare how much time an analyst would spend on mixing information from files with the time he would spend on the system. Even if these are values of the same order, we get a fundamentally different result.
All the data that we received from the reporting staff are structured, they can be quickly and easily used, they will not be lost. There is a single place to store information, and if there are a lot of analysts, managers, and reporting employees, a large amount of data will be accumulated there that can be investigated.
We have described one of the possible uses for QuBeQu. System capabilities are broader than described in this article: connectors to external systems and databases, calculations, versioning, dashboards and graphics.
The task of collecting data from departments is relevant if we do not have a single accounting system from which we can always get information. For medium and large businesses, these can be periodic reports sent to the parent company, and for small businesses, for example, daily time-sheets or project reports.
As a rule, this process is organized as follows.
There is a manager who is interested in obtaining a summary of the divisions. He sets the task for his nearest subordinate (let's call him “analyst”) about receiving this report.
The obvious solution for the analyst is to create an Excel template, which he sends out to departments. In turn, there are employees in the units who possess this information. They fill out the templates and send the files back to the analytics by mail. Half of them are wrong and send the corrected file the next day.
As a result, the analyst spends two days consolidating all these files into one and preparing a summary report. The manager, after reviewing the summary report, understands that there is not enough data in it, and asks to add another column that the analyst has not provided. And the whole chain is repeated from the beginning, “v2.xls templates” are sent, reporting staff fill them in and send them back. As a result, the analyst has two data sets, and only he can understand which of them are relevant.
')
And now the manager is starting to like this report and he wants to receive it every month. After some time, he wants to watch it in dynamics and by department, which means that our analyst will have to process all the accumulated files for previous periods, including sort out their versions, merge into a new summary report, etc. etc. So we got a large block of useful data that no one can use.
This is a typical Excel Hell situation in an organization.
Consider the main problems in this process.
- Reporting enter data with errors.
In the Excel cell, by default, you can enter anything. The analyst gets a set of files with different directories, time and number formats, etc. In extreme cases, the reporting ones manage to glue the cells, add new columns, or send a completely different file altogether.
- Different versions of data.
Errors and changes in the initial requirements lead to the fact that the analyst and the reporting one accumulates several variants of the same reports and data and no one can understand where the latter is.
- The analyst constantly spends time on the same actions.
A typical operation to reduce data from files received from departments turns into the main work of the analyst, and at the output we have only a rigidly fixed report with aggregated values. And the initial information, for verification of which the analyst has spent a lot of time, is lost.
- No access to historical data.
The analyst spent an enormous amount of time on the data and data processing, made a summary report, probably even put it in the general storage, but how to get data from there? How to analyze the dynamics of development? It is necessary again to reduce and process data only from the summary reports for different periods.
- Change the structure of the report.
If the manager wants to look at the report in a different context or add any data that was not there before, or simply replace the type of chart with another one - what to do with all the old reports? Rebuild or leave in "obsolete" form?
- Efficiency.
A certain amount of time is spent on data collection and data reduction, for which these data have already become obsolete.
Each of the voiced problems, of course, has a solution.
Errors when filling? - You can limit the available values in the cells.
Different versions of the data? - get a spreadsheet in Google Spreadsheet or put Sharepoint.
Typical operations? - write a macro in Excel.
Historical data? - make Excel spreadsheet or develop your database.
Changing the structure? - to train SQL analytics, if at the previous stage DB was made.
Efficiency? - Regulate the process and pay premiums for meeting deadlines.
However, all these decisions require a systematic approach, putting in order all the processes and data sources, often also external consulting. You can also implement a comprehensive solution for a year and a half, automating all processes, thanks to which, theoretically, there will be no need to assemble such a report.
We think that there is a solution that does not require large expenditures on the implementation and restructuring of your business processes, but facilitates access to your information and work with it.
As we see the proper organization of such a process.
There is a set of conditions that must be met in this process.
- Building a template for data collection should not take a lot of time.
The analyst does not want to spend a lot of time thinking through the structure, setting restrictions on input, prohibiting editing a file, etc., because in the beginning he is not yet aware of how important this information is and that he will need to process it in the future.
- The manager must be able to change requirements.
Appetite comes with eating, and before receiving the first version of the report, it is difficult to understand what data we actually need. It means that the structure of the collected data and the structure of the report should be changed without the need to re-collect the information already entered.
- Reporting employees should simply pass in data.
So it is difficult to get the necessary report from them on time, and unnecessary problems in the organization of the process greatly influence discipline and efficiency.
- Not only the summary report has value, but also the source data.
Probably, in the future, we will want to look at the data in another way or calculate new indicators based on them.
- Access to the data must have all employees of the organization.
All employees need to know where to get the data and how to do it.
Now we will try, under these conditions, to get rid of the problems described above:
- Reporting enter data with errors.
We need a tool to quickly set up a data entry template with basic input restrictions — for numeric, textual, and reference data. At the same time, often reporting employees are not always able to use an external system, which means you need to give them the opportunity to use familiar Excel, and import data from there.
- Different versions of data.
All entered data must be versioned and have a single working version. It should always be clear who entered the value and when.
- Efficiency.
Values entered should immediately go to the shared storage.
- A waste of time for typical actions.
Summary reports should be generated automatically, not require separate formation procedures.
- The problem with the change of structure.
Generation of a consolidated report should not depend on the structure of input forms; previously entered data should not be lost when adding or changing columns and rows in forms and reports.
- Access to historical data.
The entered data should not be stored in forms and files - they should immediately fit into a structure that is convenient for work and selection.
We tried to implement all this in our system - QuBeQu (Kubeku). The basic unit of information is not a file, but an indicator with a set of analytical features. In QuBeQu, there is a form and report designer, where the user can quickly create a form of a specific structure consisting of a set of indicators with the specified attributes. When filling out the form, the data will be stored in a single repository, as the value of the indicator for the specified values of signs.
Accordingly, in the summary report, the values of this indicator will be automatically delivered (or calculated by the formula). For ease of filling out forms, we support import from Excel, copy-paste via the clipboard and keyboard navigation on the table. All data is fully versioned. Even if we delete the value in the cell, we can show what number was there, who entered it and who deleted it. In addition, to ensure the traceability of information, all calculated and aggregated values can be disclosed to the original data - you do not need to run through Excel cells and understand what a particular formula means. Formulas are not written in terms of the position of the cells in the table, but in terms of indicators and their signs, i.e. in QuBeQu “Revenue” = ”Revenue” - ”Expense”, not “A1 = B1-C1”.
You will surely say that the support of such a system is costly, because it does not happen that “everything works by itself”. But try to compare how much time an analyst would spend on mixing information from files with the time he would spend on the system. Even if these are values of the same order, we get a fundamentally different result.
All the data that we received from the reporting staff are structured, they can be quickly and easily used, they will not be lost. There is a single place to store information, and if there are a lot of analysts, managers, and reporting employees, a large amount of data will be accumulated there that can be investigated.
Total
We have described one of the possible uses for QuBeQu. System capabilities are broader than described in this article: connectors to external systems and databases, calculations, versioning, dashboards and graphics.
Source: https://habr.com/ru/post/289214/
All Articles