Software project management: processes, tools, techniques
There are different ideas about how creative work is done. For many people, a creator is a person (a poet, an artist, an inventor), who creates his creation at the time of illumination. To control the illumination? Oh no! It's impossible!
Nevertheless, the task of managing creativity at all times was relevant. Investors, managers, the state would like to have predictability about when the developed creative product will be released (be it a book, a plane, a computer program, or a movie).
Creative work can be done both individually (by a single creator — a scientist, artist, composer, or poet) or collectively (when groups of people of different specialties work to create a work). In this article, I would like to focus on the management of creative teams on the example of a distributed team of programmers, artists and designers from three countries, which produces an application sold all over the world. More than 10 million copies are sold every year. Annual revenue is $ 1 billion.
')
Suppose we wanted to open a restaurant. By what criteria will the client evaluate it? Of course, this is a kitchen, design and service. Usually, the greatest number of “glitches” occurs during the maintenance process, i.e. where the human factor is great. A pretty young waitress seems to attract customers. But her mood deteriorated, and instead of a friendly attitude, she begins to be rude. As a result, instead of attracting, there is a daring of customers. In the software development industry, this is simply unacceptable. It is necessary that specialists of different specialties interact with each other, and barriers in communications and all sorts of subjective things would be reduced to zero. Therefore, when working in a large international team, informal connections between people are replaced by formalized business processes, and instead of subjective assessments (good, cool, cool), metrics and quality indicators are used.
In large projects it is more profitable to buy the right specialist in the market, even if his salary seems excessive. When shooting a movie, the producer does not teach his screenwriter to write dialogues if he does not know how to do this, but simply buys the screenwriter to write dialogues on the market. Similarly, when developing applications. If there is a misunderstanding between teams from different countries, then one team is sent on a long trip. With billions in revenue, travel costs do not matter: the main thing is to release the product on time.
The process of managing a real project is always based on monitoring a group of parameters. It is only in school that they are taught to think of a function of one variable. Unfortunately, some managers are adopting school habits and trying to find a universal remedy for management problems - a sort of pill for all illnesses.
Example. In one company engaged in the development of mobile games, it was decided to write down the task on the card and place this card on the board. The board was lined with several vertical stripes. Each bar corresponds to a specific task state. New tasks were placed in the far left lane. Then, as they were completed, they gradually moved to the right. Management considered the main criterion for success to be the movement of the card on the board from left to right. One of the drawbacks of this approach is the lack of consideration for the fact that work on a task can be suspended for a number of reasons, and the performer can temporarily switch to another task. Another drawback is the number of tasks that are being worked on. In our project, 200 tasks had to be completed within the first month. It is clear that it was physically impossible to place such a number of cards on the board.
I will give a list of parameters that the project manager should control:
1. Timing.
2. Volume (number of useful functions).
3. The amount of work.
4. Utility (value to the consumer).
5. Technical and technological complexity.
6. External quality (from the point of view of the Consumer).
7. Internal quality (from the point of view of a specialist, engineer, designer).
8. Risks.
9. The psychological state of the team.
To control the parameters, processes are used, each of which is reduced to a specific set of tools and procedures for their application. Here are some of the processes that will be discussed below:
1. Task management.
2. Time management.
3. Quality management.
4. Risk management.
Assessment of the amount of work and distribution of tasks among employees.
1. Evaluate and record the amount of work.
Note. Employees should not invent activities for themselves, but be engaged in tasks from a pre-approved list.
Example. At one job I had a boss who answered the question “By what time do I need to complete this task?” Always gave the same answer: “Yesterday”. Later, when I became the head, I became convinced that a mirror situation was taking place with the programmers. You ask someone: “When will you finish this work?” - and you will get the answer: “Tomorrow by lunchtime. In the worst case, in the evening. " But a day passes, another, but the task is still not done. In order to as little as possible get into such situations and need a tool that prompts regularly the remaining amount of work.
2. Distribute tasks among employees. Ensure that each employee has a task, and none of them is idle.
Note: According to the Minister of Economic Development of Russia (21.05.2012 - 24.06.2013) Andrei Belousov, labor productivity in our country is 2-3 times lower than in developed countries, depending on the calculation method ( http://www.forbes.ru / kompanii / 245905-v-kakikh-otraslyakh-rabotayut-samye-neeffektivnye-rossiiskie-kompanii ).
Example. If you have ever observed how a mending of an accident on a heating main occurs, then you probably noticed that one worker was digging a hole, and around him 10 people were standing and looking at how it works.
You should also make sure that employees do not neglect some tasks to the detriment of others.
Example. In one of the St. Petersburg hypermarkets, plumber salesmen prefer to be close to Italian toilet bowls and whirlpools, because the premium for selling expensive plumbing equipment is higher. As a result, if the Buyer wants to purchase a clutch or crimp, he has no one to consult with. That's how sellers perform some tasks and ignore others. It turns out that employees set themselves or choose tasks that are “tastier”.
3. Find dependencies between different tasks.
Note (Vasilina Abu-Navas, Business Consultant, Practitioner Association): The task must necessarily be coordinated with the tasks of other employees, the entire project or part of it. Because, continuing the example of the worker, it may turn out that the worker dug a hole, received money, all 10 “chiefs” reported, and the next day an order came to dig the hole urgently, for example, the president would follow this road. This was known for a long time, just “forgot” to warn. And those who “dug”, as usual, did not specify the parameters of their task ... Or the worker dug a hole, but it was necessary to dig a little wider or a little deeper ... Ie the task may be relevant, but, at the same time, not agreed or not accurate.
4. Determine which tasks are blocked for one reason or another.
Example. By the standards of the newspaper Kommersant, at one time the materials of journalists, drawings of artists and photographs of photojournalists needed to be submitted by 6 o'clock in the evening. There is also a special person in the editorial office - the rewriter, whose task is to bring all the texts under one style.
The task control system can be presented as a spreadsheet.
Table 1. Task List for Mobile GPS Navigation
The title describes in brief the essence of the changes. In the ideal case, it should contain a verifiable criterion by which one can judge whether the task was completed or not.
Examples:
The name of the task may include the name of the program area (subsystem) to which the task belongs. This helps, with a quick look at the task, to understand which specialist it should be assigned to.
Examples:
The subsystem can be specified not only in the name of the task, but also in a separate column. This will allow "to line up the statistics" and estimate the amount of work related to one or another part of the program.
If different subsystems of the program have different requirements for the qualifications, knowledge and experience of employees, then such statistics will allow you to assess the need for relevant specialists.
A pie chart is best suited for the visual presentation of statistics:
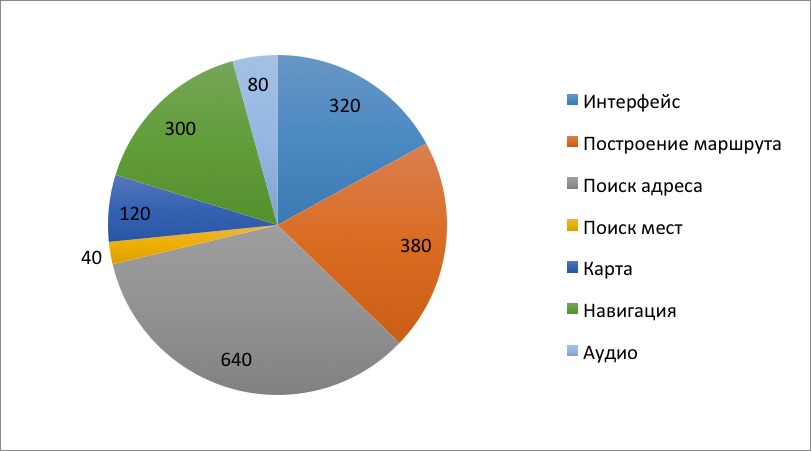
Figure 1. The scope of work on the mobile GPS navigation system
The task status allows you to determine which tasks have already been completed, which are being performed, and on which tasks the work has not yet begun. It is recommended to have a special status that signals that the task is blocked. If the employee establishes such a status, this means that the task is impossible for one reason or another.
Example. The task “Replace Icons” cannot be completed if the artist did not manage to draw these icons.
The residual complexity contains the actual assessment of the task - how much time is left until the task is completed. It is given by the performer at the end of each working day. Thus, the task is regularly revalued. This allows you to monitor the progress and take certain measures in time, if the team does not keep up with the deadline.
Initially, tasks are entered into the task control system at the project planning stage. The main difficulty lies in the fact that it is rather difficult to envisage all the tasks and accurately estimate the time it will take to complete them.
Work on the project is recommended to conduct iterative - two-week or weekly iterations. (Iteration helps to quickly make some finished piece of work and quickly get feedback.) At the beginning of each iteration, detailed planning is performed, which results in the selection of tasks for iteration. If necessary, the tasks are detailed, and their wording and evaluation are specified.
To manage tasks, you can use ready-made free or low-cost task control systems:
The complex, sophisticated and expensive project management system can be replaced by the symbiosis of Redmine and Excel.
Evaluation and control of the timing of the project.
Allows:
1. Estimate the current residual amount of work.
Example. The most common approach to managing deadlines is eye control: “Like, do you have time to complete the task by Friday?” In the brightest form, I encountered this approach in a Russian-German company. On my first working day, the German owner approached me and asked: “I have a birthday in three months. Will you have time to release the game for my birthday? ”
2. Determine the amount of lag from the plan.
3. Evaluate the progress of each employee and the entire team.
Note. In this case there will be a family of diagrams.
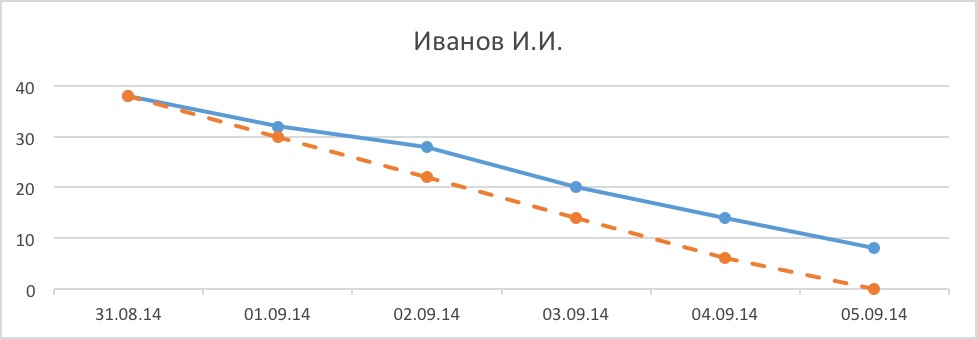
Figure 2. Employee Progress (Real and Predictable)
To create a curve, an auxiliary table is built, in which the first column lists the names of the employees, and the remaining columns contain the residual amount of work of the employee in hours on a specific date.
Instead of one digit, two are indicated - how much time is left real and how much should have remained according to plan.
Table 2. Employee Progress
Note (Anton Yakovlev, programmer): The approach described is obviously convenient when using Excel. With other systems, the approach may be different - Hansoft can generate such charts on its own.
The diagram represents two curves. One of them (drawn by a dotted line) shows the planned reduction in the volume of work, i.e. the way it should be. The second curve (drawn by a solid line) represents a real change in the amount of work. Each point on these curves is a planned or real amount of work that remained at the end of the day.
Curves are built for each employee individually, and for the whole team.
At the end of each working day, the data — the amount of work remaining in hours — is entered in a table. The data are taken from the column “Residual complexity” of the task table.
The reasons for the increase in the timing of tasks are analyzed and subsequently entered into a special knowledge base of the company.
Ensuring the quality of the product.
Example. In 2013, the number of divorces in Russia was 54.5% of the number of registered marriages ( http://womanadvice.ru/statistika-razvodov-v-rossii ). Such a number of "marriages" in the software development industry is simply unacceptable. Despite the fact that the state is an interested party, in that the number of divorces decreases, the reasons for such sad statistics are not collected and analyzed by the state. But when developing software this is done.
Large corporations are planning a quality product prior to development. They not only predict the number of defects that will be found in the process of working on a project, but also the number of defects that will never be corrected.
Example. In one of the projects 30 thousand (!) Defects were found. Of these, 15% has not been fixed. Despite the fact that these are uncritical or very rare errors, nevertheless, we can say that the application was released with 4,500 errors.
If the application is released on a regular basis (for example, every year - a new version), then the forecast is reasonable to base on historical data. It can be presented in the form of a table, which provides statistics on previous versions and forecast indicators for the new version.
Table 3. Defects Forecast for GPS Mobile Navigation System
The "Region" column lists the subsystems of the program. They can be obtained by logical division for various reasons. Sometimes the program is divided into parts from the user's point of view (as in the table below). In other cases, technical criteria are used.
The middle column contains real historical data - the number of defects that was found in various parts of the program in a previous version of the program.
The last column indicates forecast data - how many defects will be found in one or another part of the program when developing its next version.
When starting a project, the quality control department creates a forecast for bugs. It takes into account historical data, the projected amount of work, the complexity of the requirements for the new version of the application, as well as the experience of the team itself.
The forecast is given by subsystem. To increase accuracy, two different models are used. The first model provides for splitting the program into subsystems based on various technical criteria.
For example:
The second model provides for the division of the program into subsystems by user functions.
For example:
Different forecast models complement and test each other.
The forecast of the number of defects is not a simple formality, but a serious tool for planning work. It helps to determine the number of quality engineers that are going to attract to the project. The forecast also allows you to calculate the time required to stabilize the program.
The prediction of the number of defects is a fairly conservative tool. Management revises it very reluctantly, because any revision of it to the downside can lead to the fact that hardly reproducible errors will not be sought. It is assumed that in the absence of a proper standard, quality engineers will simply relax and do their job worse than they could.
Example. In one of the projects, the actual number of defects was lower than the predicted value. According to statistics, quality engineers could not cope with their work, because found fewer errors than was expected from the forecast. Despite the fact that the absence of a significant number of defects was objectively due to the small number of requirements implemented, managers feared that there were hidden bugs in the program and therefore did not revise the forecast for a long time, but preferred to arrange processing at weekends.
It is a detailed forecast of the number of defects with a breakdown by subsystems and time. As a rule, week is selected per unit of time.
Note: The defect search plan sets standards for all quality engineers. It is based on a previously made forecast by distributing the total number of defects by project weeks. A team of quality engineers receives weekly assignments - how many defects in the program should it find during a given week. Weekly assignments can be further detailed - by day and staff. As a result, tasks for each engineer for each day will be received.
The defect search plan is a table in which the desired performance indicators of the entire team of quality engineers for each week of the project are entered.
Table 4. Weekly defect detection plan for a mobile GPS navigation system
Each cell opposite the name of the subsystem is indicated
the number of defects that will be found in it within a certain week.
Week end dates are specified in column headers.
On the basis of the plan, a schedule for finding defects, which is an S-shaped curve, is plotted.
The total number of defects found “in percent” is plotted along the vertical axis, and time along the horizontal axis.
The graph also contains key dates for the project: the alpha version, the beta version and the final version.
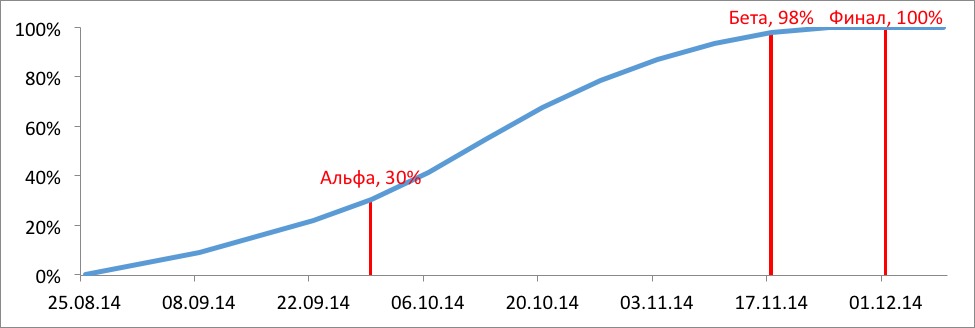
Figure 3. A graphical representation of the defect search plan for the entire period of work on the project.
Visually, the curve can be divided into three stages.
The first stage begins with the start of the project and ends with the release of the alpha version. At this time, the curve does not grow so intensely, because prior to the alpha version, priority is given to the design of the program, and not to the search for defects. Not all requirements have been implemented yet, and what has been done may not be fully implemented.
At the second stage, between alpha and beta versions, the curve grows very intensively. This is because at this point almost all the planned requirements have already been implemented, and additional quality engineers are involved in testing the program, and programmers are switching from the implementation of requirements to the correction of defects.
Shortly before the beta, there are not so many defects. The most obvious of them have already been found and corrected. Begin to manifest unobvious errors that are more difficult to find and correct. The curve slows down its growth. And after some time, the non-obvious errors also turn out to be corrected, and the curve stops growing. At this point, the beta version is released. And then - if new errors are not detected - the final version is released.
By the time of the alpha version, the testing department should have found 30% of all defects. By beta, 98% of all defects must be found.
To envisage risks that may complicate or disrupt the project, develop an action plan in case of risk triggering to neutralize its consequences.
Note: In systems engineering, there is a methodology for “analysis of types and consequences of failures” (eng. - Failure Modes and Effects Analysis, https://ru.wikipedia.org/wiki/FMEA ). According to the US Department of Defense standard, this procedure analyzes potential system errors, determines the results of their influence both on the system as a whole and on various subsystems, and classifies errors regarding their criticality.
Risk management is similar to the analysis of types and consequences of failures: risks are identified, their negative impact on the project is evaluated, solutions are found to neutralize the negative consequences.
1. Describe the risks identified.
Note: One of the typical problems in a number of companies (which are not even distributed, but the employees are in the same office) - people do not share their experience. There is no exchange of information about typical errors, risks, decisions. It is necessary to pull it all into the world and make it accessible to the whole company.
Note (Vasilina Abu-Navas, business consultant, Practitioner association): Even more: you need to describe the solution right away (if possible, you should find the ideal solution). Those. To reveal the risk is not enough - you must immediately think about how to prevent it. Otherwise, the risks remain “rakes”.
Example (Vasilina Abu-Navas, business consultant, Practitioner Association): Our Client was faced with the task of unfreezing working capital in the amount of 25 million rubles for 1 month. It seemed that we took into account all the risks, except taxes, because the CFO was on vacation, and knowing that this task would be solved, he did not say anything . We made an excellent plan for defrosting funds and implemented it. As a result, flew on income tax. If this risk were taken into account, then it would be possible to spend the proceeds to purchase real estate, and thus avoid paying the tax.
2. Assess the importance of each risk and the likelihood of it triggering.
Example. The risk that a project closes due to a meteorite entering the company’s office is of high importance. Nevertheless, the probability of its operation is so low that it safely allows you to ignore this risk.
Example. One company developing a GPS navigator decided to change the map provider. The reason for the change is simple - the license cost is 2 times lower, and the format of the card description is the same. However, the price of switching to a new supplier’s cards cost the company 2 to 3 people per year. That is how much effort was spent on solving technical problems.
3. Suggest an action plan in case the risk works.
Example. When creating one game for little girls, there was a serious risk of not meeting the deadlines. There were several reasons for this risk: a new team, an unfamiliar platform for which development was conducted, the absence of a streamlined technological infrastructure. To reduce the risk, it was decided to organize the game in the form of a sequence of mini-games. Each such game was fairly simple, not too intense graphics and other characters. In addition, the player was deprived of his freedom of movement, i.e. could only move in predetermined directions. This simplified the development process so much that one mini-game in the final quality was created for 5 man-days (meaning the work of an engineer without taking into account the artist’s work).
4. Distribute risks among those responsible for their elimination.
All identified risks are entered into a special table, as in the example below.
Table 5. Risk Table for Mobile GPS Navigation
Each risk is written by the formula:
If not <something is done> before <certain date>, then something negative will happen>.
Each risk should be evaluated in terms of its importance, i.e.negative consequences for the project when it is triggered. Usually limited to a scale of three ratings: low, medium and high.
You should also assess the likelihood of risk triggering To assess, too, can be limited to three values: low, medium and high.
The risk weight is calculated automatically based on its importance and probability. To do this, the estimated values are converted to numerical values as follows: the value “low” becomes equal to 1, “average” - 2, and “high” - 3. Weight is calculated as the product of two estimates. For example, if the importance of risk is high and the probability of its triggering is also high, then the risk gets a weight equal to 9.
With limited resources, first of all, attention should be paid to the risks with the greatest weight.
When describing the risk, you should also add an action plan in case of its triggering or to reduce the likelihood of its triggering and / or its importance. For each risk assigned responsible, who is responsible for its neutralization.
The author thanks Vasilina Abu-Navas (Practitioner Association), I.L. Vikentiev (System "TRIZ-CHANCE"), Eduard Galiaskarov and Anton Yakovlev for assistance in the preparation of the article.
Nevertheless, the task of managing creativity at all times was relevant. Investors, managers, the state would like to have predictability about when the developed creative product will be released (be it a book, a plane, a computer program, or a movie).
Creative work can be done both individually (by a single creator — a scientist, artist, composer, or poet) or collectively (when groups of people of different specialties work to create a work). In this article, I would like to focus on the management of creative teams on the example of a distributed team of programmers, artists and designers from three countries, which produces an application sold all over the world. More than 10 million copies are sold every year. Annual revenue is $ 1 billion.
')
Suppose we wanted to open a restaurant. By what criteria will the client evaluate it? Of course, this is a kitchen, design and service. Usually, the greatest number of “glitches” occurs during the maintenance process, i.e. where the human factor is great. A pretty young waitress seems to attract customers. But her mood deteriorated, and instead of a friendly attitude, she begins to be rude. As a result, instead of attracting, there is a daring of customers. In the software development industry, this is simply unacceptable. It is necessary that specialists of different specialties interact with each other, and barriers in communications and all sorts of subjective things would be reduced to zero. Therefore, when working in a large international team, informal connections between people are replaced by formalized business processes, and instead of subjective assessments (good, cool, cool), metrics and quality indicators are used.
In large projects it is more profitable to buy the right specialist in the market, even if his salary seems excessive. When shooting a movie, the producer does not teach his screenwriter to write dialogues if he does not know how to do this, but simply buys the screenwriter to write dialogues on the market. Similarly, when developing applications. If there is a misunderstanding between teams from different countries, then one team is sent on a long trip. With billions in revenue, travel costs do not matter: the main thing is to release the product on time.
Control options
The process of managing a real project is always based on monitoring a group of parameters. It is only in school that they are taught to think of a function of one variable. Unfortunately, some managers are adopting school habits and trying to find a universal remedy for management problems - a sort of pill for all illnesses.
Example. In one company engaged in the development of mobile games, it was decided to write down the task on the card and place this card on the board. The board was lined with several vertical stripes. Each bar corresponds to a specific task state. New tasks were placed in the far left lane. Then, as they were completed, they gradually moved to the right. Management considered the main criterion for success to be the movement of the card on the board from left to right. One of the drawbacks of this approach is the lack of consideration for the fact that work on a task can be suspended for a number of reasons, and the performer can temporarily switch to another task. Another drawback is the number of tasks that are being worked on. In our project, 200 tasks had to be completed within the first month. It is clear that it was physically impossible to place such a number of cards on the board.
I will give a list of parameters that the project manager should control:
1. Timing.
2. Volume (number of useful functions).
3. The amount of work.
4. Utility (value to the consumer).
5. Technical and technological complexity.
6. External quality (from the point of view of the Consumer).
7. Internal quality (from the point of view of a specialist, engineer, designer).
8. Risks.
9. The psychological state of the team.
Management processes
To control the parameters, processes are used, each of which is reduced to a specific set of tools and procedures for their application. Here are some of the processes that will be discussed below:
1. Task management.
2. Time management.
3. Quality management.
4. Risk management.
Task Management
Purpose
Assessment of the amount of work and distribution of tasks among employees.
Task control system
Goals
1. Evaluate and record the amount of work.
Note. Employees should not invent activities for themselves, but be engaged in tasks from a pre-approved list.
Example. At one job I had a boss who answered the question “By what time do I need to complete this task?” Always gave the same answer: “Yesterday”. Later, when I became the head, I became convinced that a mirror situation was taking place with the programmers. You ask someone: “When will you finish this work?” - and you will get the answer: “Tomorrow by lunchtime. In the worst case, in the evening. " But a day passes, another, but the task is still not done. In order to as little as possible get into such situations and need a tool that prompts regularly the remaining amount of work.
2. Distribute tasks among employees. Ensure that each employee has a task, and none of them is idle.
Note: According to the Minister of Economic Development of Russia (21.05.2012 - 24.06.2013) Andrei Belousov, labor productivity in our country is 2-3 times lower than in developed countries, depending on the calculation method ( http://www.forbes.ru / kompanii / 245905-v-kakikh-otraslyakh-rabotayut-samye-neeffektivnye-rossiiskie-kompanii ).
Example. If you have ever observed how a mending of an accident on a heating main occurs, then you probably noticed that one worker was digging a hole, and around him 10 people were standing and looking at how it works.
You should also make sure that employees do not neglect some tasks to the detriment of others.
Example. In one of the St. Petersburg hypermarkets, plumber salesmen prefer to be close to Italian toilet bowls and whirlpools, because the premium for selling expensive plumbing equipment is higher. As a result, if the Buyer wants to purchase a clutch or crimp, he has no one to consult with. That's how sellers perform some tasks and ignore others. It turns out that employees set themselves or choose tasks that are “tastier”.
3. Find dependencies between different tasks.
Note (Vasilina Abu-Navas, Business Consultant, Practitioner Association): The task must necessarily be coordinated with the tasks of other employees, the entire project or part of it. Because, continuing the example of the worker, it may turn out that the worker dug a hole, received money, all 10 “chiefs” reported, and the next day an order came to dig the hole urgently, for example, the president would follow this road. This was known for a long time, just “forgot” to warn. And those who “dug”, as usual, did not specify the parameters of their task ... Or the worker dug a hole, but it was necessary to dig a little wider or a little deeper ... Ie the task may be relevant, but, at the same time, not agreed or not accurate.
4. Determine which tasks are blocked for one reason or another.
Example. By the standards of the newspaper Kommersant, at one time the materials of journalists, drawings of artists and photographs of photojournalists needed to be submitted by 6 o'clock in the evening. There is also a special person in the editorial office - the rewriter, whose task is to bring all the texts under one style.
Description
The task control system can be presented as a spreadsheet.
Table 1. Task List for Mobile GPS Navigation
| Title | Status | Responsible | Region | Residual complexity (hours) |
| Add crosshair search screen | New | Ivanov I.I. | Address search | 24 |
| Add hairdressers to the database for the map of Russia | Performed | Petrov P.P. | Search for places | eight |
| Add new card styles | Completed | Sidorov S.S. | Map | 0 |
| Understand why the route is not built through the ring road in St. Petersburg | Blocked | Dmitriev D.D. | Building a route | 12 |
Options
The title describes in brief the essence of the changes. In the ideal case, it should contain a verifiable criterion by which one can judge whether the task was completed or not.
Examples:
- Add a search screen intersections. ( Note: The test criterion is a screen. It is either there or it is not.)
- Understand why the route is not built through the ring road in St. Petersburg. ( Note: The test criterion is building a route through the ring road.)
The name of the task may include the name of the program area (subsystem) to which the task belongs. This helps, with a quick look at the task, to understand which specialist it should be assigned to.
Examples:
- Database - Search for places - Add barbers to the database for Russia. ( Note: The task belongs to two areas at once: from a technical point of view - to the database, because it needs to be changed; from a user point of view - to search for places, because in this section of the navigation system you can check the change.)
- Interface - Maps - Add new styles of maps. ( Note: This task can also be attributed directly to two sections of the navigation system: the user interface, where you can choose the style of the maps, and the map visualization subsystem.)
The subsystem can be specified not only in the name of the task, but also in a separate column. This will allow "to line up the statistics" and estimate the amount of work related to one or another part of the program.
If different subsystems of the program have different requirements for the qualifications, knowledge and experience of employees, then such statistics will allow you to assess the need for relevant specialists.
A pie chart is best suited for the visual presentation of statistics:
Figure 1. The scope of work on the mobile GPS navigation system
The task status allows you to determine which tasks have already been completed, which are being performed, and on which tasks the work has not yet begun. It is recommended to have a special status that signals that the task is blocked. If the employee establishes such a status, this means that the task is impossible for one reason or another.
Example. The task “Replace Icons” cannot be completed if the artist did not manage to draw these icons.
The residual complexity contains the actual assessment of the task - how much time is left until the task is completed. It is given by the performer at the end of each working day. Thus, the task is regularly revalued. This allows you to monitor the progress and take certain measures in time, if the team does not keep up with the deadline.
Using
Initially, tasks are entered into the task control system at the project planning stage. The main difficulty lies in the fact that it is rather difficult to envisage all the tasks and accurately estimate the time it will take to complete them.
Work on the project is recommended to conduct iterative - two-week or weekly iterations. (Iteration helps to quickly make some finished piece of work and quickly get feedback.) At the beginning of each iteration, detailed planning is performed, which results in the selection of tasks for iteration. If necessary, the tasks are detailed, and their wording and evaluation are specified.
BY
To manage tasks, you can use ready-made free or low-cost task control systems:
- Excel spreadsheets or Google Docs
- Redmine - http://www.redmine.org
- Jira - https://www.atlassian.com/software/jira
- BugZilla - http://www.bugzilla.org
- DropTask - http://www.droptask.com
- Hansoft - http://www.hansoft.com
The complex, sophisticated and expensive project management system can be replaced by the symbiosis of Redmine and Excel.
Time management
Purpose
Evaluation and control of the timing of the project.
Task Chart
Goals
Allows:
1. Estimate the current residual amount of work.
Example. The most common approach to managing deadlines is eye control: “Like, do you have time to complete the task by Friday?” In the brightest form, I encountered this approach in a Russian-German company. On my first working day, the German owner approached me and asked: “I have a birthday in three months. Will you have time to release the game for my birthday? ”
2. Determine the amount of lag from the plan.
3. Evaluate the progress of each employee and the entire team.
Note. In this case there will be a family of diagrams.
Diagram
Figure 2. Employee Progress (Real and Predictable)
Description
To create a curve, an auxiliary table is built, in which the first column lists the names of the employees, and the remaining columns contain the residual amount of work of the employee in hours on a specific date.
Instead of one digit, two are indicated - how much time is left real and how much should have remained according to plan.
Table 2. Employee Progress
| FULL NAME. | 08/31/14 | 09/01/14 | 09/02/14 | 09/03/14 | 09/04/14 | 09/05/14 | |
| Ivanov I.I. | Realistically | 38 | 32 | 28 | 20 | 14 | eight |
| Plan | 38 | thirty | 22 | 14 | 6 | 0 | |
| Petrov P.P. | Realistically | 40 | 32 | 26 | 18 | eleven | 0 |
| Plan | 40 | 32 | 24 | sixteen | eight | 0 | |
Note (Anton Yakovlev, programmer): The approach described is obviously convenient when using Excel. With other systems, the approach may be different - Hansoft can generate such charts on its own.
Options
The diagram represents two curves. One of them (drawn by a dotted line) shows the planned reduction in the volume of work, i.e. the way it should be. The second curve (drawn by a solid line) represents a real change in the amount of work. Each point on these curves is a planned or real amount of work that remained at the end of the day.
Using
Curves are built for each employee individually, and for the whole team.
At the end of each working day, the data — the amount of work remaining in hours — is entered in a table. The data are taken from the column “Residual complexity” of the task table.
The reasons for the increase in the timing of tasks are analyzed and subsequently entered into a special knowledge base of the company.
Quality control
Purpose
Ensuring the quality of the product.
Example. In 2013, the number of divorces in Russia was 54.5% of the number of registered marriages ( http://womanadvice.ru/statistika-razvodov-v-rossii ). Such a number of "marriages" in the software development industry is simply unacceptable. Despite the fact that the state is an interested party, in that the number of divorces decreases, the reasons for such sad statistics are not collected and analyzed by the state. But when developing software this is done.
Large corporations are planning a quality product prior to development. They not only predict the number of defects that will be found in the process of working on a project, but also the number of defects that will never be corrected.
Example. In one of the projects 30 thousand (!) Defects were found. Of these, 15% has not been fixed. Despite the fact that these are uncritical or very rare errors, nevertheless, we can say that the application was released with 4,500 errors.
Defects Forecast
Goals
- Rate the complexity of the project.
- Assess the resources needed to refine the quality.
Description
If the application is released on a regular basis (for example, every year - a new version), then the forecast is reasonable to base on historical data. It can be presented in the form of a table, which provides statistics on previous versions and forecast indicators for the new version.
Table 3. Defects Forecast for GPS Mobile Navigation System
| Region | 2013 (reality) | 2014 (forecast) |
| User interface | 243 | 250 |
| Building a route | 113 | 100 |
| Address search | 53 | 50 |
| Search for places | 17 | 20 |
| Map | 194 | 200 |
| Navigation | 89 | 100 |
| Audio | 67 | 50 |
| Total | 776 | 770 |
Options
The "Region" column lists the subsystems of the program. They can be obtained by logical division for various reasons. Sometimes the program is divided into parts from the user's point of view (as in the table below). In other cases, technical criteria are used.
The middle column contains real historical data - the number of defects that was found in various parts of the program in a previous version of the program.
The last column indicates forecast data - how many defects will be found in one or another part of the program when developing its next version.
Using
When starting a project, the quality control department creates a forecast for bugs. It takes into account historical data, the projected amount of work, the complexity of the requirements for the new version of the application, as well as the experience of the team itself.
The forecast is given by subsystem. To increase accuracy, two different models are used. The first model provides for splitting the program into subsystems based on various technical criteria.
For example:
- User interface
- Database
- Audio
- Algorithms
The second model provides for the division of the program into subsystems by user functions.
For example:
- Drawing a map
- Building a route
- Navigation
- Address search
Different forecast models complement and test each other.
The forecast of the number of defects is not a simple formality, but a serious tool for planning work. It helps to determine the number of quality engineers that are going to attract to the project. The forecast also allows you to calculate the time required to stabilize the program.
The prediction of the number of defects is a fairly conservative tool. Management revises it very reluctantly, because any revision of it to the downside can lead to the fact that hardly reproducible errors will not be sought. It is assumed that in the absence of a proper standard, quality engineers will simply relax and do their job worse than they could.
Example. In one of the projects, the actual number of defects was lower than the predicted value. According to statistics, quality engineers could not cope with their work, because found fewer errors than was expected from the forecast. Despite the fact that the absence of a significant number of defects was objectively due to the small number of requirements implemented, managers feared that there were hidden bugs in the program and therefore did not revise the forecast for a long time, but preferred to arrange processing at weekends.
Defect search plan
It is a detailed forecast of the number of defects with a breakdown by subsystems and time. As a rule, week is selected per unit of time.
Goals
- Distribute the resources responsible for quality control in time.
- Get a mechanism to monitor the work of quality engineers.
Note: The defect search plan sets standards for all quality engineers. It is based on a previously made forecast by distributing the total number of defects by project weeks. A team of quality engineers receives weekly assignments - how many defects in the program should it find during a given week. Weekly assignments can be further detailed - by day and staff. As a result, tasks for each engineer for each day will be received.
Description
The defect search plan is a table in which the desired performance indicators of the entire team of quality engineers for each week of the project are entered.
Table 4. Weekly defect detection plan for a mobile GPS navigation system
| Region | 09/01/14 | 09/08/14 | 09/15/14 | 09/22/14 |
| User interface | five | five | ten | 12 |
| Building a route | 3 | 3 | five | 7 |
| Address search | five | five | five | eight |
| Search for places | 0 | one | 2 | 3 |
| Map | 3 | five | 7 | eight |
| Navigation | eight | ten | ten | 12 |
| Audio | 0 | one | 2 | 3 |
| Total | 24 | thirty | 41 | 53 |
Options
Each cell opposite the name of the subsystem is indicated
the number of defects that will be found in it within a certain week.
Week end dates are specified in column headers.
Diagram
On the basis of the plan, a schedule for finding defects, which is an S-shaped curve, is plotted.
The total number of defects found “in percent” is plotted along the vertical axis, and time along the horizontal axis.
The graph also contains key dates for the project: the alpha version, the beta version and the final version.
Figure 3. A graphical representation of the defect search plan for the entire period of work on the project.
Using
Visually, the curve can be divided into three stages.
The first stage begins with the start of the project and ends with the release of the alpha version. At this time, the curve does not grow so intensely, because prior to the alpha version, priority is given to the design of the program, and not to the search for defects. Not all requirements have been implemented yet, and what has been done may not be fully implemented.
At the second stage, between alpha and beta versions, the curve grows very intensively. This is because at this point almost all the planned requirements have already been implemented, and additional quality engineers are involved in testing the program, and programmers are switching from the implementation of requirements to the correction of defects.
Shortly before the beta, there are not so many defects. The most obvious of them have already been found and corrected. Begin to manifest unobvious errors that are more difficult to find and correct. The curve slows down its growth. And after some time, the non-obvious errors also turn out to be corrected, and the curve stops growing. At this point, the beta version is released. And then - if new errors are not detected - the final version is released.
By the time of the alpha version, the testing department should have found 30% of all defects. By beta, 98% of all defects must be found.
Management of risks
Purpose
To envisage risks that may complicate or disrupt the project, develop an action plan in case of risk triggering to neutralize its consequences.
Note: In systems engineering, there is a methodology for “analysis of types and consequences of failures” (eng. - Failure Modes and Effects Analysis, https://ru.wikipedia.org/wiki/FMEA ). According to the US Department of Defense standard, this procedure analyzes potential system errors, determines the results of their influence both on the system as a whole and on various subsystems, and classifies errors regarding their criticality.
Risk management is similar to the analysis of types and consequences of failures: risks are identified, their negative impact on the project is evaluated, solutions are found to neutralize the negative consequences.
Risk register
Goals
1. Describe the risks identified.
Note: One of the typical problems in a number of companies (which are not even distributed, but the employees are in the same office) - people do not share their experience. There is no exchange of information about typical errors, risks, decisions. It is necessary to pull it all into the world and make it accessible to the whole company.
Note (Vasilina Abu-Navas, business consultant, Practitioner association): Even more: you need to describe the solution right away (if possible, you should find the ideal solution). Those. To reveal the risk is not enough - you must immediately think about how to prevent it. Otherwise, the risks remain “rakes”.
Example (Vasilina Abu-Navas, business consultant, Practitioner Association): Our Client was faced with the task of unfreezing working capital in the amount of 25 million rubles for 1 month. It seemed that we took into account all the risks, except taxes, because the CFO was on vacation, and knowing that this task would be solved, he did not say anything . We made an excellent plan for defrosting funds and implemented it. As a result, flew on income tax. If this risk were taken into account, then it would be possible to spend the proceeds to purchase real estate, and thus avoid paying the tax.
2. Assess the importance of each risk and the likelihood of it triggering.
Example. The risk that a project closes due to a meteorite entering the company’s office is of high importance. Nevertheless, the probability of its operation is so low that it safely allows you to ignore this risk.
Example. One company developing a GPS navigator decided to change the map provider. The reason for the change is simple - the license cost is 2 times lower, and the format of the card description is the same. However, the price of switching to a new supplier’s cards cost the company 2 to 3 people per year. That is how much effort was spent on solving technical problems.
3. Suggest an action plan in case the risk works.
Example. When creating one game for little girls, there was a serious risk of not meeting the deadlines. There were several reasons for this risk: a new team, an unfamiliar platform for which development was conducted, the absence of a streamlined technological infrastructure. To reduce the risk, it was decided to organize the game in the form of a sequence of mini-games. Each such game was fairly simple, not too intense graphics and other characters. In addition, the player was deprived of his freedom of movement, i.e. could only move in predetermined directions. This simplified the development process so much that one mini-game in the final quality was created for 5 man-days (meaning the work of an engineer without taking into account the artist’s work).
4. Distribute risks among those responsible for their elimination.
Description
All identified risks are entered into a special table, as in the example below.
Table 5. Risk Table for Mobile GPS Navigation
| Risk | Importance | Probability | Weight | What to do? | Responsible | condition |
| If programmers do not receive new maps from the supplier before October 15, they will not be included in the release. | Average | Low | 2 | Contact the supplier by phone and send an email reminder | Sergeev A.D. | Need to remind a couple more times |
| If the marketing department does not provide customer feedback before September 1st, the team will not be able to take them into account in the next release. | High | High | 9 | Request a marketing department | Vladimirov K.P. | Received, are on the server in the folder 'Reviews' |
Options
Each risk is written by the formula:
If not <something is done> before <certain date>, then something negative will happen>.
Each risk should be evaluated in terms of its importance, i.e.negative consequences for the project when it is triggered. Usually limited to a scale of three ratings: low, medium and high.
You should also assess the likelihood of risk triggering To assess, too, can be limited to three values: low, medium and high.
The risk weight is calculated automatically based on its importance and probability. To do this, the estimated values are converted to numerical values as follows: the value “low” becomes equal to 1, “average” - 2, and “high” - 3. Weight is calculated as the product of two estimates. For example, if the importance of risk is high and the probability of its triggering is also high, then the risk gets a weight equal to 9.
Using
With limited resources, first of all, attention should be paid to the risks with the greatest weight.
When describing the risk, you should also add an action plan in case of its triggering or to reduce the likelihood of its triggering and / or its importance. For each risk assigned responsible, who is responsible for its neutralization.
Conclusion
- Software development projects are both individual and collective.
- Collective software projects require the coordination of the efforts of many people. Often these people have different specialties, are in different countries and on different continents and speak different languages.
- Large corporations have experience in managing large enough (100 - 200 people), international and distributed creative teams. This experience can be rethought and used.
- The process of managing a real project is based on the control of a whole group of parameters. It is only in school that they learn to think of a function of one variable.
- To control management parameters, it is recommended to use management processes, among which are: task management, time management, quality management, risk management, etc.
- Each of the management processes is reduced to one or more tools and methods of their application. Among the tools there are: a task control system, a task combustion diagram, a prediction of the number of defects, a plan for finding defects, a register of risks.
The author thanks Vasilina Abu-Navas (Practitioner Association), I.L. Vikentiev (System "TRIZ-CHANCE"), Eduard Galiaskarov and Anton Yakovlev for assistance in the preparation of the article.
Source: https://habr.com/ru/post/286896/
All Articles