What if your card looks like this?
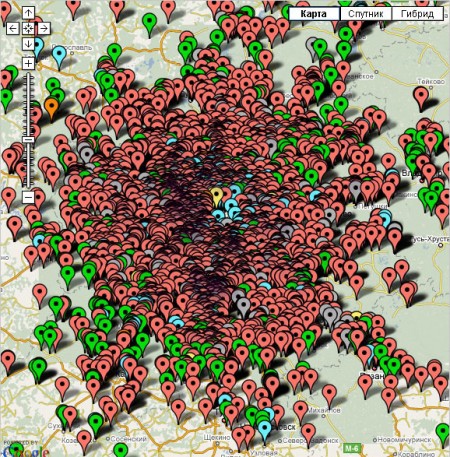
Greetings, my name is Vlad. I am a leading developer of the project Ezem.ru. In the picture above you can see all the sites posted by our users in the Moscow region (8000+ sites). I want to tell you how we solved this problem and what pitfalls were in our way.
The main problem is that when we have more than 500 objects on the map - the average office computer begins to slow down terribly and it becomes difficult to use the card. In addition to the main problem, if you display all the plots, it is impossible to click on any particular marker, and in Moscow there was just some kind of black hole :) We climbed up to watch how other Google Maps API users solved this problem. GPS-Club: POI: Speed Cameras , Where is this house , MirTesen , Pushkino.org (the first thing that came to mind), either did not solve the problem with “brakes”, or simply limit the number of objects on the screen. And the problem here is probably not in google maps api, but in the DOM model itself, which is very slow in the Internet killer (IE 6).
')
Crutches 1. Use standard tools.
Glance fell on GMarkerManager . The principle of its operation is simple. To load in DOM only those markers that we now see on the screen, thereby reducing the number of DOM objects and facilitating the already difficult life of the browser ...
But looking in more detail at the documentation was a bit confused:
This class is deprecated; developers are recommended to use the open source MarkerManager instead.
Crutches 2. Use third-party tools.
After wandering around the Internet and asking passers-by, I came across a wonderful library with a no less remarkable name " MarkerManager ". The principle of its operation is the same as that of GMarkerManager, but with a slight difference. There are functions to delete all markers on the screen and delete a specific marker. This crutch worked correctly, but only until the number of markers exceeded 3,000. Another stone was that the markers were loaded when you first entered the page and processed them (200kb XML), on the client side, It took quite a lot of time. In general, it was decided to juggle AJAX with requests and pull out ONLY the markers of the visible area and ONLY of the zoom on which we are now. This option, with minor amendments, works on our website.

Crutches 3. Grouping markers.
As I said above, the more markers we have concentrated at one point, the harder it is to use the map. Indeed, to get on any particular marker, sometimes, it became simply impossible. It was decided to reduce the number of markers on the screen and implement the grouping of markers on the server side. The solution is quite simple, but not too correct. For each map zoom, the correct sizes of the rectangles (see the picture on the right) were selected and the markers that fall into this area were marked as children and only 1 of them were shown on this zoom. And so for each ungrouped marker and for each zoom. The advantages of this approach are that it is now possible to use the card. But in this approach there are major drawbacks: the calculation took about 12 minutes and was done ONCE per day. We overcame the slowness of the map, but we had another problem: since counting markers was done once a day, we could not incorporate grouping into our filters. And the browser could easily be put on my knees by choosing the type: "Individual housing construction (only red markers)" and the size of the plot from 0 to 50 hectare.
Crutch 4. Dynamic grouping of markers.
The idea that the browser can be put on our knees with 2 mouse clicks kept us awake and we decided to make a more advanced version of the group:
Option 1. Static squares
The idea gave Oleg Volchkov . Calculate in advance ALL possible card squares on ALL possible zooms. Immediately make a reservation that the coefficient of the rectangle for each of the zooms is different and we considered only Russia. We got more than 23 000 000 records and the base “recovered” by 200 MB. The advantage of this approach is that the grouping of markers was carried out more accurately than in the second version. The disadvantages are that the data had to be calculated (it took about one night on the development wheelbarrow) and the already calculated data needed to be allocated to a separate database, and this would have pulled some refactoring.
Option 2. Grouping by visible area only.
The author of this idea is Sergey Kolchin . Every time when we move the map, we transfer the coordinates of the visible area to the server - so why not just divide this rectangle and group markers in real time? The downside in this case is that when shifted by small distances the markers will move slightly. We considered this to be an uncritical problem because, firstly, the markers do not move so much, and secondly: the user usually immediately approaches the area of interest, and does not travel around the map. This option, due to the fact that it is simpler and works faster than the 1st and is used on our site to this day.
A bit of conceptual code:
Request example: http://ezem.ru/gmap/getmarkers/?appoi ..
Markermanager
 / * Copyright (c) 2007 Google Inc.
  *
  * Licensed under the Apache License, Version 2.0 (the "License");
  * you may not use this file.
  * You can get a copy of the License at
  *
  * http://www.apache.org/licenses/LICENSE-2.0
  *
  *
  * distributed under an "AS IS" BASIS,
  * WITHOUT WARRANTIES OR CONDITIONS OF ANY KIND, either express or implied.
  * See the license for the specific language permissions and
  * limitations under the License.
  *
  * Version: 1.0
  * Author: Doug Ricket, others
  *
  * Marker manager
  Add to viewport changes.
  *
  *
  Algorithm:
  * When the user moves the grid cells
  * All the markers in those
  * cells.
  * (If the users scrolls the viewport beyond the markers that are loaded,
  * no markers will be visible until the EVENT_moveend triggers an update.)
  *
  * In practical consequences, this allows 10,000 markers to be distributed over
  * a large area, view as 100-200
  * visible markers,
  * rather than poor performance corresponding to 10,000 markers.
  *
  * Note that some code is optimized for speed over space,
  * with the goal of accommodating thousands of markers.
  *
  * /

 The file is big and I didn’t upload it.  You can watch it by the link http://ezem.ru/js/gmap/markermanager.js
Function handler
     public function getmarkersAction ()
     {
         $ params = array ();
         foreach (array ('zoom', 'area_min', 'area_max', 'units') as $ k) {
             $ params [$ k] = (int) $ this -> _ getParam ($ k, 0);
         }
         foreach (array ('lat1', 'lat2', 'lng1', 'lng2') as $ k) {
             $ params [$ k] = round ((float) $ this -> _ getParam ($ k, 0.0), 4);
         }
         $ params ['no_groups'] = ('true' == $ this -> _ getParam ('no_groups', null));
         $ params ['deal_type'] = ('sell' == $ this -> _ getParam ('deal_type', null))?  'sell': 'buy';
         $ params ['appointment'] = explode (',', trim ($ this -> _ getParam ('appointment', '')));
         $ params ['except_objects'] = explode (',', trim ($ this -> _ getParam ('except_objects', ''))));

         $ dbWhere = Medialab_Items :: getActiveItemsLimits ();
         if (@ $ this-> user-> id) {
             $ dbWhere = array ('(('. implode ('AND', $ dbWhere). ') OR o.uid ='. $ this-> user-> id. ')');
         }
         $ dbWhere [] = "` deal`.`type` = '". $ params [' deal_type ']."' "";
         $ dbWhere [] = '`marker`.`is_polygon` = 0';

         $ markers = Medialab_Gmap_Marker :: getMarkersDynamic ($ params, $ dbWhere);

         $ qty = 0;
         $ s = "<m> \ n";
         foreach ($ markers as $ marker) {
             $ isGroup = (1 <$ marker ['qty']);
             $ s. = '<mi = "'. $ marker ['id']. '"'
                 .'o = "'. $ marker [' object_id '].'" '<BR />
                 .'t = "'. $ marker [' lat '].'" '
                 .'g = "'. $ marker [' lng '].'" '
                 .'q = "'. $ marker [' qty '].'" '
                 .'a = "'. ($ isGroup?' group ': $ marker [' appointment_type ']).'" /> '. "\ n";
             $ qty + = $ marker ['qty'];
         }
         $ s. = '<info count = "'. $ qty." \ "/> \ n";
         $ s. = '</ m>';

         header ('Content-Type: text / xml; charset = windows-1251');
         exit ($ s);
     }
BRANCH BR out of code. I had to insert it, otherwise habraparser buggy. I do not know why, but without it, it pulls out a piece of code in one line and scrolling appears.
A class that deals with everything dirty :)
class Medialab_Gmap_Marker {/ * * * Block size in degrees for a scale of 0. * 72x128 sets 6x6 blocks in the visible area * 64x96 - 8x8 * * * / public static $ blockSize = array ('lat' => 64.0, 'lng' = > 96.0); / ** * Calculate map * * @param int $ zoom Map zoom * @return array Block $ public = function ($ zoom = 10) {$ rect = array () ; foreach (array ('lat', 'lng') as $ k) {$ rect [$ k] = round (self :: $ blockSize [$ k] / (1 << $ zoom), 4); $ rect [$ k .'_ half '] = round ($ rect [$ k] / 2, 4); } return $ rect; } / ** * Fetches markers for visible map area, dynamically grouping them if needed * * @param array $ params Array of search params, provide at least (lat, lng) . * @param array $ dbWhere Additional SQL query conditions (*) *return array Found items * * TODO: w / Google Maps API * / public static function getMarkersDynamic (array $ params, array $ dbWhere = array ()) {$ block = self :: getBlockSize ($ params ['zoom']); $ dbWhere [] = '(`marker`.`lat` BETWEEN'. $ params ['lat1']. 'AND'. $ params ['lat2']. ')'; // Longitude 180 -> -180 degrees wrap workaround if ($ params ['lng2'] <$ params ['lng1']) {$ dbWhere [] = '((`` ```lng` BETWEEN'. $ Params ['lng1']. 'AND 180.0) OR (`marker`.`lng` BETWEEN -180.0 AND'. $ params ['lng2']. '))'; } else {$ dbWhere [] = '(`marker``lng` BETWEEN'. $ params ['lng1']. 'AND'. $ params ['lng2']. ')'; } if (($ params ['area_min'] || $ params ['area_max']) && $ params ['units']) {$ unit = DB :: FindFirst ('ezem_units', array ('rate'), array ('id' => $ params ['units'])); if ($ params ['area_min']) {$ dbWhere [] = '`o`.`area`> ='. ($ params ['area_min'] * $ unit ['rate']); } if ($ params ['area_max']) {$ dbWhere [] = '`o`.`area` <='. ($ params ['area_max'] * $ unit ['rate']); }} $ a = $ params ['appointment']; if (count ($ a) && $ a [0]) {$ dbWhere [] = "` appointment`.`type` IN ('".implode ("', '", $ a)."') "; } $ a = $ params ['except_objects']; if (count ($ a) && $ a [0]) {$ dbWhere [] = '`o`.`id` NOT IN (' .implode (',', $ a). ')'; } $ dbGroupBy = '`marker`.`id`'; if (($ params ['zoom'] <13) &&! $ params ['no_groups']) {// Group only for zooms <= 12 and with no' no_groups' flag set $ dbGroupBy = '`grp_lat`,` grp_lng` '; } $ query = 'SELECT `marker`.`id`,` marker``object_id`, `appointment`.`type` AS` appointment_type`, AVG (`marker`.`lat`) AS` lat`, AVG (`marker``lng`) AS` lng`, FLOOR ((`marker`.`lat` - '. $ params [' lat1 '].') / '. $ block [' lat '].') AS `grp_lat`, FLOOR ((` marker``lng` - '. $ Params [' lng1 '].') / '. $ Block [' lng '].') AS `grp_lng`, COUNT (` marker `.`id`) AS` qty` FROM `ezem_gmap` AS` marker` JOIN `ezem_object` AS` o` ON (`o`.`id` =` marker`.`object_id`) JOIN `ezem_appointment` AS` appointment` ON (`appointment`.`id` =` o`.`applement_id`) JOIN `ezem_deal` AS` deal` ON (`deal`.`id` =` o`.`deal_id`) WHERE '.implode ('AND', $ dbWhere). ' GROUP BY '. $ DbGroupBy; return DB :: Query ($ query); }} The portal is implemented on Zend Framework , Smarty , Yandex Server and Jquery . A working example of what I said can be found on our website .
ps Plans for the near future: add support for polygons and replace Yandex search with sphinx , but more on that in the next articles.
pps We are still looking for intelligent programmers .
Source: https://habr.com/ru/post/28621/
All Articles