How does poor performance affect sales in eCommerce?

This translation continues the series [links: 1 , 2 ] of introductory materials on various aspects of working in eCommerce. This article will focus on how sales depend on the performance of the eCommerce site, and on the basic approaches to working with this aspect of online trading.
As the period of mass purchases on holidays is approaching [the original article was published on September 17, 2014 - approx. perev.], when almost 18% of purchases fall under the category of “abandoned baskets” due to the slow operation of eCommerce sites, it's time to discuss how low productivity can affect e-sales, give real-life examples and give tips on how to improve the performance of the site.
')
Why is site performance so important?
Ten years ago, the number of companies trading online was relatively small. Nowadays, those who do not engage in online commerce are a minority, and their number is constantly decreasing. Due to the pervasive nature of the Internet in our modern life, the size of the online sales market is enormous, as is the level of competition in it.
Buyers are spoiled by the range and are not afraid to look for goods. Logging on to the site with low productivity, users immediately go to look for goods elsewhere. The slow operation of the e-commerce site will cause you to lose your current sales, as well as all the repeat business that might follow.
Load Impact investigated this issue in 2012 and found that 53% of e-commerce site owners were losing money or customers because of the poor performance or instability of their site.

Research Question: Did you lose money or customers due to the poor performance or instability of the site last year?
Legend: light green columns - e-commerce, dark green - other
.
The first two columns: lost money or customers; the second pair of columns: did not lose money or customers; third pair: unknown.
And this is an important point. If you plan to expand your business through online trading, the slow work of the site will not only reduce the number of sales in the near future, but also significantly reduce the chances of long-term business development.
Statistics confirm this. Organizations regularly monitor the relationship between website speed and conversion / revenue figures. I learned this from my own experience working with several e-commerce clients. High site performance can greatly increase the success of even a relatively small online business.
Studying the activities of the giants of online commerce, we have to admit how great the importance of fast site operation can be. Back in 2006, the administration of the Amazon site clearly and clearly stated that increasing the speed of a web page by 100 milliseconds gives a one percent increase in revenue. Former Amazon employee Greg Lindan also refers to this on his blog :
"During the A / B testing, we periodically suspended the page for 100 milliseconds and found that even the smallest delays lead to a significant decrease in profits."
Evaluation of the site will help to avoid false conclusions.
As we have already determined, the speed of work is a decisive factor in ensuring the availability of the site, and how high it is, distinguishes an ordinary business from a large business. A frequent problem of small and medium-sized companies is the lack of awareness about the performance of the site and how important this factor is.
It is easy to assume that the website works fine if there is a sale. If there are no sales on the site, it is easy to conclude that it needs to be redone, or you simply need to increase traffic. It is dangerous to make such conclusions without confirming them with any data.
So how to get the necessary data? Evaluation, evaluation and evaluation again! It seems that it will require too much hard work? Consider what you risk if you don’t:
- Poor service = bad reputation.
- You can spend a significant part of the budget on changing the site, due to the fact that "it does not work," while you only need to assess its performance.
- You can increase the share of the budget for banner advertising to increase traffic on your site, but this will only create more dissatisfied visitors than increase the number of happy customers. In fact, this is the same thing as pouring money into a “leaky bucket”, as they say. Worse, the more money you invest, the more dissatisfied customers you will create!
How to evaluate website performance
For those who are not familiar with performance monitoring, estimating the speed of the site may seem easier than it actually is.
At first glance, the most accessible way to find out how fast the site loads is to make a request to the start page and ... then ... see how long it will load! If it loads in 3 seconds, then everything is fine. If the download takes 10 seconds, then this is not very good.
Although such an incredibly simple check and useful for some analysis, it does not provide a complete picture of the performance of your website. It is necessary to take into account many factors if you want to get reliable data on the speed of its work. Here are just some of them:
- Overall site performance - The start page is just one of the pages. Checking the download speed of only the start page does not give an idea of the work of the rest of the site, the performance of which may be completely different.
- Performance under load - If your site is working normally with two users on the site at the same time, but it starts to slow down when 10 people visit it, then this is already a problem.
- Geographic location - A website may work fine in some countries, and slowly in others. Testing conducted in one place will not say anything about how the site works in other places around the world.
- The actions of real users - Users behave differently. Someone will go to the page and immediately leave it, someone will go to the site and look at several pages in search of information, someone will fill out a feedback form or place an order if they sell goods online on the site. In short, the best test of site performance is its load by virtual users, modeled on the basis of real-world scenarios of behavior.
Thus, you will receive the most reliable data when testing the work of many pages and creating a lot of virtual users who visit the site, act differently, and are located in different countries.
But how to determine which user behavior scenario should be applied? That is, what user behavior you need to simulate? This will help traffic statistics on the site. Tools like Google Analytics will help determine how visitors to your site are currently working.
If the conversion rate on the feedback form page is 10%, then it will be correct to create a user behavior scenario that simulates this situation and divert 10% of the generated site load to the execution of this scenario. Simply put, examine your current audience and create a series of behavioral scenarios that simulate user actions.
The study of technical terminology is also an important point when preparing your own site load testing.
Load Impact provides a convenient glossary of terms that can help you understand definitions such as “load increase”, “load reduction”, “virtual users”, “accumulated load time”, “load testing”, “user behavior scenarios” and so on. .
Real-life site performance metrics
I believe that real life examples best demonstrate the importance of high site performance. I still have some information about customers in e-commerce, with whom I had to work. I hope that it will allow you to better understand the methodology for assessing the performance of sites.
EXAMPLE 1: Evaluation of server speed under load
The guys from Load Impact provided me with the tools to test the performance on the site of one of my clients. From the screenshot below, you can get an overview of the load testing scheme I used.
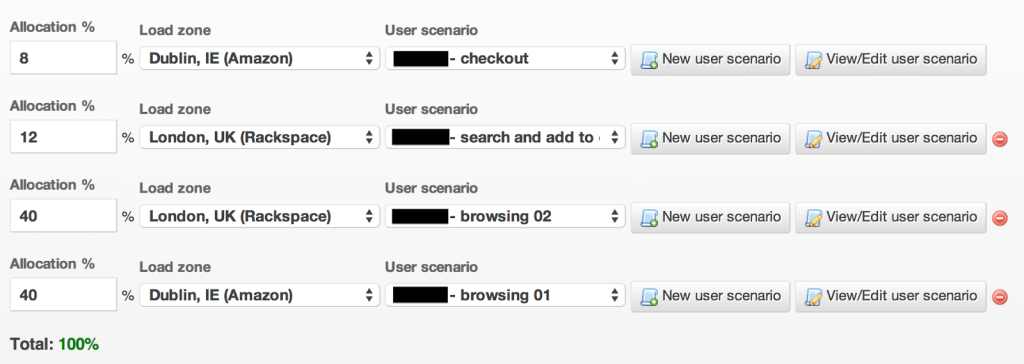
As you can see, according to my scheme, most virtual users (80%) will simply browse the site. The remaining 20% will search for products, add products to their e-shopping cart and order them. These numbers may not be entirely accurate, but they are quite suitable for basic testing.
Testing should have lasted 5 minutes, while the number of virtual users on the site should increase from 0 to 25 during this time. Longer testing will help test the server at constant load, but we will leave it for the next time.

When testing, I checked server performance using several other tools besides Load Impact:
- New Relic is a suite of tools for monitoring application performance and software testing.
- Anturis is a service for monitoring servers, websites and information infrastructure.
New Relic vividly demonstrates how, during testing, a sharp increase in the intensity of the server processor is expected, as well as an average page load time.
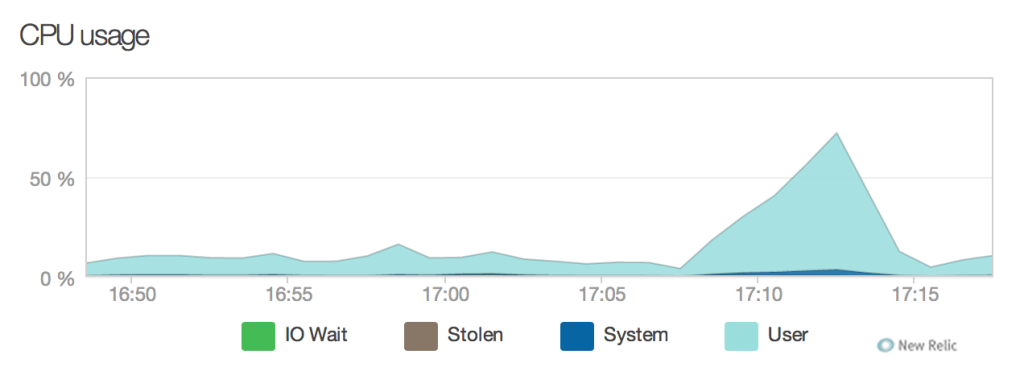

Anturis also shows a dramatic increase in processor load, as shown in the graph below.

With this information, we can tell how the web server itself worked during testing. But what really matters is how the interaction with the user has changed, if at all.
The Load Impact graph below shows that interaction with virtual users has changed significantly during testing. There was no serious server slowdown at this level, however, the accumulated page load time for user behavior scenarios changed greatly. It is worth noting that each script included several page loads.
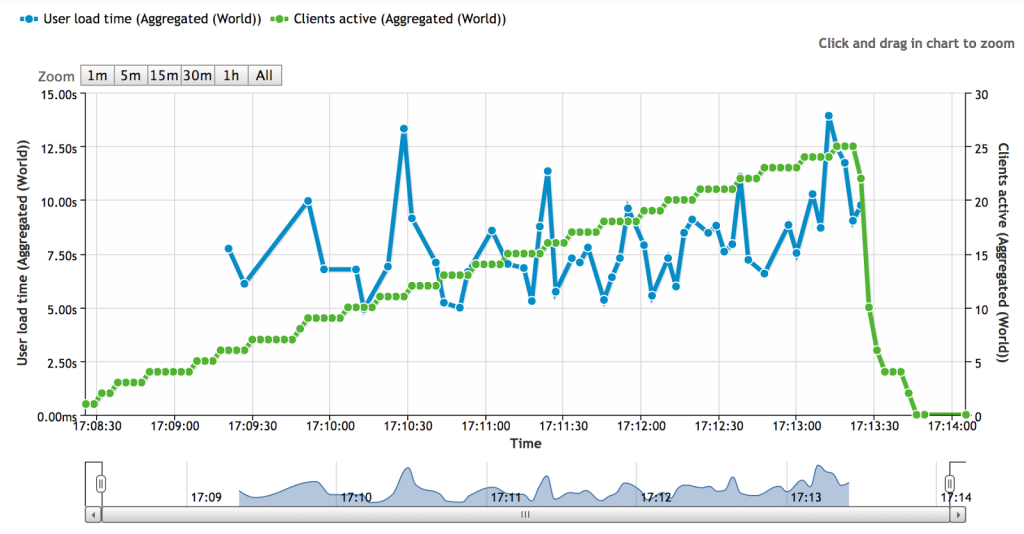
The blue graph and the scale on the left show the change in the loading time of the site pages. The green graph and the scale on the right show the change in the number of active users.
During this test, the load was created somewhat larger than the site usually experiences. Variations in the duration of loading pages may indicate a certain instability, which can be further aggravated with a higher load. It is necessary that the blue graph be as even as possible, which will ensure the stability of interaction with users. Of course, even if consistently high page loading speeds can be achieved in the short term, regular monitoring and analysis will also be useful for tracking that this level is maintained. If the real traffic on the site starts to increase significantly, then more serious performance testing may be needed.
EXAMPLE 2: Correcting Performance Problems
The following data was obtained from a client with whom I worked for several years. Now we are engaged in its online store with more than 4,000 items of goods and monthly traffic from 60,000 to 120,000 page views.
At one stage, we used Pingdom to track the speed of the server’s response, which in itself provides useful information. On the client's site there were constant problems with the speed of work. It didn’t interfere too much with the site’s work, and orders still came in, but the site was definitely slower than it should have been.
After a long analysis (in terms of a tiny budget!), We managed to achieve significant success in reducing the response time on the site, by correcting the slowly executed external scripts. The chart below speaks for itself.
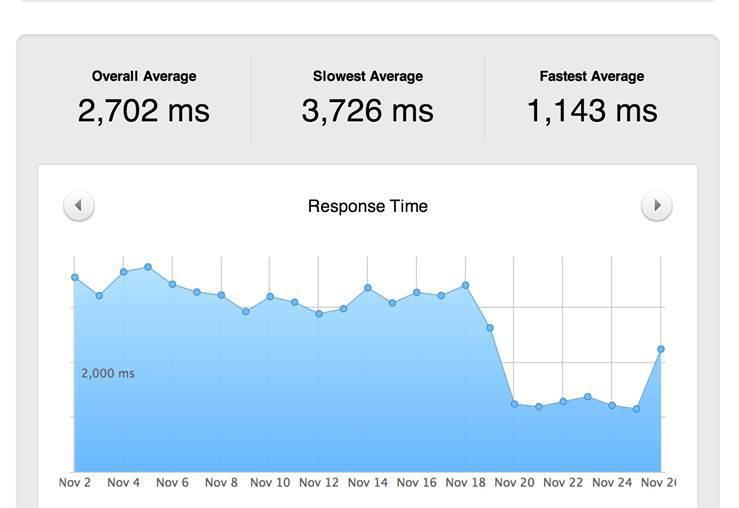
So did all this really help the business? The short answer is yes. We solved the problem on November 19, as reported by a drastic reduction in response time on the graph above. The following is the percentage of failures and the number of orders made.
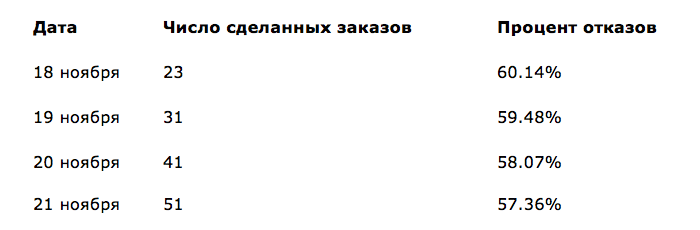
It is noteworthy that on November 21 the site showed the highest attendance for the entire 2013 year. Several days with peak revenues also occurred in November and December, which was not observed during this year or during the past.
In general, the analysis of the average time of calling on the site and identifying the causes of slowing down work contributed to a significant business development. We continue to more closely monitor the client’s site, conducting testing based on real-world user behavior scenarios, which gives an idea of how the entire site works (and not just the start page).
Practical ways to increase the speed of the site
To get started is to spend a simple test for page speed. Pingdom provide effective tools for this. Alternatively, you can use the tools built into your browser (for example, DevTools in Chrome) or browser plugins, for example Firebug for Firefox.
When conducting a test on page load speed, you need to pay attention to the following:
- any third-party requests, such as unnecessary downloads
- any external requests (scripts or files downloaded from external sites), either unnecessary or requiring a long time to download.
- any requests to “large” files, the size of which can be significantly reduced, for example, in the case of images.
When you have determined what needs improvement, you can make corrections and then run the test again. We often have to work with e-commerce sites, which have the ability to reduce the number of file requests by 20% without any problems, and sometimes we manage to reduce the page size by half. When pages are viewed hundreds, if not thousands of times a day, reducing the size of the site, reducing the load on the server, is very important to maintain the stable operation of the site.
Here are some tips for improving website performance:
- Optimize the size of images - not all JPG images must necessarily be in 100% quality and it does not have to be JPG format! Choose the correct format and file compression ratio.
- Minimize CSS and Javascript files - reduce their size. Although, if you use the CDN network to store javascript libraries (see information below), you should not worry about it.
- Combine CSS and JS files - combine CSS and Javascript files into one file, or simply upload the appropriate files to the pages that use them.
- Clear server / site logs - make sure that logs generated by the server software or the site platform are not created unnecessarily.
- Use the CDN network, for example, Google Hosted Libraries - this will reduce the load on your server and increase work efficiency, due to the fast loading of scripts.
- Remove external scripts that slow down the site - if possible, limit the dependence of the functioning of your site on external servers (if you do not use a high-quality CDN network, of course). Security software sometimes loads the server more than it does benefit.
- Configure Apache and MySQL - in case your site is working with the support of the LAMP software complex, spend more time adjusting the memory settings and optimizing the performance of Apache and MySQL.
- Provide a sufficient amount of RAM and CPU power — adding RAM and CPU power to a poorly tuned server is the same as adding fuel to the fire. You only worsen the situation. To begin with, determine the characteristics of your server and its applications, and then it will be possible to select resources for it that meet the requirements of your site.
- Use a reliable DNS server — check if there are any problems with your network connection or DNS server before looking for errors in the site code or in the operation of the server itself. If your DNS provider is unreliable, it can significantly reduce the performance and efficiency of the site.

Source: https://habr.com/ru/post/283842/
All Articles