Intel System Studio for Microcontrollers 2015: development and debugging details
We have already talked about how to get started in Intel System Studio for Microcontrollers 2015 (ISSM) and create programs for the Intel Quark D1000. Today we will talk about how to modify the simple firmware from the ISSM examples in IDE Eclipse. Also consider the work with the reference board for conducting technical tests D1000 (Customer Reference Board, CRB). Namely, using a JTAG connection, we use OpenOCD in order to flash the image we created in the microcontroller and debug the code.
Intel System Studio for Microcontrollers includes a C / C ++ compiler based on LLVM (composed of an assembler, linker and C / C ++ runtime libraries), a GDB debugger and an in-circuit debugger OpenOCD. ISSM can be used as a stand-alone toolkit, but it also has plugins for integrating with Eclipse IDE.
Before creating a project for Intel Quark D1000, you need to install the necessary software. Namely: IDE Eclipse for C / C ++ developers, ISSM, Putty and Zadig. When installing programs, try to follow carefully the manuals that can be found in the ISSM installation directory, in the “docs” folder. Here we also assume that you understand the examples of “Hello World” and “FW” for IDE Eclipse. If this is not the case, please refer to the Using the Eclipse IDE user guide. It can also be found in the aforementioned docs folder.
After everything is ready for work, launch Eclipse using the batch file “runEclipse.bat”, specifying the folder where Eclipse is installed as an argument. Then open the firmware project, in our case it is “FW-D1000”, and build it. Errors should not be.
')
After the firmware was successfully assembled, locate the file “FW-D1000.elf”, which is located in the project folder “Binaries”. Its contents will be the same as in the image below. If you are unable to see the sections of the image with information about the characters, you need to check whether the objdump utility is installed on the computer. If it is not really installed, refer to the “Viewing GNU Elf and Map Files” section of the user manual in order to install “objdump” and configure the path to it on the computer.

Dump object in file FW-D1000.elf
After it became clear that the example “FW-D1000” compiles normally, it can be changed to fit your own needs. Here we are going to change the string that the PushButton program displays from the FW-D1000 example in the terminal window.
Navigate to the “Applicaition” folder of the “FW-D1000” project. It has 10 sample applications for the Intel Quark D1000. Review the “AppConfig.h” file to find out which particular application will be integrated into the project, and, if necessary, modify the file so that this application is “PUSH_BUTTON_TEST”. This is what the file looks like in which the integration into the finished project of what we need is included.
Now go to the initial application file, “PushButton.c”, which is located in the “Applications” folder, and slightly modify the code. As a result, when the program starts up the device, you will understand for sure that exactly its modified version is being executed. Here we have corrected the string "rts_interrupt_msg". This line will be displayed every second by interrupting the real-time clock (Real Time Clocl, RTC).
Change the file, save it. Now everything is ready for compilation and firmware image on the device.
In order to flash the compiled image on the D1000, you need to establish a JTAG connection with the board. This is described in detail in the “Starting Debugging Session” user's manual. Before you open the OpenOCD perspective in Eclipse, check if OpenOCD was able to successfully read the IdCode code of the target CPU, if it matches the expected (“Expected”) processor code.
In this example, we connected via JTAG to the D1000 and established an OpenOCD connection before running Eclipse. Sometimes Eclipse cannot read “IdCode” and shows zeros instead of code. If this happens, click the reset button and see if OpenOCD has succeeded in correctly detecting the “IdCode”. After everything has been determined, and you have waited for the appearance of messages, such as those shown in the figure below, you can flash the modified image on D1000.

OpenOCD console when connected to the D1000 reference board
After you have managed to establish a JTAG connection with the D1000 board, assemble the “FW-D1000” project in the Eclipse IDE. If no errors are found during the build, the image file “FW-D1000.elf” will appear in the “Binaries” folder. It can be flashed to the device using the debugging perspective “Debug” in Eclipse, which is configured to use GDB through OpenOCD.

Configuring the debugger to work with the D1000 reference board using OpenOCD
After the image is flashed, a message appears on the successful completion of the operation in the OpenOCD console (take a look at the picture with the console above). In this example, it is necessary for the debugger to stop the process in the “main” function for step-by-step execution.
The following figure shows how to set a breakpoint at the entrance to the "main". The debugger, after completing the firmware and loading the image, will stop the processor at the beginning of the function and will be ready for step-by-step program execution.

Set a breakpoint in the function "main"
Now open the console serial port using Putty. This is necessary in order to see the UART messages that will be displayed when the program sends a specified message on a hardware interrupt of a real-time clock (RTC) or when a button is pressed (ButtonPress).
When connected to the D1000 board, we will have two USB devices at our disposal. Namely, one is the Dual RS232 HS, which is used for the OpenOCD JTAG connection, and the second is the USB interface to the serial port. Before launching the PushButton application, you must open a connection to the serial port using the Putty client with the following settings: Baudrate-19200, Flow Control-XON / XOFF.
When the image firmware is completed, the code will start debugging, from the very beginning of the “main” function, as shown in the figure below. In this example, the PushButton program is launched, and then the debugger waits for the PushButton function, the main function of the application, to be called. Here you can view the code written in a high-level language, as well as machine commands in the Disassembly window, in which the instruction of the current command pointer is highlighted.
Now you can start debugging, perform steps with bypassing procedures (step over), steps with entering procedures (step into), resume (resume) execution of the program.

The debugger stopped the processor at the beginning of the "main" function
Here we perform a step in the procedure, then we see the source code of the input function “PushButton”, the debugger opens “PushButton.c” in order to point to the next executable function.

Step into the procedure performed from the "main"
As a result, we can resume the execution of the program, it will work as usual. If you now look at the Putty terminal window, you can see the message log from the D1000. Messages containing exactly the line that we modified above in the example code are output by the interruptions of the real-time clock.

Test output of the program running on the D1000
The reference board for conducting technical tests (CRB V2) contains the following components:
The controller has 24 GPIO outputs, many of which are multifunctional (for details, see the table). CRB V2 connects these pins to the pads of the circuit board, which is very similar to the Arduino, but is not fully compatible with this standard. It is worth noting that several of the findings, in addition, are connected to peripheral devices located on the board. In some cases, they cannot be used as multifunctional conclusions. They are noted in the table and in the description of the hardware components of the board, which is given below. Namely, when describing the outputs, their names are given for the D1000 microcontroller, for the Arduino, and for the CRB V2 board. Note that the SPI interface is used to communicate with all peripheral devices built into the board using the following pins:
Connecting Intel Quark D1000 pins to CRB v2

The CRB V2, in addition, includes some other components whose behavior cannot be controlled by the D1000 microcontroller.
Intel Quark D1000 CRB v2 board layout
Now you know how to work with firmware for Intel Quark D1000 in IDE Eclipse. You can edit them, write to the device, test and debug the code. We also talked about the reference board for conducting technical tests (CRB V2), which, in addition to the Quark D1000, includes a set of additional components. Here and here you can find details about the Intel Quark D1000, and here about the ISSM.
Development environment for Intel Quark D1000
Intel System Studio for Microcontrollers includes a C / C ++ compiler based on LLVM (composed of an assembler, linker and C / C ++ runtime libraries), a GDB debugger and an in-circuit debugger OpenOCD. ISSM can be used as a stand-alone toolkit, but it also has plugins for integrating with Eclipse IDE.
We open the project of firmware in ISSM
Before creating a project for Intel Quark D1000, you need to install the necessary software. Namely: IDE Eclipse for C / C ++ developers, ISSM, Putty and Zadig. When installing programs, try to follow carefully the manuals that can be found in the ISSM installation directory, in the “docs” folder. Here we also assume that you understand the examples of “Hello World” and “FW” for IDE Eclipse. If this is not the case, please refer to the Using the Eclipse IDE user guide. It can also be found in the aforementioned docs folder.
After everything is ready for work, launch Eclipse using the batch file “runEclipse.bat”, specifying the folder where Eclipse is installed as an argument. Then open the firmware project, in our case it is “FW-D1000”, and build it. Errors should not be.
')
After the firmware was successfully assembled, locate the file “FW-D1000.elf”, which is located in the project folder “Binaries”. Its contents will be the same as in the image below. If you are unable to see the sections of the image with information about the characters, you need to check whether the objdump utility is installed on the computer. If it is not really installed, refer to the “Viewing GNU Elf and Map Files” section of the user manual in order to install “objdump” and configure the path to it on the computer.
Dump object in file FW-D1000.elf
Transferring data from a hardware interrupt handler
After it became clear that the example “FW-D1000” compiles normally, it can be changed to fit your own needs. Here we are going to change the string that the PushButton program displays from the FW-D1000 example in the terminal window.
Navigate to the “Applicaition” folder of the “FW-D1000” project. It has 10 sample applications for the Intel Quark D1000. Review the “AppConfig.h” file to find out which particular application will be integrated into the project, and, if necessary, modify the file so that this application is “PUSH_BUTTON_TEST”. This is what the file looks like in which the integration into the finished project of what we need is included.
//#define MAN_DECODING //#define POWER_MANAGEMENT_TEST #define PUSH_BUTTON_TEST //#define ADC2SPI_TEST //#define ADC2GPIO_TEST //#define DDS_TEST //#define OSCILLATOR_RE_TRIM //#define PWM_TESTING //#define MOTOR_CTRL //#define UART_WAKE Now go to the initial application file, “PushButton.c”, which is located in the “Applications” folder, and slightly modify the code. As a result, when the program starts up the device, you will understand for sure that exactly its modified version is being executed. Here we have corrected the string "rts_interrupt_msg". This line will be displayed every second by interrupting the real-time clock (Real Time Clocl, RTC).
//////////////////////////////////////////////////////////////////////////////// // //////////////////////////////////////////////////////////////////////////////// char rtc_interrupt_msg[] = "\r\nSean RTC interrupt!"; void rtc_callback_function_PB(void) { PUSH_UART(rtc_interrupt_msg,sizeof(rtc_interrupt_msg),0,0); rtc_callback(rtc_callback_function_PB); // } Change the file, save it. Now everything is ready for compilation and firmware image on the device.
Compile and flash the image on the D1000
In order to flash the compiled image on the D1000, you need to establish a JTAG connection with the board. This is described in detail in the “Starting Debugging Session” user's manual. Before you open the OpenOCD perspective in Eclipse, check if OpenOCD was able to successfully read the IdCode code of the target CPU, if it matches the expected (“Expected”) processor code.
In this example, we connected via JTAG to the D1000 and established an OpenOCD connection before running Eclipse. Sometimes Eclipse cannot read “IdCode” and shows zeros instead of code. If this happens, click the reset button and see if OpenOCD has succeeded in correctly detecting the “IdCode”. After everything has been determined, and you have waited for the appearance of messages, such as those shown in the figure below, you can flash the modified image on D1000.
OpenOCD console when connected to the D1000 reference board
After you have managed to establish a JTAG connection with the D1000 board, assemble the “FW-D1000” project in the Eclipse IDE. If no errors are found during the build, the image file “FW-D1000.elf” will appear in the “Binaries” folder. It can be flashed to the device using the debugging perspective “Debug” in Eclipse, which is configured to use GDB through OpenOCD.
Configuring the debugger to work with the D1000 reference board using OpenOCD
After the image is flashed, a message appears on the successful completion of the operation in the OpenOCD console (take a look at the picture with the console above). In this example, it is necessary for the debugger to stop the process in the “main” function for step-by-step execution.
The following figure shows how to set a breakpoint at the entrance to the "main". The debugger, after completing the firmware and loading the image, will stop the processor at the beginning of the function and will be ready for step-by-step program execution.
Set a breakpoint in the function "main"
Now open the console serial port using Putty. This is necessary in order to see the UART messages that will be displayed when the program sends a specified message on a hardware interrupt of a real-time clock (RTC) or when a button is pressed (ButtonPress).
When connected to the D1000 board, we will have two USB devices at our disposal. Namely, one is the Dual RS232 HS, which is used for the OpenOCD JTAG connection, and the second is the USB interface to the serial port. Before launching the PushButton application, you must open a connection to the serial port using the Putty client with the following settings: Baudrate-19200, Flow Control-XON / XOFF.
Debug: Step-by-Step Code Execution
When the image firmware is completed, the code will start debugging, from the very beginning of the “main” function, as shown in the figure below. In this example, the PushButton program is launched, and then the debugger waits for the PushButton function, the main function of the application, to be called. Here you can view the code written in a high-level language, as well as machine commands in the Disassembly window, in which the instruction of the current command pointer is highlighted.
Now you can start debugging, perform steps with bypassing procedures (step over), steps with entering procedures (step into), resume (resume) execution of the program.
The debugger stopped the processor at the beginning of the "main" function
Here we perform a step in the procedure, then we see the source code of the input function “PushButton”, the debugger opens “PushButton.c” in order to point to the next executable function.
Step into the procedure performed from the "main"
Running an example on the D1000
As a result, we can resume the execution of the program, it will work as usual. If you now look at the Putty terminal window, you can see the message log from the D1000. Messages containing exactly the line that we modified above in the example code are output by the interruptions of the real-time clock.
Test output of the program running on the D1000
About hardware
The reference board for conducting technical tests (CRB V2) contains the following components:
- Intel Quark D1000 microcontroller.
- Accelerometer
- SPI flash memory.
- Bluetooth LE adapter.
- Serial port module for wifi.
- Serial Port Converter for USB and JTAG.
- Power module
- Battery charging circuit.
Intel Quark D1000 Microcontroller
The controller has 24 GPIO outputs, many of which are multifunctional (for details, see the table). CRB V2 connects these pins to the pads of the circuit board, which is very similar to the Arduino, but is not fully compatible with this standard. It is worth noting that several of the findings, in addition, are connected to peripheral devices located on the board. In some cases, they cannot be used as multifunctional conclusions. They are noted in the table and in the description of the hardware components of the board, which is given below. Namely, when describing the outputs, their names are given for the D1000 microcontroller, for the Arduino, and for the CRB V2 board. Note that the SPI interface is used to communicate with all peripheral devices built into the board using the following pins:
- MST_M2SC (SPI data transfer synchronization signal output, Arduino - D13, CRB v2 - XPB5).
- MST_M2SD (serial data output (MOSI) SPI, Arduino - D11, CRB v2 - XPB3).
- MST_S2MD (serial data input (MISO) SPI input, Arduino - D12, CRB v2 - XPB4).
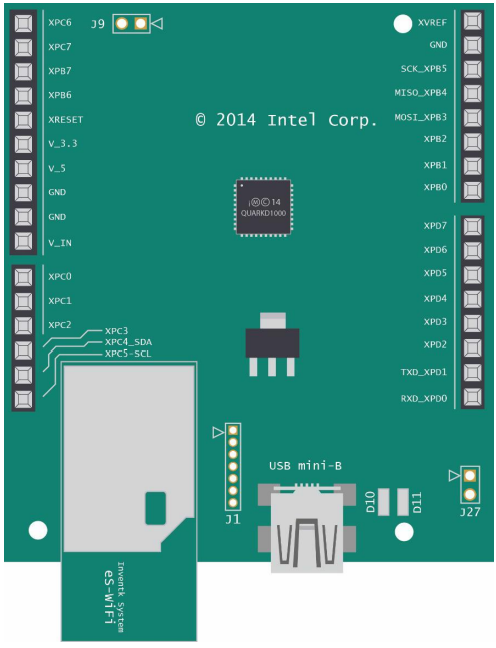
Connecting Intel Quark D1000 pins to CRB v2
The CRB V2, in addition, includes some other components whose behavior cannot be controlled by the D1000 microcontroller.
- FTDI FT2232H is a serial port converter chip for USB and JTAG. It is used to provide console (UART) connections to the D1000, for programming and debugging using the JTAG interface. D6 (yellow) and D7 (green) LEDs are connected to the FTDI FT2232H, they blink when the device receives or sends data.
- Linear Technologies LTC4414, Texas Instruments BQ24080, Maxim Integrated MAX8869 controllers are used for power supply and battery charging. D10 and D11 LEDs are connected to the BQ24080 and are used to indicate battery charge status.
Intel Quark D1000 CRB v2 board layout
findings
Now you know how to work with firmware for Intel Quark D1000 in IDE Eclipse. You can edit them, write to the device, test and debug the code. We also talked about the reference board for conducting technical tests (CRB V2), which, in addition to the Quark D1000, includes a set of additional components. Here and here you can find details about the Intel Quark D1000, and here about the ISSM.
Source: https://habr.com/ru/post/283534/
All Articles