All-Russian Engineering Olympiad for high school students: BigData and Intelligent Energy Systems

- Little Johnny, throw your experiments with cold nuclear fusion, go to the exam prepare.
- SchA, mom.
Olympics are awesome. They allowed such a
I remember we came to the selection committee with a friend, in shorts and with backpacks, in which there were towels and a volleyball, filled out questionnaires, laid out a pack of diplomas from the Olympiads and went to the sea.
')
- What are you late today?
- Yes, so, in the university did.
I am very glad that there were initiative guys who care about the fact that a talented schoolboy-engineer spends his last carefree years frantically preparing to pass the EGE, instead of building jet packs or programming an artificial intelligence germ.
To create a loophole for young talented engineers, they came up with the next thing - let's muddle the engineering Olympiad, which makes it possible to go to university.
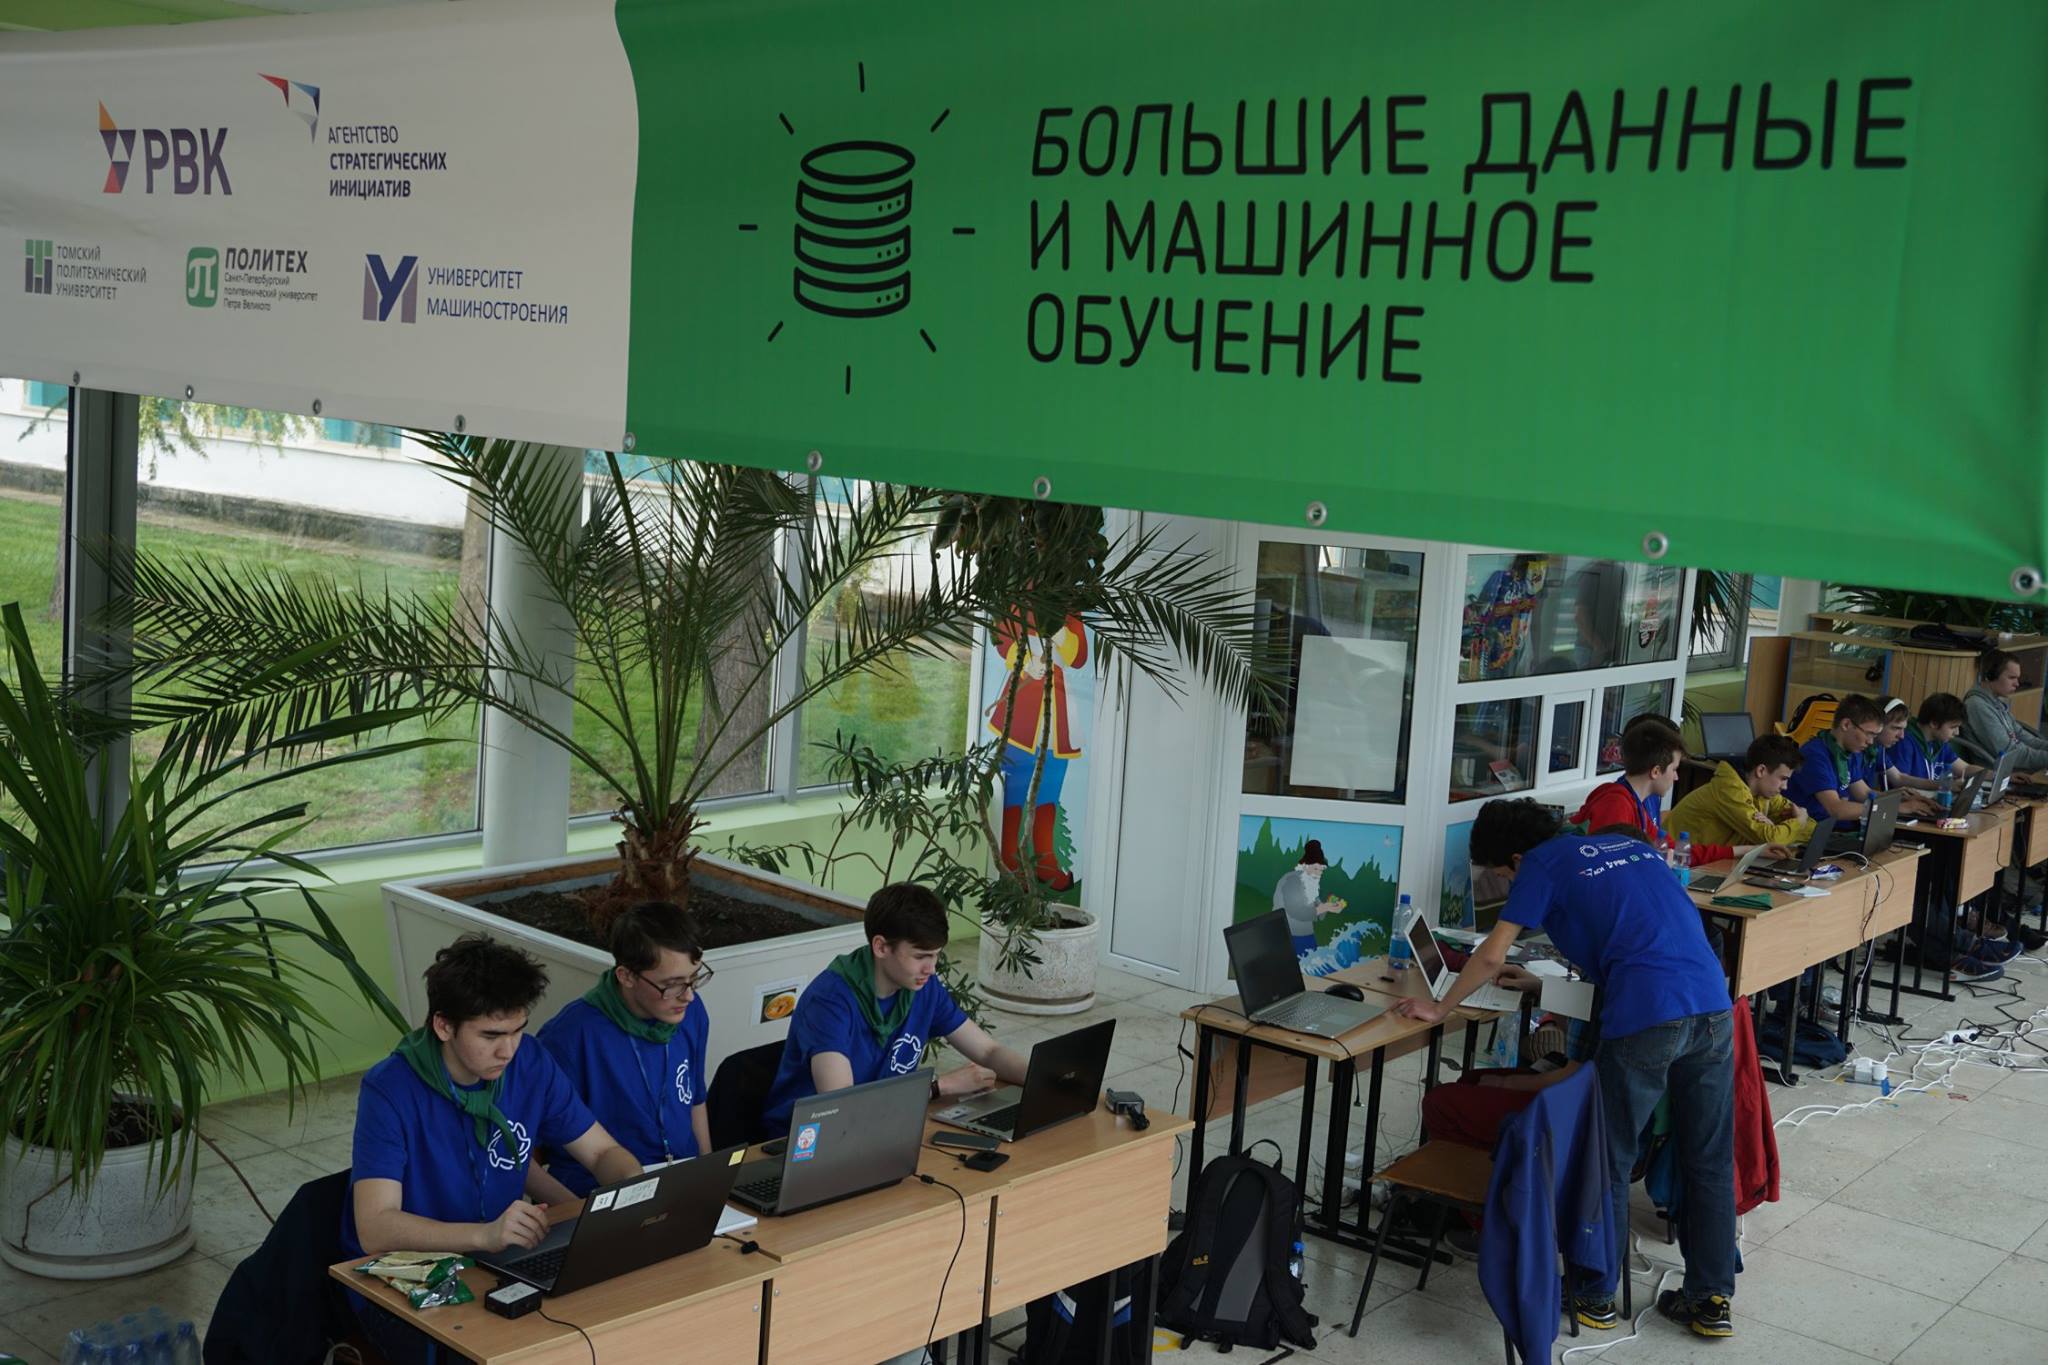
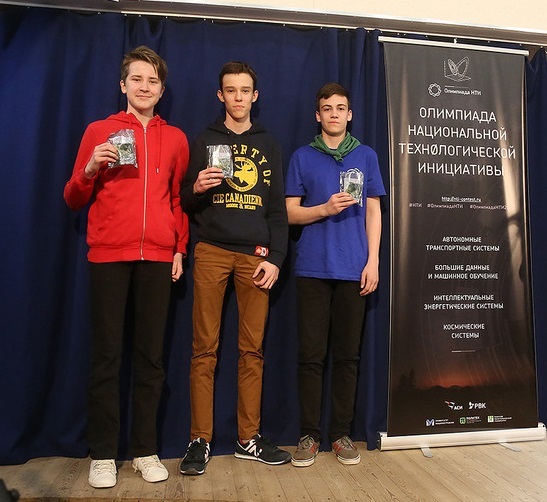
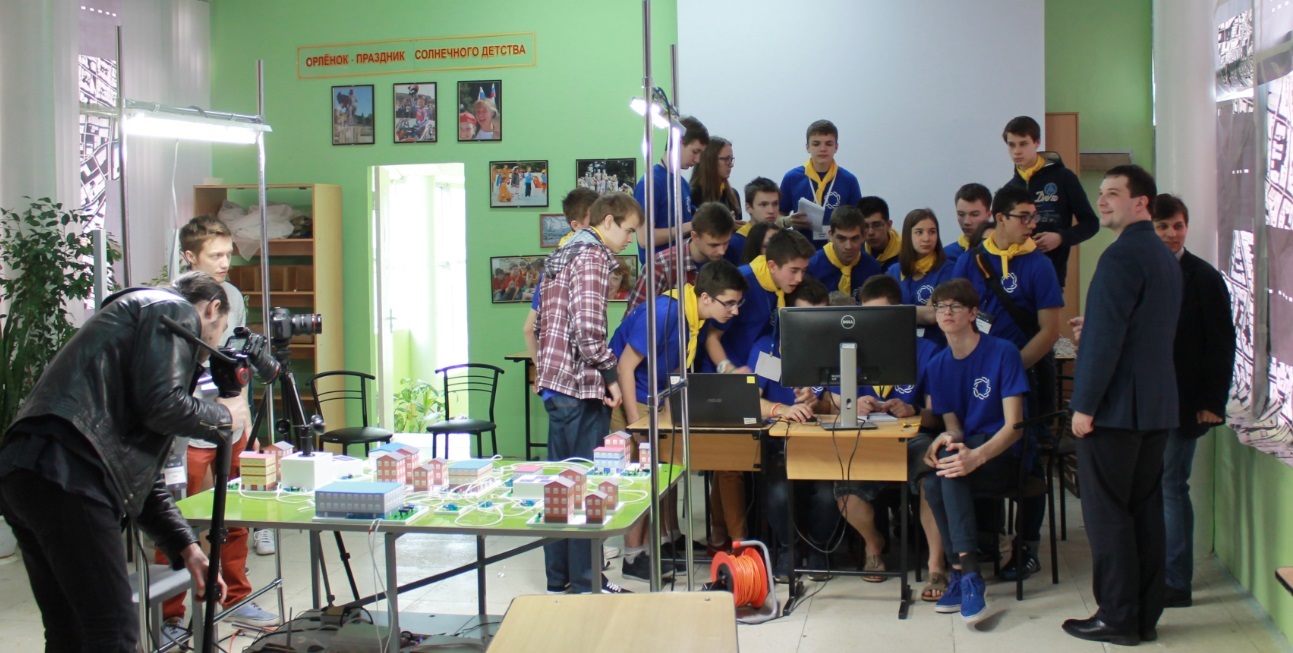
Recently, in the All-Russian Children's Center "Orlenok" passed a "test drive" of the All-Russian Engineering Olympiad. 5000 children from all over Russia participated, about 100 people reached the final. There are many prizes, but the most useful is +10 points for the exam.
I looked after everything and am ready to share my impressions.
The Olympiad was held in four profiles.
- Big data and machine learning .
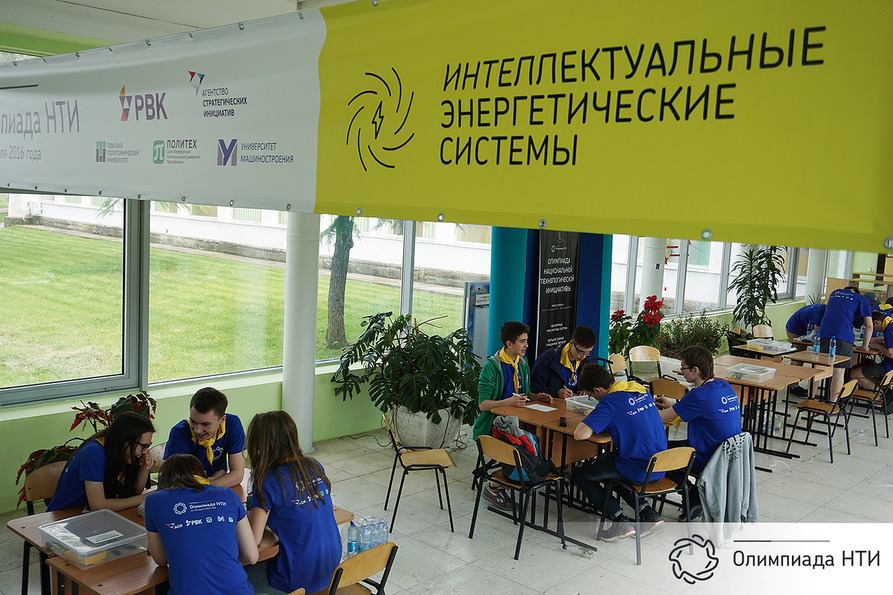
- Intellectual energy systems .
- Space systems .
- Autonomous transport systems.
About the first two profiles I will tell here (a bit of tasks and photos), about the second two - a little later on the GT.
( UPD - Space Systems Report .)
Organization
The Olympiad consisted of two correspondence stages and two full-time students (individual and team).
The organizers are generally interested in immersing the participants in the most vital tasks, necessarily commanding, because such tasks are very helpful in the career guidance and choice of life in school.
However, there are certain criteria that are defined by an organization called the Russian Council of Schoolchildren Olympiads (RISS), which impose certain limits: the tasks must be substantive, the works must be individual, and do not even think about using the Internet.
For this reason, the organizers decided that they would follow the path of distributing different tasks to different stages: at least, laid by the Council - in the first part-time and in person full-time. The tasks of life, the code from the githab and the commandness are in the second part-time and team-based.
As a result, points are summarized, and all requirements are met.
In general, after the end of the Olympiad, the organizers prepared a “brick” for 1000 pages for two weeks with a description of everything that was possible, sent it to the RSSC and now they are sitting on a low start to start preparing the next year Olympiad. The official answer will be on September 1, but the orgy risk guys will start writing tasks and preparing lectures with hackathons in the summer.
Results of the Olympics - nti-contest.ru/results2016
Manual 400 pages on the Olympiad is here .
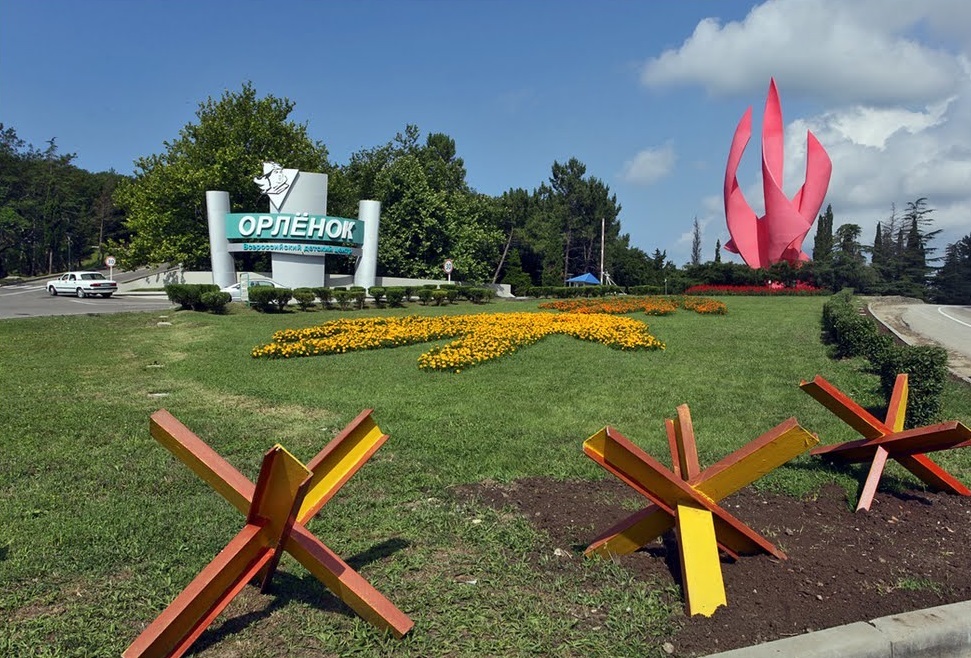
Eaglet
Eaglet , like Artek, very "pumped" place. As I told the friends: "the reactor was taken away, but at night it still glows." The spirit of faith in a bright future remained. In a good way. At least, I was very hooked (by fragments of Soviet propaganda or whatever, but this is from the same series as “I want to go to space”). I am very glad that I got to the legendary place.
Meet you with "anti-tank hedgehogs"
Inside there are such things that you can climb and pick.

By the way, the handles on the doors of a jet plane are working, and, like in the movies, when pressed with a hiss, they creep out of the groove.
Combat training aircraft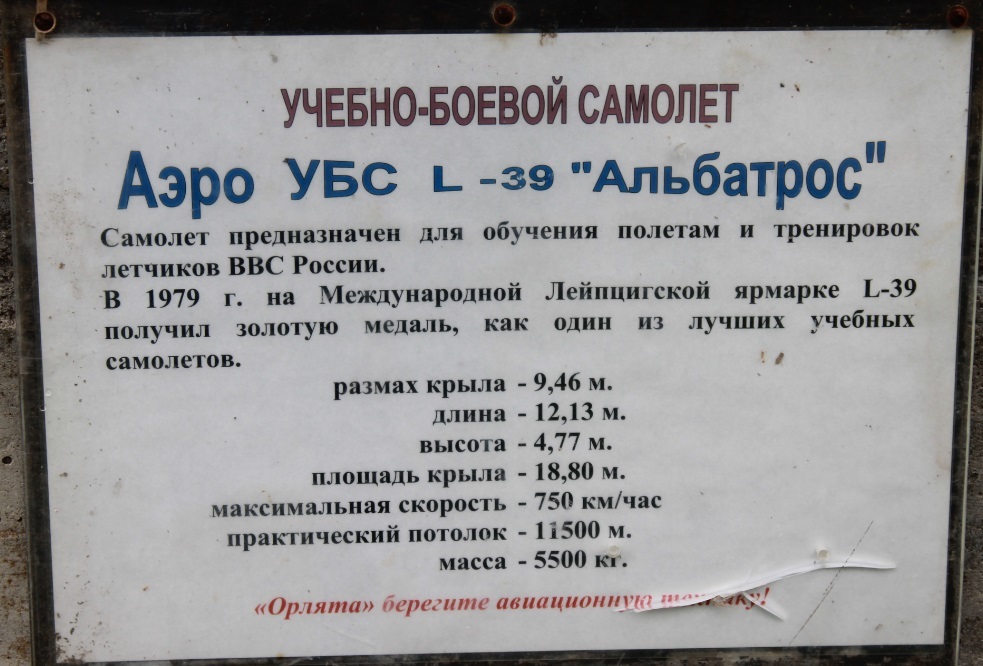
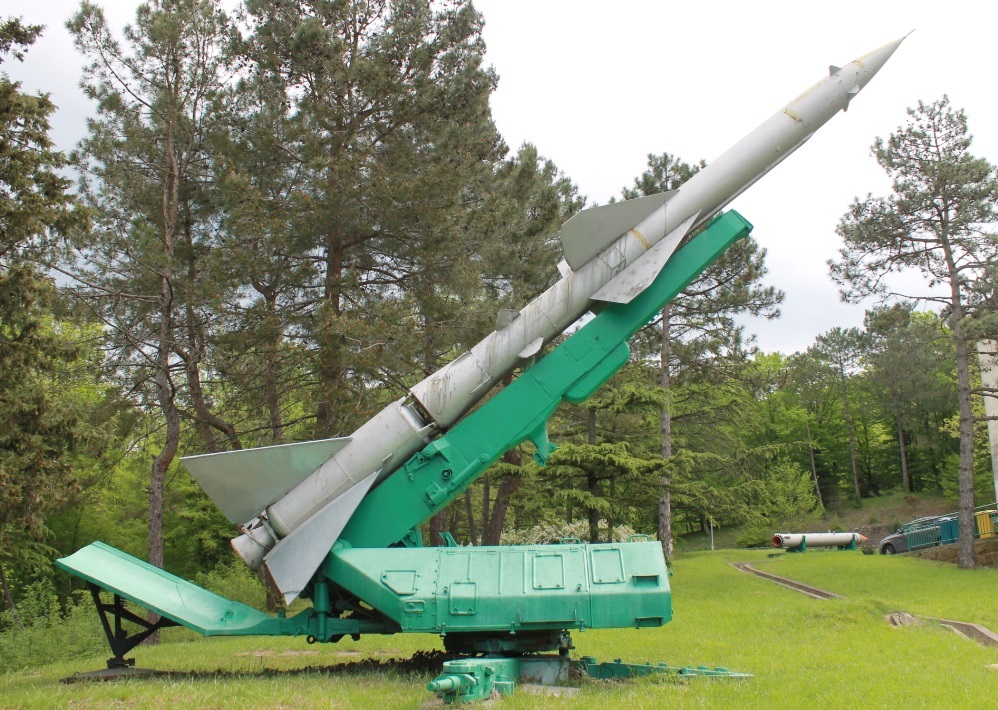
Next to the case "Cosmic"
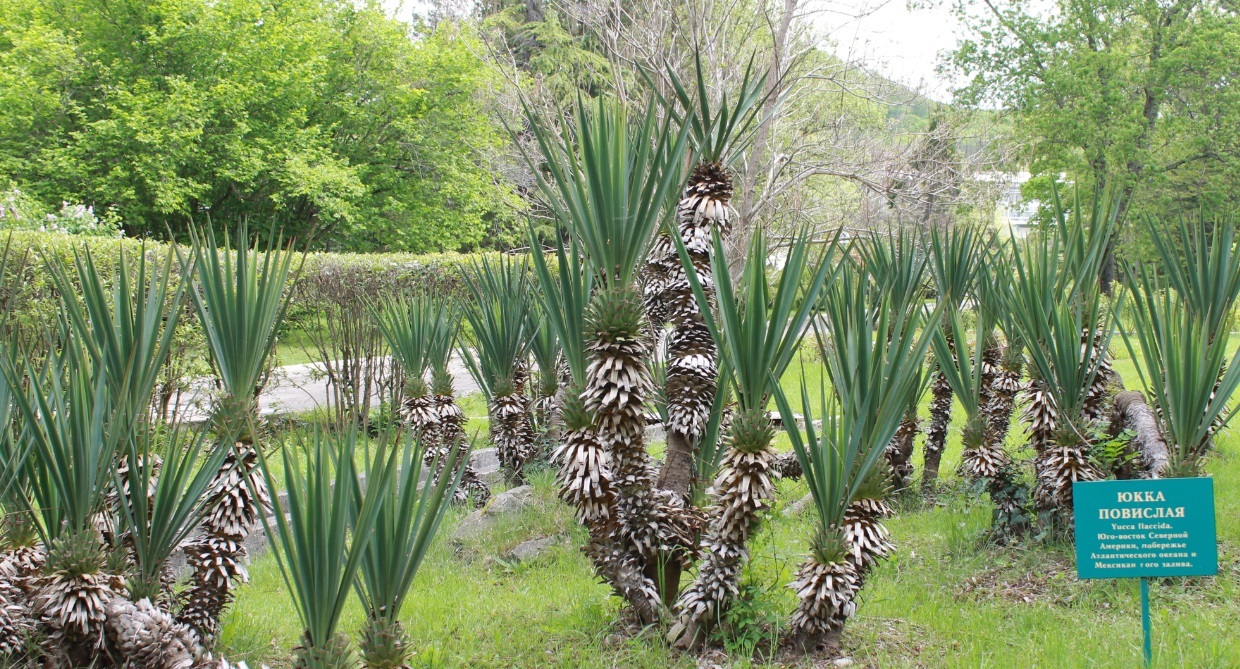
Immediately I remembered Castaneda

Big data
A little bit about what was on the track for big data and machine learning.
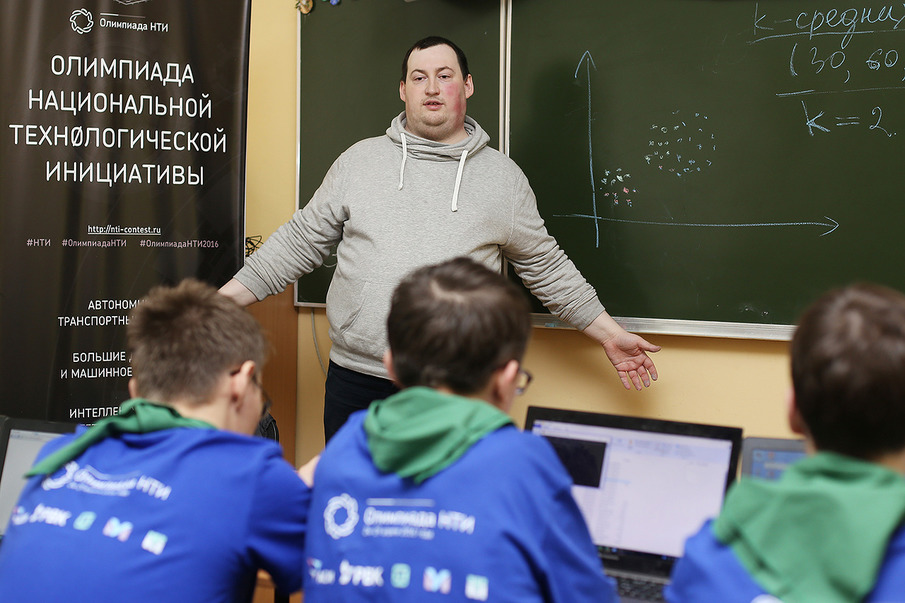
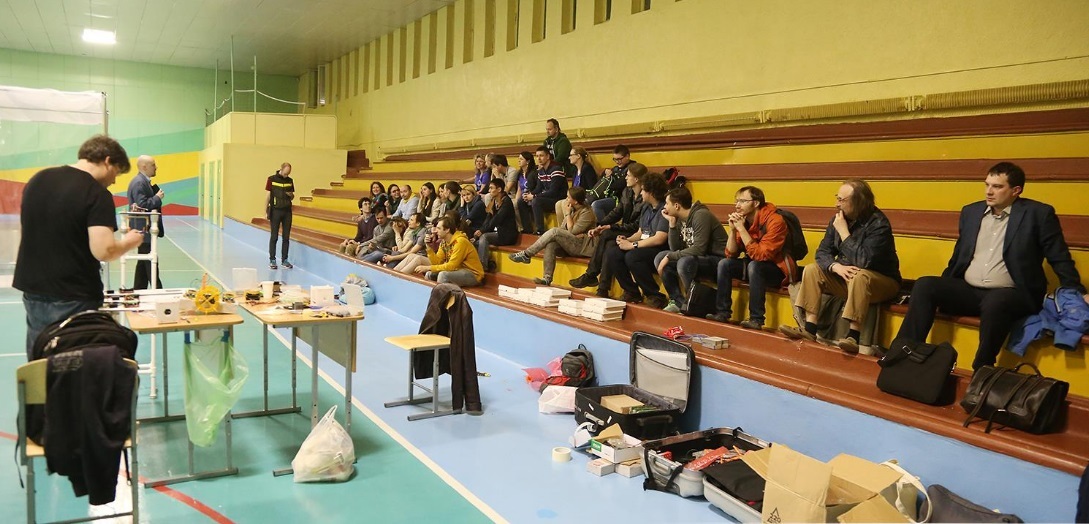
This is Ivan. He is big and kind. He read a python master class, talked about numerically crushers and what tasks a person performs better than a computer (belonging to a group, for example)
First qualifying stage
The first qualifying round is held individually on the Internet, works are automatically evaluated by means of an online testing system. To solve the problems of the first qualifying stage, participants were given 3 weeks. The solution to each problem gives a certain number of points. For all participants, a common set of tasks is offered, but for solving problems, participants at different levels (grade 9 or grade 10-11) were given different points. Points are credited in full for the correct solution of the problem. Participants receive a score for solving problems in the aggregate in all subjects of this profile (mathematics and computer science) - in total from 0 to 20 points.
Examples of tasks:
The math problem 1.1.6 (1 point)
Unlucky cosmonaut Innocent felt bad after the centrifuge and can not determine the direction, it is located 5 meters from the commission and moves in a straight line. Every second, with equal probability, he either approaches one meter to her, or moves away. If he reached the commission, then he no longer goes anywhere. Find the probability of falling into the hands of the commission no later than on the 10th second.
The task of computer science 1.2.2 "Roots" (3 points)
The boy Petya has the number N. But he does not need it, unlike the number X. To get it, Peter can take an integer root, multiply and add numbers.
The integer root of degree k from a natural number n is the greatest positive integer for which the relation is satisfied: For example, the fifth integer root of a thousand will be a triple, since
  Let's designate it as
  We also assume that the degree of the root can only be natural numbers.
For Petya, taking an integer root is a difficult task, and he wants to minimize the total degree of roots that are found in the formula for obtaining X.
Petit also has an older brother. Whose name is Dima. This Dima decided to add interest to Petit's problem, and to give such restrictions:
Help Petya to write an expression that will be easy to read and fits under the restrictions imposed by Dima. Find the minimal complexity of the expression you are looking for.
Input format:
The only line contains two integers N and X
Input example:
100 126
Output Format:
Print a single positive integer - the answer to the problem.
Example output:
9
Explanation of an example:
Work evaluation method
The following Python code is used to generate a unique condition and check the result. The generate function returns a condition condition and the correct answer:
First qualifying stage
The first qualifying round is held individually on the Internet, works are automatically evaluated by means of an online testing system. To solve the problems of the first qualifying stage, participants were given 3 weeks. The solution to each problem gives a certain number of points. For all participants, a common set of tasks is offered, but for solving problems, participants at different levels (grade 9 or grade 10-11) were given different points. Points are credited in full for the correct solution of the problem. Participants receive a score for solving problems in the aggregate in all subjects of this profile (mathematics and computer science) - in total from 0 to 20 points.
Examples of tasks:
The math problem 1.1.6 (1 point)
Unlucky cosmonaut Innocent felt bad after the centrifuge and can not determine the direction, it is located 5 meters from the commission and moves in a straight line. Every second, with equal probability, he either approaches one meter to her, or moves away. If he reached the commission, then he no longer goes anywhere. Find the probability of falling into the hands of the commission no later than on the 10th second.
Decision
Draw the path of the astronaut on the graph. On the vertical axis, set aside time, and on the horizontal distance. Initially, the astronaut is at s = 0, and the commission is at s = 5.
The figure shows the path for the sequence of PPLPP:
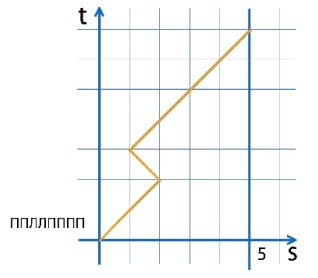
Note also that an astronaut can come to the commission only at odd steps.
Thus, we are interested in how many ways there are leading to the commission in 5, 7 and 9 seconds.
Let us reformulate the problem: how many paths exist, along the grid in the figure below, leading to the straight line s = 5. You can only walk up.
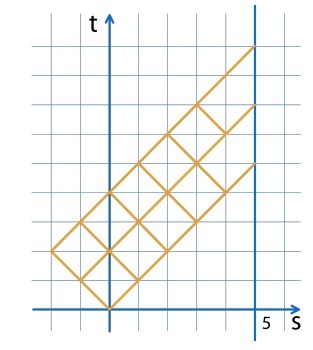
We calculate the number of such paths for each point, starting from the initial one.

In 5 steps it leads 1 way, in 7 - 5 ways, in 9 - 20 ways.
So the desired probability is 1/32 + 5/128 + 20/512 = 7/64
Answer: 7/64
The figure shows the path for the sequence of PPLPP:
Note also that an astronaut can come to the commission only at odd steps.
Thus, we are interested in how many ways there are leading to the commission in 5, 7 and 9 seconds.
Let us reformulate the problem: how many paths exist, along the grid in the figure below, leading to the straight line s = 5. You can only walk up.
We calculate the number of such paths for each point, starting from the initial one.
In 5 steps it leads 1 way, in 7 - 5 ways, in 9 - 20 ways.
So the desired probability is 1/32 + 5/128 + 20/512 = 7/64
Answer: 7/64
The task of computer science 1.2.2 "Roots" (3 points)
The boy Petya has the number N. But he does not need it, unlike the number X. To get it, Peter can take an integer root, multiply and add numbers.
The integer root of degree k from a natural number n is the greatest positive integer for which the relation is satisfied:
For example, the fifth integer root of a thousand will be a triple, since Let's designate it as We also assume that the degree of the root can only be natural numbers.For Petya, taking an integer root is a difficult task, and he wants to minimize the total degree of roots that are found in the formula for obtaining X.
Petit also has an older brother. Whose name is Dima. This Dima decided to add interest to Petit's problem, and to give such restrictions:
- Pety cannot take roots from numbers other than N.
- You can multiply only those numbers that Petya received by using the operation of taking the root or multiplying other numbers.
- You can add numbers that are obtained as a result of multiplication, taking the root or the sum of other numbers.
Help Petya to write an expression that will be easy to read and fits under the restrictions imposed by Dima. Find the minimal complexity of the expression you are looking for.
Input format:
The only line contains two integers N and X
Input example:
100 126
Output Format:
Print a single positive integer - the answer to the problem.
Example output:
9
Explanation of an example:
Work evaluation method
The following Python code is used to generate a unique condition and check the result. The generate function returns a condition condition and the correct answer:
def generate(): return [('{} {}\n'.format(n, x), ans) for n, x, ans in [ (100, 126, 9), (10, 10, 1), (1000, 1000, 1), (1, 1, 1), (1, 1000, 1000), (1000, 1, 10), (1000, 999, 17), (722, 966, 16), (774, 717, 21), (664, 177, 16), (655, 657, 7), (659, 65, 9), (901, 559, 21), (813, 314, 18), (528, 131, 16), (882, 258, 19), (516, 583, 12), (801, 767, 19), (147, 222, 11), (67, 743, 13), (413, 335, 21), (453, 467, 7), (600, 104, 9), (323, 209, 19), (462, 822, 18), (126, 743, 16), (77, 917, 17), (100, 999, 27), (1, 999, 999), (1000, 894, 29), (999, 712, 28), (123, 944, 24), (432, 277, 24), (945, 616, 28), (100, 999, 27), (1000, 894, 29), (999, 712, 28), (123, 944, 24), (432, 277, 24), (945, 616, 28) ]] def check(reply, clue): return int(reply.strip()) == int(clue) Decision
The solution consists of three stages. At the first stage you need to make a set of degrees and roots of N, which can be advantageous to use. If two roots with different degrees are equal, then it is advantageous for us to use one of them, the degree of which is less. Since 210> 1000, then for any N there will be at most 11 different roots. At the second stage, using the dynamic programming method, we obtain a list of numbers that can be obtained by multiplying the roots with an optimal total degree. At the third stage, using the same method, we obtain a list of numbers that can be obtained by adding the numbers from the previous stage with the optimal amounts.
An example of a program that implements this algorithm in Python:
An example of a program that implements this algorithm in Python:
1. import sys 2. 3. INF = int(1e9) 4. 5. def getRoots(n, mx): 6. ans = [INF, n] 7. for x in range(n, 1, -1): 8. while x ** len(ans) <= n: 9. ans.append(x) 10. ans.append(1) 11. roots = dict() 12. for i in range(len(ans)): 13. if ans[i] != ans[i - 1] and ans[i] <= mx: 14. roots[ans[i]] = i 15. return roots 16. 17. def getProducts(roots, mx): 18. ans = dict() 19. ans[1] = 0 20. for i in range(2, mx + 1): 21. ans[i] = INF 22. for k, v in roots.items(): 23. if i % k == 0: 24. d = i // k 25. if d in ans and ans[d] + v < ans[i]: 26. ans[i] = ans[d] + v 27. if ans[i] == INF: 28. ans.pop(i, None) 29. ans[1] = roots[1] 30. prods = [(k, v) for k, v in sorted(ans.items())] 31. return prods 32. 33. def getSums(prods, mx): 34. ans = [INF] * (mx + 1) 35. ans[0] = 0 36. for i in range(len(ans)): 37. for k, v in prods: 38. if k > i: 39. break 40. if ans[i - k] + v < ans[i]: 41. ans[i] = ans[i - k] + v 42. ans[0] = INF 43. return ans 44. 45. def solve(dataset): 46. n, x = list(map(int, dataset.strip().split())) 47. roots = getRoots(n, x); 48. prods = getProducts(roots, x) 49. ans = getSums(prods, x) 50. return str(ans[x]) 51. 52. solve(sys.stdin.read()) Second qualifying stage
The second qualifying stage is carried out in a team format on the Internet, works are evaluated automatically by means of an online testing system. The duration of the second qualifying stage is 2 weeks. Tasks are interdisciplinary.
and in a simpler form, they recreate the engineering task of the final stage. Problem solving involved writing programs, it was allowed to use the Python programming language. The solution to each problem gives a certain number of points. At this stage, you can get a total of 0 to 45 points.
Problem 2.1.1 (10 points)
In the summer camp came 1000 schoolchildren. When the student came, he was immediately copied (they put the serial number starting from zero - how the student came to the camp). Schoolchildren were immediately smashed into detachments with different numbers of people in the detachment:
the first n1 schoolchildren were identified in the first squad, the next n2 schoolchildren in the second squad, the next n3 in the third and so on.
Once all the even-numbered detachments were taken away on a tour. And the commission arrived at the camp and rewrote all the schoolchildren who remained (each schoolchild named the number as recorded when he arrived at the camp). By mistake, some students rewrote several times. How now to figure out which schoolchild in which unit?
At the entrance is an array of numbers corresponding to the sequence numbers of the copied students who remained in the camp.
The output is a set of pairs of numbers: the ordinal number of the first and final pupils in the first squad, the ordinal numbers of the first and final pupils in the second squad, and so on.
For the successful solution of the problem, participants receive 10 points.
Input example:
790 443 801 518 63 75 491 91… 420 371 89 389 453 488 892 932
Example output:
[(0, 92), (93, 343), (344, 521), (522, 772), (773, 999)]
Program execution time limit: 15 s
Restriction on the use of RAM: 256 MB
The solution is here on page 174 .
Problem 2.1.2 (15 points)
For each city, the cartographer compiled a list of cities with which he is associated.
by roads. Now he is asked whether it is possible to pass between two distant
cities.
At the entrance serves two city names that need to be checked and then goes
listing for cities with which other cities it is connected by road. Answer is needed
give in true and false format.
For the successful solution of the problem participants receive 15 points.
Input example:
{'find': ('d', 'f'), 'd': ['a', 'b', 'c', 'e', 'f', 'g'], 'b': [ 'a', 'c',
'd', 'e', 'f', 'g'], 'q': ['n', 'o', 'p', 'r', 's', 't', 'u'] , 'f': ['a', 'b',
'c', 'd', 'e', 'g'], 'a': ['b', 'c', 'd', 'e', 'f', 'g'], 's' : ['n', 'o', 'p',
'q', 'r', 't', 'u', 'c'], 'e': ['a', 'b', 'c', 'd', 'f', 'g'] , 'u': ['n', 'o',
'p', 'q', 'r', 's', 't'], 'r': ['n', 'o', 'p', 'q', 's', 't', 'u'], 'p': ['n',
'o', 'q', 'r', 's', 't', 'u'], 'c': ['a', 'b', 'd', 'e', 'f', 'g'], 'g': ['a',
'b', 'c', 'd', 'e', 'f'], 'o': ['n', 'p', 'q', 'r', 's', 't', 'u'], 'n': ['o',
'p', 'q', 'r', 's', 't', 'u'], 't': ['n', 'o', 'p', 'q', 'r', 's', 'u']}
Program execution time limit: 3000 s
Restriction on the use of RAM: 256 MB
The solution is here on page 178 .
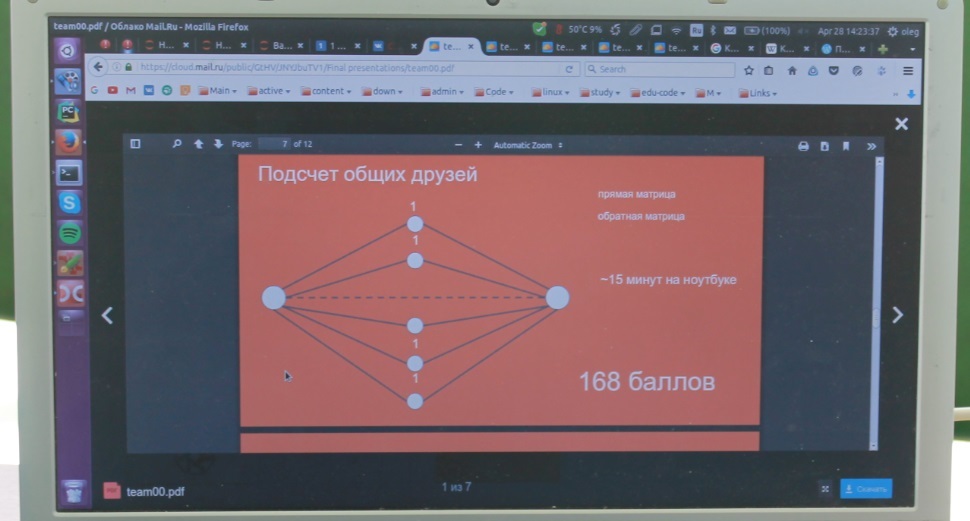
Problem 2.1.3 (0-20 points)
The task features the social network graph we have invented (for each user it is indicated which users added him as a friend). For each user, his popularity is calculated, it is based on how many people are friends with the users with whom he is friends.
Popularity is calculated as X - the total number of people who are friends with his friends, considering him.
It is necessary to calculate two percentile 50 and 90, i.e. the two lowest popularity values are such that with a probability of 50% for the first and 90% for the second, the random user’s popularity will be less than this value.
The task must be solved on my computer and in the system to load the solution in the form of two numbers for each task.
If for all the tests you calculated at least a percentile of 50 (with a probability of 50 percent of the popularity will be less), then you get half the points from the task.
Input example:
[{0: [5, 8], 1: [7, 2], 2: [8], 3: [10, 0], 4: [0, 10, 2, 1], 5: [1, 5 ,
3, 7], 6: [7, 3, 0], 7: [12, 13, 0, 8], 8: [8, 11], 9: [6, 2, 13], 10: [13] , eleven:
[2, 0, 8], 12: [0, 13], 13: [4, 11, 8], 14: [0, 4, 12, 2]}, {0: [14, 11], 1: [7,
14, 1], 2: [0], 3: [10], 4: [13], 5: [8, 0], 6: [5, 3], 7: [2, 11, 8, 10] , eight:
[3, 10, 14, 7], 9: [0, 11, 7, 4], 10: [1, 7], 11: [10, 5, 12, 4], 12: [14, 5],
13: [7, 6, 3, 1], 14: [10, 6, 0, 8]}]
Example output:
[(4, 6), (7, 9)]
Restriction on the use of RAM: 256 MB
Time one attempt: 5 min
The solution is here on page 186 .
Second qualifying stage
The second qualifying stage is carried out in a team format on the Internet, works are evaluated automatically by means of an online testing system. The duration of the second qualifying stage is 2 weeks. Tasks are interdisciplinary.
and in a simpler form, they recreate the engineering task of the final stage. Problem solving involved writing programs, it was allowed to use the Python programming language. The solution to each problem gives a certain number of points. At this stage, you can get a total of 0 to 45 points.
Tasks for data analysis
Problem 2.1.1 (10 points)
In the summer camp came 1000 schoolchildren. When the student came, he was immediately copied (they put the serial number starting from zero - how the student came to the camp). Schoolchildren were immediately smashed into detachments with different numbers of people in the detachment:
the first n1 schoolchildren were identified in the first squad, the next n2 schoolchildren in the second squad, the next n3 in the third and so on.
Once all the even-numbered detachments were taken away on a tour. And the commission arrived at the camp and rewrote all the schoolchildren who remained (each schoolchild named the number as recorded when he arrived at the camp). By mistake, some students rewrote several times. How now to figure out which schoolchild in which unit?
At the entrance is an array of numbers corresponding to the sequence numbers of the copied students who remained in the camp.
The output is a set of pairs of numbers: the ordinal number of the first and final pupils in the first squad, the ordinal numbers of the first and final pupils in the second squad, and so on.
For the successful solution of the problem, participants receive 10 points.
Input example:
790 443 801 518 63 75 491 91… 420 371 89 389 453 488 892 932
Example output:
[(0, 92), (93, 343), (344, 521), (522, 772), (773, 999)]
Program execution time limit: 15 s
Restriction on the use of RAM: 256 MB
The solution is here on page 174 .
Problem 2.1.2 (15 points)
For each city, the cartographer compiled a list of cities with which he is associated.
by roads. Now he is asked whether it is possible to pass between two distant
cities.
At the entrance serves two city names that need to be checked and then goes
listing for cities with which other cities it is connected by road. Answer is needed
give in true and false format.
For the successful solution of the problem participants receive 15 points.
Input example:
{'find': ('d', 'f'), 'd': ['a', 'b', 'c', 'e', 'f', 'g'], 'b': [ 'a', 'c',
'd', 'e', 'f', 'g'], 'q': ['n', 'o', 'p', 'r', 's', 't', 'u'] , 'f': ['a', 'b',
'c', 'd', 'e', 'g'], 'a': ['b', 'c', 'd', 'e', 'f', 'g'], 's' : ['n', 'o', 'p',
'q', 'r', 't', 'u', 'c'], 'e': ['a', 'b', 'c', 'd', 'f', 'g'] , 'u': ['n', 'o',
'p', 'q', 'r', 's', 't'], 'r': ['n', 'o', 'p', 'q', 's', 't', 'u'], 'p': ['n',
'o', 'q', 'r', 's', 't', 'u'], 'c': ['a', 'b', 'd', 'e', 'f', 'g'], 'g': ['a',
'b', 'c', 'd', 'e', 'f'], 'o': ['n', 'p', 'q', 'r', 's', 't', 'u'], 'n': ['o',
'p', 'q', 'r', 's', 't', 'u'], 't': ['n', 'o', 'p', 'q', 'r', 's', 'u']}
Program execution time limit: 3000 s
Restriction on the use of RAM: 256 MB
The solution is here on page 178 .
Problem 2.1.3 (0-20 points)
The task features the social network graph we have invented (for each user it is indicated which users added him as a friend). For each user, his popularity is calculated, it is based on how many people are friends with the users with whom he is friends.
Popularity is calculated as X - the total number of people who are friends with his friends, considering him.
It is necessary to calculate two percentile 50 and 90, i.e. the two lowest popularity values are such that with a probability of 50% for the first and 90% for the second, the random user’s popularity will be less than this value.
The task must be solved on my computer and in the system to load the solution in the form of two numbers for each task.
If for all the tests you calculated at least a percentile of 50 (with a probability of 50 percent of the popularity will be less), then you get half the points from the task.
Input example:
[{0: [5, 8], 1: [7, 2], 2: [8], 3: [10, 0], 4: [0, 10, 2, 1], 5: [1, 5 ,
3, 7], 6: [7, 3, 0], 7: [12, 13, 0, 8], 8: [8, 11], 9: [6, 2, 13], 10: [13] , eleven:
[2, 0, 8], 12: [0, 13], 13: [4, 11, 8], 14: [0, 4, 12, 2]}, {0: [14, 11], 1: [7,
14, 1], 2: [0], 3: [10], 4: [13], 5: [8, 0], 6: [5, 3], 7: [2, 11, 8, 10] , eight:
[3, 10, 14, 7], 9: [0, 11, 7, 4], 10: [1, 7], 11: [10, 5, 12, 4], 12: [14, 5],
13: [7, 6, 3, 1], 14: [10, 6, 0, 8]}]
Example output:
[(4, 6), (7, 9)]
Restriction on the use of RAM: 256 MB
Time one attempt: 5 min
The solution is here on page 186 .
The final stage
And this is the schoolchildren, whom he repeatedlywon in football, met in the GOTO camps and on the hackathon .
The final stage of the Olympiad consists of two parts: an individual solution of problems in subjects (mathematics, computer science) and a team decision engineering problem. For an individual solution of the problems is given for 2 hours on one subject. Problems in mathematics and computer science are common to parallels grade 9 and 10-11. The solution to each problem gives a certain number of points (see evaluation criteria below). In mathematics for each task you can get from 0 to the specified number of points in accordance with the described criteria.
Informatics points are credited in full for the correct solution of the problem.
Solving computer science tasks involved writing tasks in Python. Participants receive a score for solving problems in the aggregate in all subjects of this profile (mathematics and computer science) - in total from 0 to 24 points.
Maths task 3.1.1v (2 points).
A group of psychologists has developed a test, having passed that, each person receives an assessment - the number Q is an indicator of his mental abilities (the more Q, the more abilities). The country’s rating is taken as the arithmetic average of the Q values of all the inhabitants of this country.
The group of citizens of country A emigrated to country B, and the group of citizens of B - to country B. As a result, the ratings of each country were higher than the initial ones. After that, the direction of migration flows changed to the opposite - some of the inhabitants of B moved to B, and some of the inhabitants of B - to A. It turned out that as a result, the ratings of all three countries increased again (compared to those that were after the first move, but before second). (So, in any case, the news agencies of these countries claim.) Could this be (if so, how, if not, why)? (It is assumed that during the considered time Q citizens did not change, no one died or was born.)
Math Problem 3.1.2 (6 points)
The administration of the social network VKontakte decided to create a community "All those who have less than half of their friends are in this community." To do this, they need to be included in the user community so that in the end:
Do they always manage to create such a community?
(It is assumed that users do not themselves join the community, but are distributed by the administration of the social network)
The solution is here on page 191 .
The task of computer science 3.2.4 "Final certification" (3 points)
The end of the year is a hectic time not only for schoolchildren who are preparing for exams, but also for the compilers of the exam tasks. When composing any test, it is necessary to take into account how difficult the task will be for students, and determine how many students will pass the test successfully.
This year it was decided to hold a test exam, inviting 100 students from different schools to solve 5 problems. Each task is scored ai points. The problem is either solved for a full score, or not solved at all, which means points are not awarded for it. Partial decisions are not taken into account. After the exam, the compilers received the results of the students. For each student, the results of testing all tasks are known.
You must calculate how many students will receive at least K points if the exam will pass 1,000,000 students.
Please note that it is impossible to reliably find the probability to solve a specific set of problems, but we will assume that it is possible to reliably estimate the probability to solve one problem.
Input format:
The first line contains the number K - the number of points needed to pass the test. The second line of 5 natural numbers - points for the problem. The first number corresponds to the points for the first task, the second - for the second and so on. This is followed by 100 lines. Each line contains 5 numbers indicating whether the corresponding problem is solved by number or not. In the first place, the line indicates whether the first task is solved, if the second one is solved, and so on. If the problem is solved, then the line will contain 1, if not - 0.
Output Format:
In a single line print the expected number of people who successfully pass the same test if it is solved by 1,000,000 schoolchildren.
The solution is here on page 200 .

Formulation of the problem.
The participants in the command part of the final stage needed to solve a series of tasks on analyzing the graph of social network users: predict the age of users who did not indicate it in their profile; predict the region of residence of the user; guess who of the other users of the social network is familiar to the user.
Participants had to write programs in the Python language. The duration of the command part of the final stage is 3 days (18 astronomical hours in total). Participants had access to the Internet and could use their phones and laptops.
All teams were offered 3 tasks - one for each day. The condition of the problem became known to the participants in the morning of the corresponding day. For each task, two subgraphs of the real Odnoklassniki social network were prepared:
For each task, the participants were provided with a working basic solution with low efficiency, and the participants were faced with a choice: to program their own solution from scratch, which could solve the posed problem more qualitatively, or refine the proposed solution. In this case, it was possible to use the basic solution in part, for example, only the data model or only the input data recognizer.
Description of the source data
In all tasks, the participants were provided with a user graph (links between users) and a file with demographics (anonymized data for each user).
User graph
The graph is saved in a sparse matrix format, where for each link there is information about its type (relative, friend, etc.) in the form of a bit mask. Each row of the matrix corresponds to the friends of one user and has the format:
User_ID1 {(ID_druga1, mask1), (ID_druga2, mask2), ...}
The matrix is partitioned by user ID into 16 files, each of which is compressed with the standard GZip compression protocol.
Pairs in the list of links are sorted by friend ID (ascending). Example of records from the graph:
102416
{(5362439.0), (7321627.0), (7345280.0), (9939258.0), (9976393.0), (11260492.0),
(11924364.0), (16498676.0), (16513827.0), (21716731.0), (21826340.0), (23746537.0),
(23751503.0), (24412936.0), (24423533.0), (30287856.0), (32321147.0), (34243036.0),
(37592142.0), (39485706.0), (41505243.0), (42791620.0), (52012206.0), (52671472.0),
(54652307.0), (57293803.0), (59242794.0), (59252048.0), (62535397.0), (62563866.0),
(62567154.0), (64588902.0)}
102608
{(4167808,32784), (6019974.322), (6152844.16), (9570536.64), (10699806.33),
(13290514.0), (15064491,128), (16432948.512), (24473204.0), (24655822.0),
(25833075,256), (28000951.64), (30834507.20048), (34567533,16), (35766667.0),
(37385121.0), (40123805.512), (43134386.1024), (45439608.0), (45484652.0),
(47562525.0), (52378153.256), (52403136.512), (52493894.1024), (53483990.0),
(54048767.0), (54286279.20048), (57401158.0), (57956631.0), (58183281.0),
(61117236,32), (61898065.0), (61936634.0), (64512205.512), (65014849.0),
(65112662.0), (65259449.0)}
The following bits can be set in the communication mask:
In addition to the listed bits in the relationship mask, the zero bit may or may not be set. This bit plays a purely technical role and has no physical meaning. As a result, for example, a child type relationship can be encoded with the numbers 16 or 17.
The data were prepared using the Apache Pig big data storage tool and contain two matching files with headers that allow participants to use this tool for preprocessing / filtering data.
User demographics
Demographic data is provided for the same million users as social link information in the attribute list format:
userId create_date birth_date gender ID_country ID_Location loginRegion
Where:
Sample data:
44053078 1166032023073 3067 1 10414533690 2423601 99
12495764 1177932393270 1138
2 10405172143 188081
25646929 1165304175170 3756 2 10414533690 3953941 22
25646999 1160728984480 3884 2 10414533690 241372 120
12495833 1176909723643 3363 2 10414533690 2724941 11
Demography is partitioned in the same way as the graph, but not compressed (transmitted as open texts). It can also be processed using the standard Apache Pig big data storage tool or any other tool that supports CSV.
Task 4.2.1 "Date of birth"
The fragment of the social graph presented for analysis includes information about the connections of 100 thousand users who have fallen into the two-step neighborhood of hundreds of randomly selected users. Participants are provided with social network graph files with all links and a demography file, which contains data on users, including age, but not all users are age specified.
For users who are present in the graph, but not present in the demographics, you must set the value of their birth_date attribute (date of birth).
Data is written to the file in the format:
(<polzator_id> \ t (tab) <birth_date>)
The calculated results of the participants are taken in the txt file and compared with the complete data by a specially written program that considers the discrepancy between the data of the participants and the real data. The smaller the discrepancy, the higher the team score.
The basic solution of the problem on page 208 .
Task 4.2.2 “Region”
The fragment of the social graph presented for analysis includes information about the connections of 100 thousand users who have fallen into the two-step neighborhood of hundreds of randomly selected users. Participants are provided with social network graph files with all links and a demography file, which contains data on users, including the region, but the region is not specified for all users.
For users who are present in the graph, but not present in the demographics, you must set their ID_Location attribute (region).
The answer is recorded in a text file in the format:
(<user_id> \ t (tab) <ID_Location>)
The calculated results of the participants are taken in the txt file and compared with the complete data by a specially written program that considers the discrepancy between the data of the participants and the real data. The smaller the discrepancy, the higher the team score.
The basic solution of the problem on page 213 .
Task 4.2.3 “Finding Connections”
The fragment of the social graph presented for analysis includes information about the connections of 1 million users, which fell into the two-step neighborhood of hundreds of randomly selected users. Participants are provided with graph and demography files by users. Some of the links in the social box provided are hidden and the task of the participants is to fully and accurately disclose them.
Hiding links affected only users from the original million, the remainder of dividing attributes whose ID by 11 is 7 (id% 11 == 7), about 10% of links for each of these users were hidden. Only the links to the original million were hidden.
In the forecast, it is enough to restore the presence of a connection, its type is not important. The results of the forecast must be presented in a CSV file of the form:
ID_1 ID_1.1 ID_1.2 ID_1.3
ID_2 ID_2.1 ID_2.2
ID ( ), ( , ). :
5111 178542 78754
18807 982346 1346 57243
(Normalized Discounted Cumulative Gain, NDCG), . , , . ,
, . - , 0.
216 .
Final stage: individual and command parts
And this is the schoolchildren, whom he repeatedly
The final stage of the Olympiad consists of two parts: an individual solution of problems in subjects (mathematics, computer science) and a team decision engineering problem. For an individual solution of the problems is given for 2 hours on one subject. Problems in mathematics and computer science are common to parallels grade 9 and 10-11. The solution to each problem gives a certain number of points (see evaluation criteria below). In mathematics for each task you can get from 0 to the specified number of points in accordance with the described criteria.
Informatics points are credited in full for the correct solution of the problem.
Solving computer science tasks involved writing tasks in Python. Participants receive a score for solving problems in the aggregate in all subjects of this profile (mathematics and computer science) - in total from 0 to 24 points.
Maths task 3.1.1v (2 points).
A group of psychologists has developed a test, having passed that, each person receives an assessment - the number Q is an indicator of his mental abilities (the more Q, the more abilities). The country’s rating is taken as the arithmetic average of the Q values of all the inhabitants of this country.
The group of citizens of country A emigrated to country B, and the group of citizens of B - to country B. As a result, the ratings of each country were higher than the initial ones. After that, the direction of migration flows changed to the opposite - some of the inhabitants of B moved to B, and some of the inhabitants of B - to A. It turned out that as a result, the ratings of all three countries increased again (compared to those that were after the first move, but before second). (So, in any case, the news agencies of these countries claim.) Could this be (if so, how, if not, why)? (It is assumed that during the considered time Q citizens did not change, no one died or was born.)
Math Problem 3.1.2 (6 points)
The administration of the social network VKontakte decided to create a community "All those who have less than half of their friends are in this community." To do this, they need to be included in the user community so that in the end:
- everyone in this community has less than half the friends in it;
- everyone who is not in this community has at least half of the friends in it.
Do they always manage to create such a community?
(It is assumed that users do not themselves join the community, but are distributed by the administration of the social network)
The solution is here on page 191 .
The task of computer science 3.2.4 "Final certification" (3 points)
The end of the year is a hectic time not only for schoolchildren who are preparing for exams, but also for the compilers of the exam tasks. When composing any test, it is necessary to take into account how difficult the task will be for students, and determine how many students will pass the test successfully.
This year it was decided to hold a test exam, inviting 100 students from different schools to solve 5 problems. Each task is scored ai points. The problem is either solved for a full score, or not solved at all, which means points are not awarded for it. Partial decisions are not taken into account. After the exam, the compilers received the results of the students. For each student, the results of testing all tasks are known.
You must calculate how many students will receive at least K points if the exam will pass 1,000,000 students.
Please note that it is impossible to reliably find the probability to solve a specific set of problems, but we will assume that it is possible to reliably estimate the probability to solve one problem.
Input format:
The first line contains the number K - the number of points needed to pass the test. The second line of 5 natural numbers - points for the problem. The first number corresponds to the points for the first task, the second - for the second and so on. This is followed by 100 lines. Each line contains 5 numbers indicating whether the corresponding problem is solved by number or not. In the first place, the line indicates whether the first task is solved, if the second one is solved, and so on. If the problem is solved, then the line will contain 1, if not - 0.
Output Format:
In a single line print the expected number of people who successfully pass the same test if it is solved by 1,000,000 schoolchildren.
The solution is here on page 200 .
Command part
Formulation of the problem.
The participants in the command part of the final stage needed to solve a series of tasks on analyzing the graph of social network users: predict the age of users who did not indicate it in their profile; predict the region of residence of the user; guess who of the other users of the social network is familiar to the user.
Participants had to write programs in the Python language. The duration of the command part of the final stage is 3 days (18 astronomical hours in total). Participants had access to the Internet and could use their phones and laptops.
All teams were offered 3 tasks - one for each day. The condition of the problem became known to the participants in the morning of the corresponding day. For each task, two subgraphs of the real Odnoklassniki social network were prepared:
- the participants were presented with a specially prepared, purified and anonymized subgraph;
- The quality check of the solution was carried out automatically on the full graph, in which there were data cleared from the first graph.
For each task, the participants were provided with a working basic solution with low efficiency, and the participants were faced with a choice: to program their own solution from scratch, which could solve the posed problem more qualitatively, or refine the proposed solution. In this case, it was possible to use the basic solution in part, for example, only the data model or only the input data recognizer.
Description of the source data
In all tasks, the participants were provided with a user graph (links between users) and a file with demographics (anonymized data for each user).
User graph
The graph is saved in a sparse matrix format, where for each link there is information about its type (relative, friend, etc.) in the form of a bit mask. Each row of the matrix corresponds to the friends of one user and has the format:
User_ID1 {(ID_druga1, mask1), (ID_druga2, mask2), ...}
The matrix is partitioned by user ID into 16 files, each of which is compressed with the standard GZip compression protocol.
Pairs in the list of links are sorted by friend ID (ascending). Example of records from the graph:
102416
{(5362439.0), (7321627.0), (7345280.0), (9939258.0), (9976393.0), (11260492.0),
(11924364.0), (16498676.0), (16513827.0), (21716731.0), (21826340.0), (23746537.0),
(23751503.0), (24412936.0), (24423533.0), (30287856.0), (32321147.0), (34243036.0),
(37592142.0), (39485706.0), (41505243.0), (42791620.0), (52012206.0), (52671472.0),
(54652307.0), (57293803.0), (59242794.0), (59252048.0), (62535397.0), (62563866.0),
(62567154.0), (64588902.0)}
102608
{(4167808,32784), (6019974.322), (6152844.16), (9570536.64), (10699806.33),
(13290514.0), (15064491,128), (16432948.512), (24473204.0), (24655822.0),
(25833075,256), (28000951.64), (30834507.20048), (34567533,16), (35766667.0),
(37385121.0), (40123805.512), (43134386.1024), (45439608.0), (45484652.0),
(47562525.0), (52378153.256), (52403136.512), (52493894.1024), (53483990.0),
(54048767.0), (54286279.20048), (57401158.0), (57956631.0), (58183281.0),
(61117236,32), (61898065.0), (61936634.0), (64512205.512), (65014849.0),
(65112662.0), (65259449.0)}
The following bits can be set in the communication mask:
- Love
- Spouse or Spouse
- Parent
- Child
- Brother or sister
- Uncle or aunt
- Relatives
- Close friends
- Colleagues
- Classmates
- Nephew
- Grandfather or grandmother
- Grandchild or granddaughter
- Classmate
- Army Friendship
- Adoptive parent
- Adopted child
- Godfather
- Godson
- Playing sports games together
In addition to the listed bits in the relationship mask, the zero bit may or may not be set. This bit plays a purely technical role and has no physical meaning. As a result, for example, a child type relationship can be encoded with the numbers 16 or 17.
The data were prepared using the Apache Pig big data storage tool and contain two matching files with headers that allow participants to use this tool for preprocessing / filtering data.
User demographics
Demographic data is provided for the same million users as social link information in the attribute list format:
userId create_date birth_date gender ID_country ID_Location loginRegion
Where:
- userId - user ID
- create_date - the date of creation of the user account (the number of milliseconds from 01/01/1970)
- birth_date - user’s birth date (number of days as of 01/01/1970, may be negative!)
- gender - user gender (1 - men, 2 - women)
- ID_country - identifier of the country specified in the profile
- ID_Location - the region / city identifier specified in the profile.
- loginRegion - identifier of the region from which the user is most often authorized in this social network (may be absent!)
Sample data:
44053078 1166032023073 3067 1 10414533690 2423601 99
12495764 1177932393270 1138
2 10405172143 188081
25646929 1165304175170 3756 2 10414533690 3953941 22
25646999 1160728984480 3884 2 10414533690 241372 120
12495833 1176909723643 3363 2 10414533690 2724941 11
Demography is partitioned in the same way as the graph, but not compressed (transmitted as open texts). It can also be processed using the standard Apache Pig big data storage tool or any other tool that supports CSV.
Tasks
Task 4.2.1 "Date of birth"
The fragment of the social graph presented for analysis includes information about the connections of 100 thousand users who have fallen into the two-step neighborhood of hundreds of randomly selected users. Participants are provided with social network graph files with all links and a demography file, which contains data on users, including age, but not all users are age specified.
For users who are present in the graph, but not present in the demographics, you must set the value of their birth_date attribute (date of birth).
Data is written to the file in the format:
(<polzator_id> \ t (tab) <birth_date>)
The calculated results of the participants are taken in the txt file and compared with the complete data by a specially written program that considers the discrepancy between the data of the participants and the real data. The smaller the discrepancy, the higher the team score.
The basic solution of the problem on page 208 .
Task 4.2.2 “Region”
The fragment of the social graph presented for analysis includes information about the connections of 100 thousand users who have fallen into the two-step neighborhood of hundreds of randomly selected users. Participants are provided with social network graph files with all links and a demography file, which contains data on users, including the region, but the region is not specified for all users.
For users who are present in the graph, but not present in the demographics, you must set their ID_Location attribute (region).
The answer is recorded in a text file in the format:
(<user_id> \ t (tab) <ID_Location>)
The calculated results of the participants are taken in the txt file and compared with the complete data by a specially written program that considers the discrepancy between the data of the participants and the real data. The smaller the discrepancy, the higher the team score.
The basic solution of the problem on page 213 .
Task 4.2.3 “Finding Connections”
The fragment of the social graph presented for analysis includes information about the connections of 1 million users, which fell into the two-step neighborhood of hundreds of randomly selected users. Participants are provided with graph and demography files by users. Some of the links in the social box provided are hidden and the task of the participants is to fully and accurately disclose them.
Hiding links affected only users from the original million, the remainder of dividing attributes whose ID by 11 is 7 (id% 11 == 7), about 10% of links for each of these users were hidden. Only the links to the original million were hidden.
In the forecast, it is enough to restore the presence of a connection, its type is not important. The results of the forecast must be presented in a CSV file of the form:
ID_1 ID_1.1 ID_1.2 ID_1.3
ID_2 ID_2.1 ID_2.2
ID ( ), ( , ). :
5111 178542 78754
18807 982346 1346 57243
(Normalized Discounted Cumulative Gain, NDCG), . , , . ,
, . - , 0.
216 .
How would I build a consistent ontology?
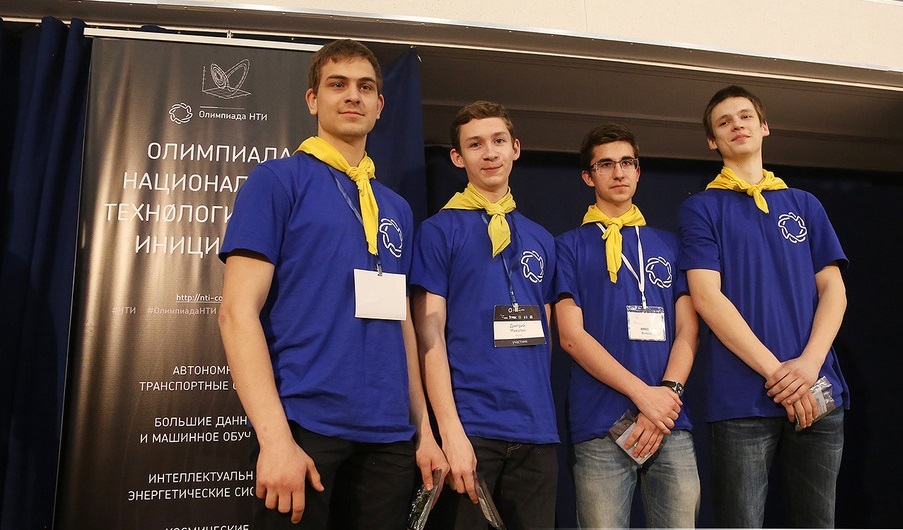
The winners are the “Mathematical expectation” team.
- Zhidkov Vsevolod, MBOU "Votkinsky Lyceum" (Votkinsk), Grade 8
- Vladimir Tatosyan, GBOU Lyceum №1568 them. Pablo Neruda (Moscow), Grade 9
- Shekhirin Alexey, MBOU gymnasium №21 (Arkhangelsk), Grade 9
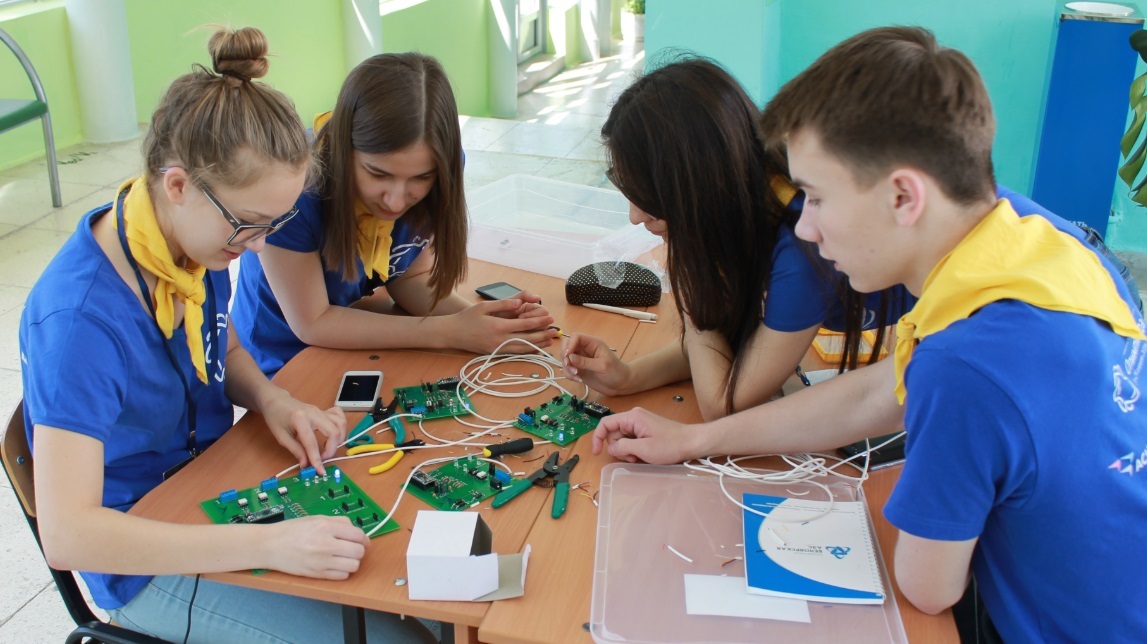
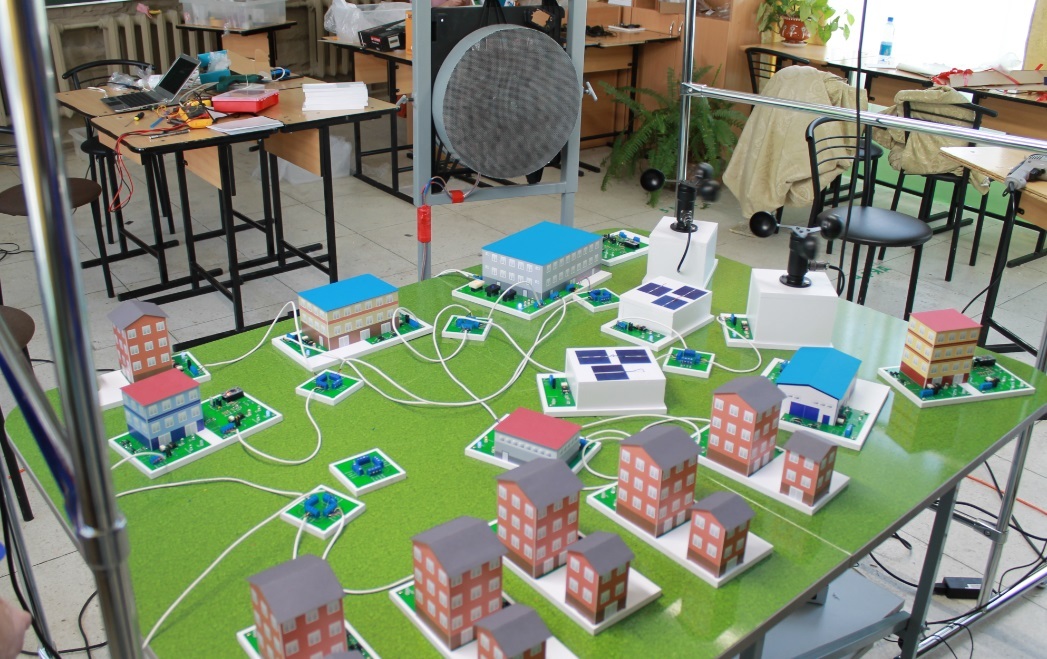
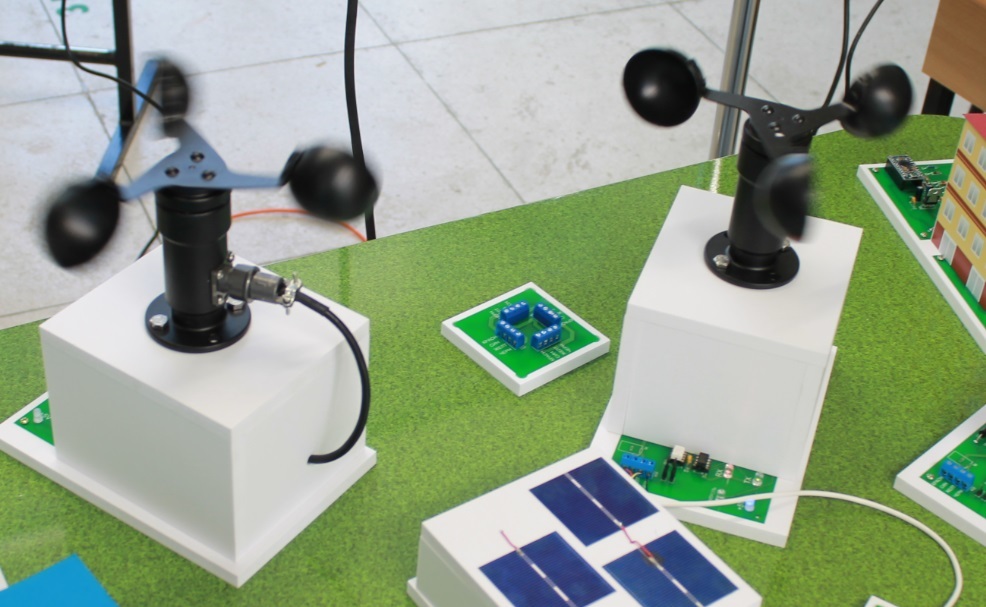
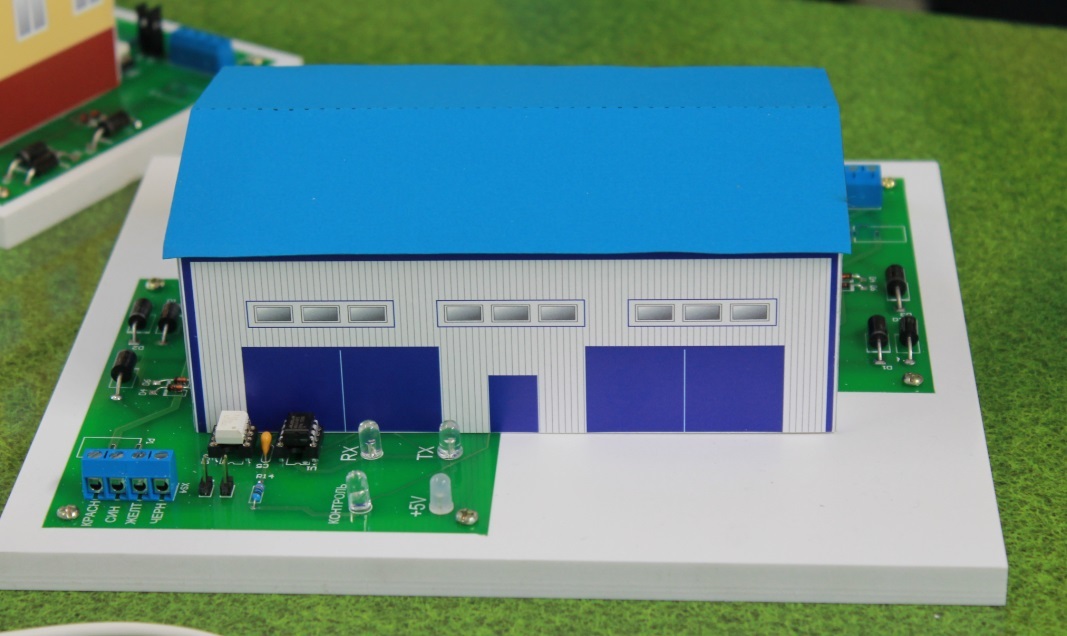
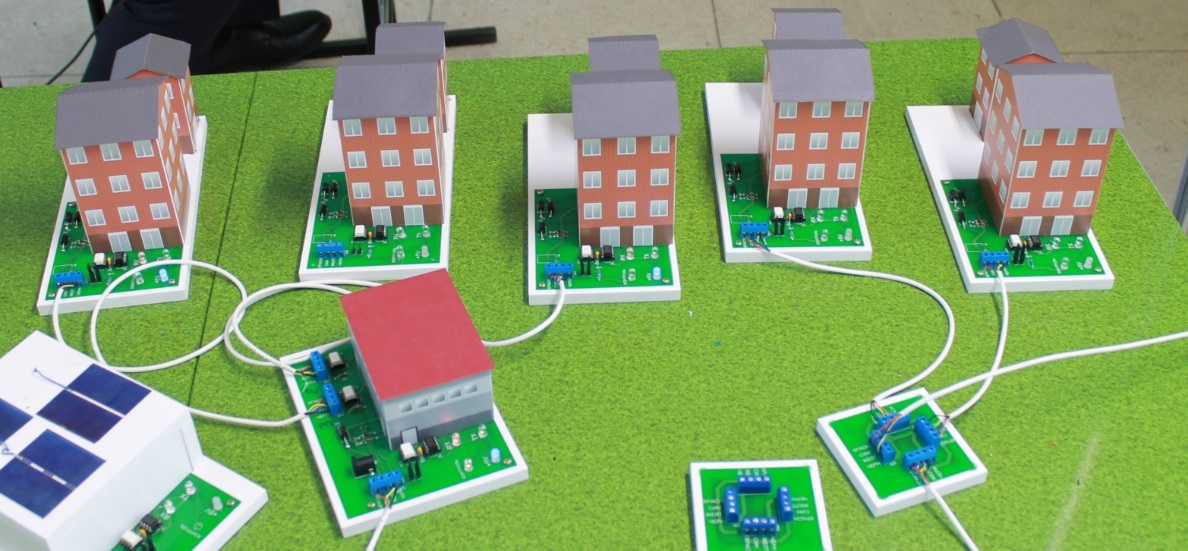
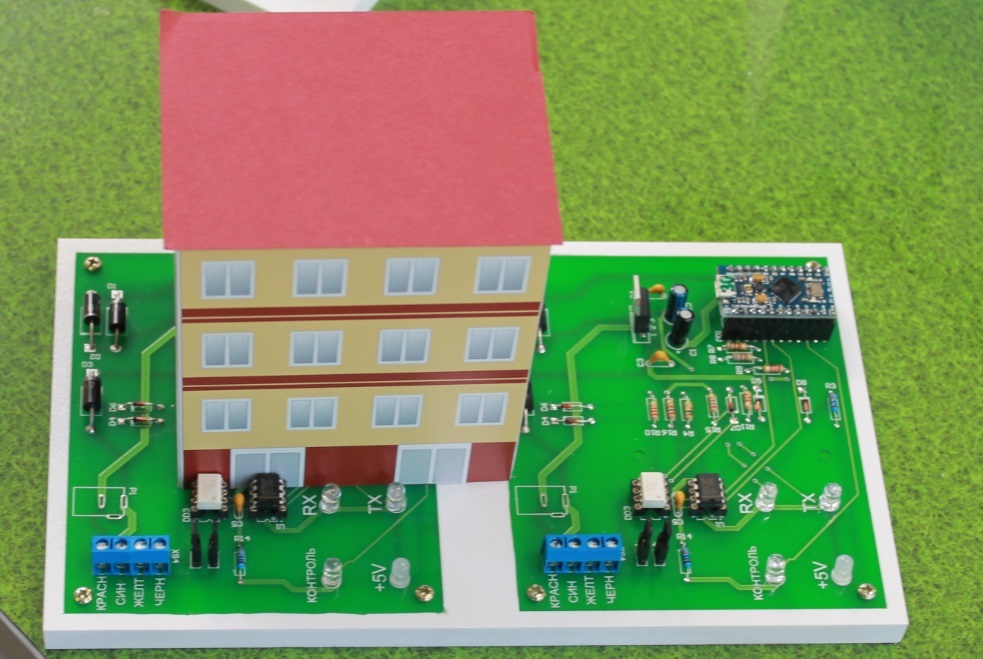
Intelligent Energy Systems
“And we will unexpectedly turn off the central power transmission line for them later”
- the organizers
First qualifying stage
, -. (9 10-11 ) , . 3 . . . ( ) — 0 20 .
1.3.4 (5 )
0˚ 180˚ . ( ) 100 , ( ) — 500 . , .
, .
, -. (9 10-11 ) , . 3 . . . ( ) — 0 20 .
1.3.4 (5 )
0˚ 180˚ . ( ) 100 , ( ) — 500 . , .
, .
Second qualifying stage
, -. — 2 .
. . . 0 8 .
:
2.1.4 (3 )
() . :

x y . x 1 3, y — 2 5.
x y, a b. .
:
a = 4.03 b = 74.64
, -. — 2 .
. . . 0 8 .
:
2.1.4 (3 )
() . :
x y . x 1 3, y — 2 5.
x y, a b. .
:
a = 4.03 b = 74.64
Decision
, , a b .
, . , MS Excel .
, x = 2,082; y = 4,981.
, . , MS Excel .
, x = 2,082; y = 4,981.
The final stage
, .
: , , , .
:

- «»
— , «» .
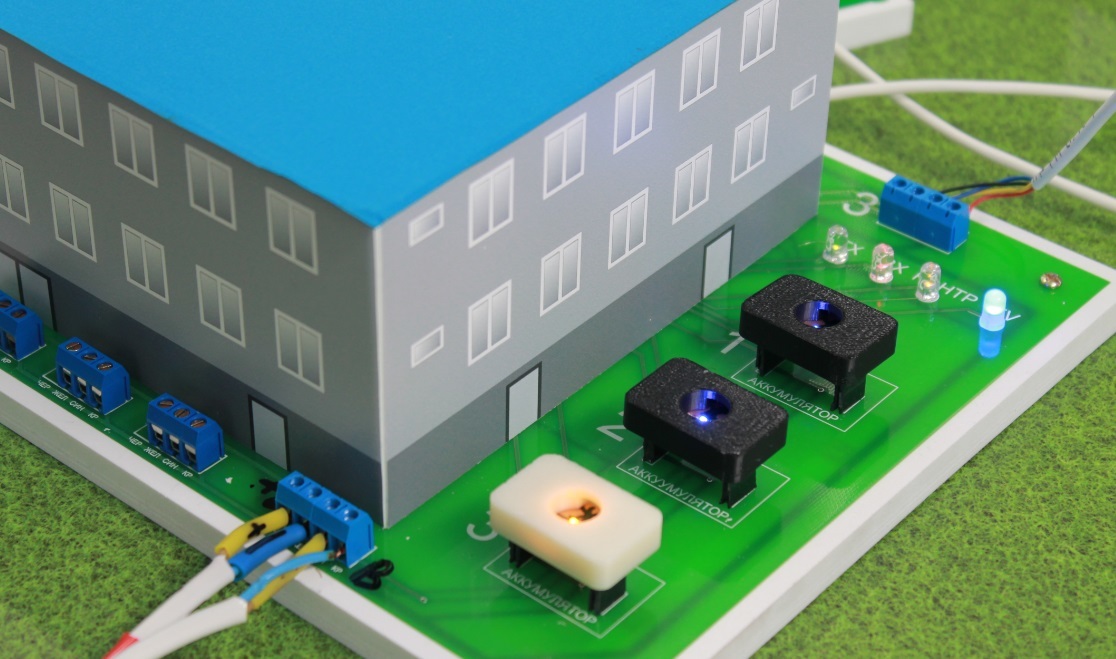
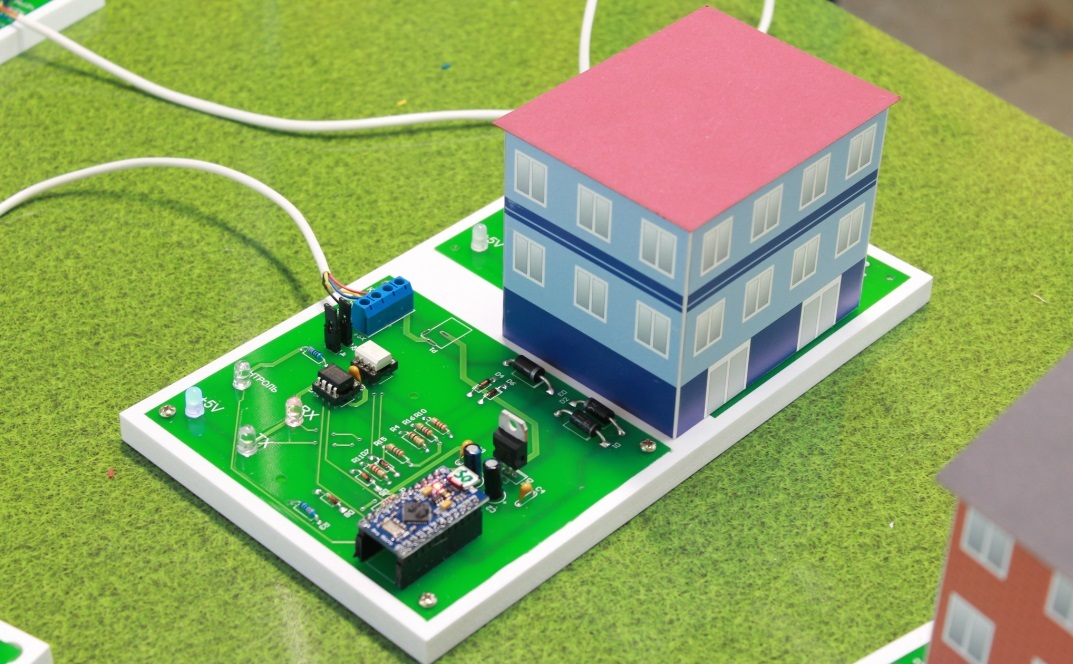


, , (. 3, 4). , .

«».
, , , – .
, :
, :
, , («»). 10 1 . «» . . .
:
, .
: , , , .
, - ,
( «»).
:
- «»
— , «» .
, , (. 3, 4). , .
«».
, , , – .
, :
- ;
- ;
- («») ;
- , ;
- «».
, :
- ,
- ,
- .
, , («»). 10 1 . «» . . .
«»
, , , :
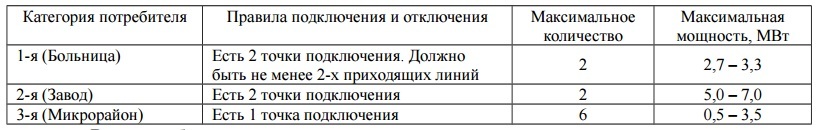
, .
(), , . – (), .
, . , – 25 .
,
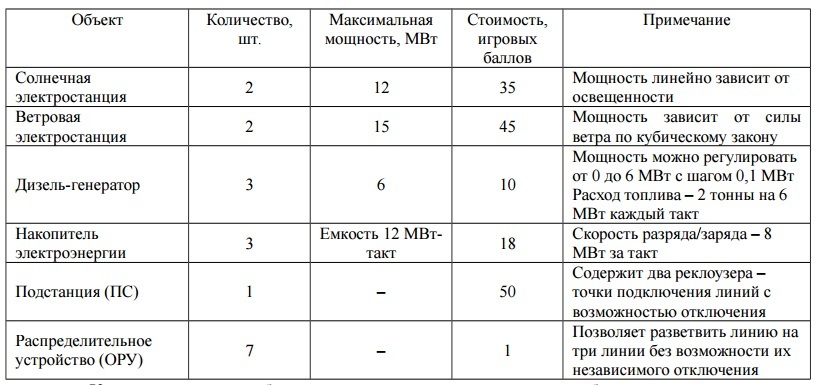
, : , 30 1 , – 2 .
15 (15 ) , 15 – 2 .
500 .
. 3- .
10 1 . 6 .
, 5 , ( ..), .
( ) .
, .
, () 5 .
Fines
( ) :
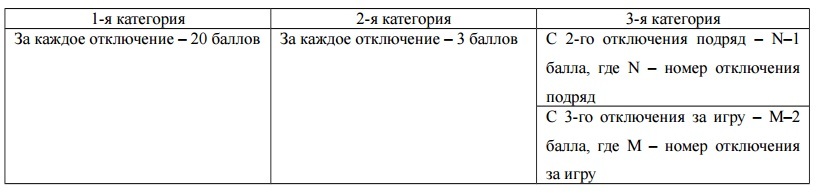
, , , :
, .
(), , . – (), .
, . , – 25 .
,
, : , 30 1 , – 2 .
15 (15 ) , 15 – 2 .
500 .
. 3- .
10 1 . 6 .
, 5 , ( ..), .
( ) .
, .
- 2- ( 0,5 N+2)
- ( – , )
- N+1
- – 95%
- /
- –
, () 5 .
Fines
( ) :
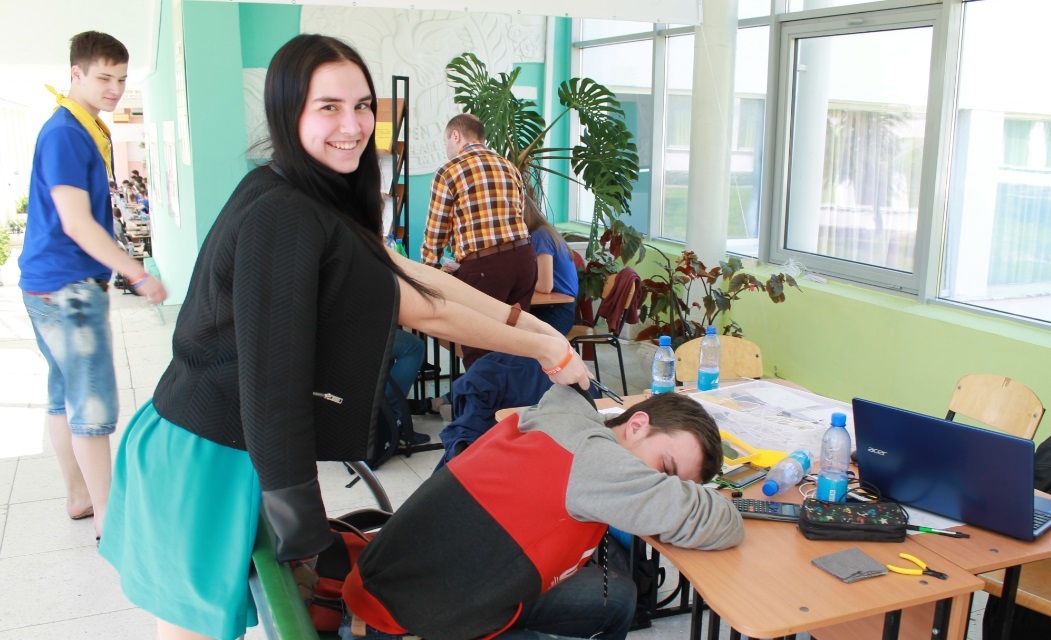
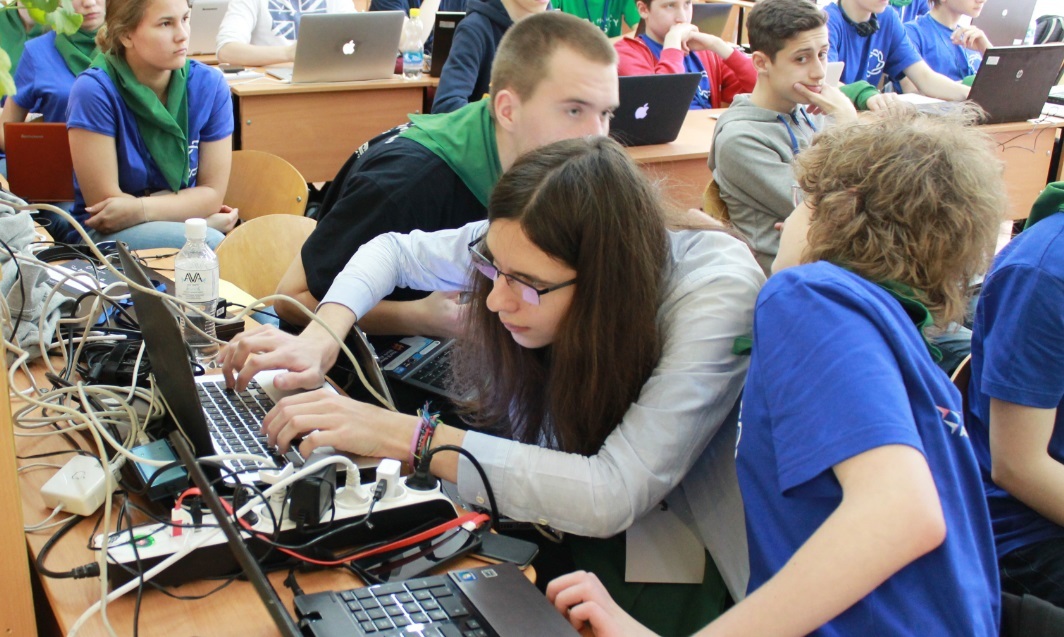
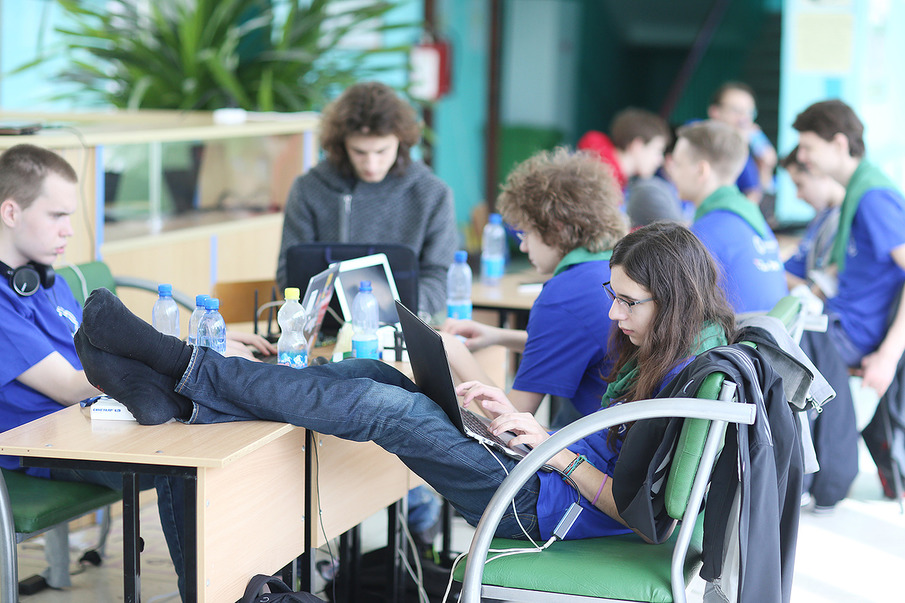
If someone fell asleep, while solving problems, we had a specially trained girl.
Stir at the finals.
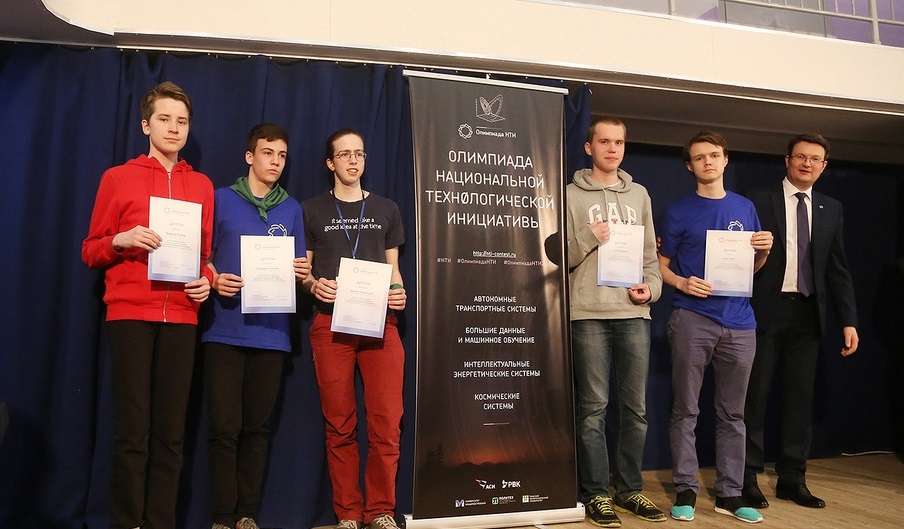
Winners - the team "1314".
- Zhiganov Daniel, GBOU school №2090 (Moscow), grade 11
- Dmitry Mikhalin, School № 2090 (Moscow), Grade 10
- Nikolic Nikolay, GBOU school №2090 (Moscow), grade 11
- Ryazanov Fedor, school № 2090 (Moscow), grade 11
Total
Despite all the troubles (potatoes for breakfast, lunch and dinner) and deprivation (you can not swim in the sea and sunbathe), all survived.
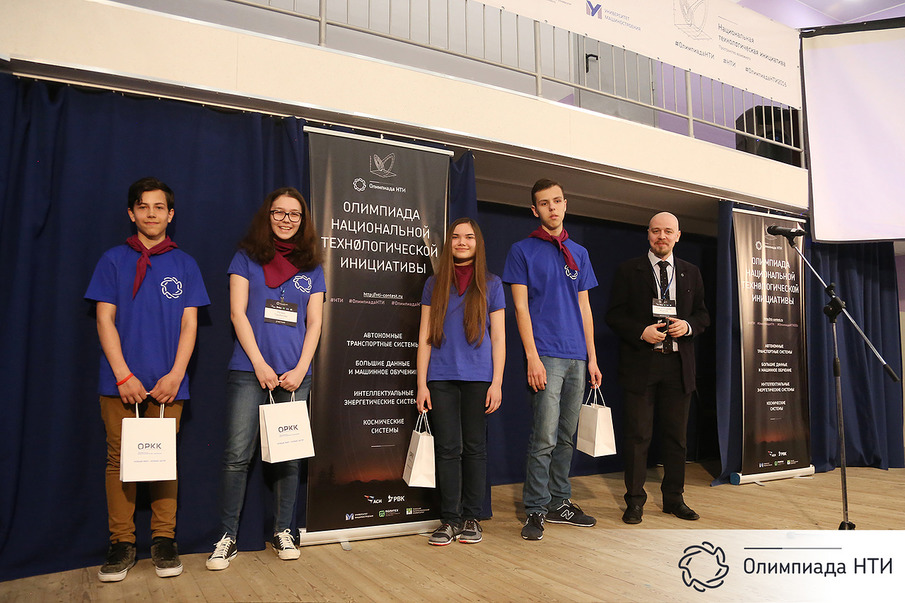
High school students received diplomas.
And the space suhpaek from ORKK.
People in jackets decided the further fate of the Olympiad and education in general.

The organizers received +1500 gold and +1000 experience.
And one more thing
I found a “real” Komsomol member and asked to “really” tie a pioneer tie.
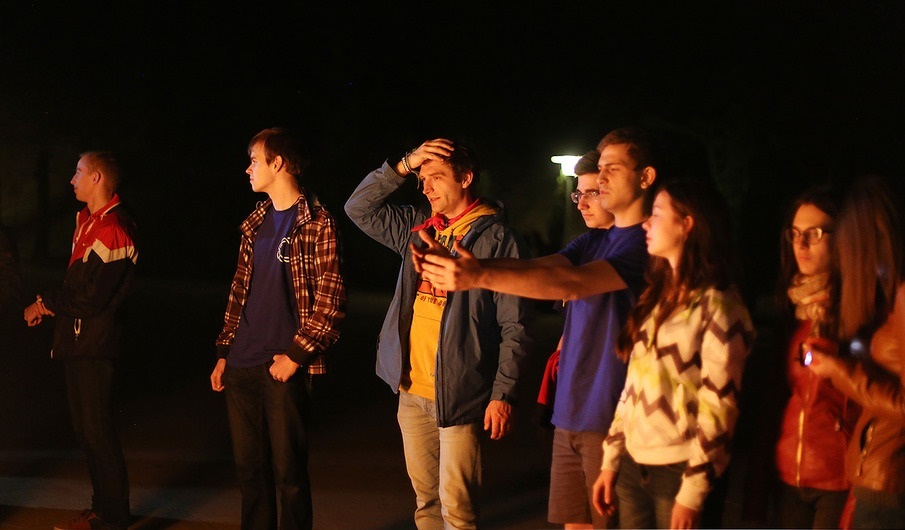
Well, at the end of the “shift” we all managed to start a “dual-core” fire, listen to the legends of the “Eaglet”, sing “Katyusha”.

Future plans
“Next year we are already starting to cook in June, because it is already clear that the correspondence stage will be much longer. Due to this, it will be possible to greatly pump up the educational component and reach more interesting tasks in the final.
I think that it is necessary to develop towards the MOOC-course, supported by a series of face-to-face activities. We will conduct hackathons in different cities together with partner organizations. ”
- Yuri Molodykh , organizer of the“ Big data and machine learning ”direction
Here is a video from Sci-one and an article on GT - I am an engineer with my mother: the NTI Olympiad final
Mass media
Scientific Russia. NTI Olympiad: the launch was successful
ASI. The winners of the All-Russian Olympiad STI will get +10 points to the results of the Unified State Exam
GT. I have an engineer with my mother: the end of the NTI Olympiad
Thanks
Personally, I want to say thanks to Alena Ilyina (for everything), Ksenia Makarova and Yulia Grabovskaya (for putting up with me), Irina Abzalova (for wonderful photos), system administrator (for the Internet and anime), all space engineers (for basketball and Heroes 3 ), as well as RVK companies (they say, if it were not for them, then nothing would have happened).
Source: https://habr.com/ru/post/283430/
All Articles