Graylog2 has become more convenient and faster.
Writing for the VPSVille three videos on Graylog realized that there was only one review article on Habré, and the manuals in any language are confused due to the different work of the components in different software versions. Having spent the day on digesting all this beauty, I am writing a manual: how to set up a Graylog server to collect events from Windows and Linux.
Who really wants to understand Linux, but does not understand where to start - I ask to my channel .

')
Instead of introducing: Graylog is open source software designed to collect logs in giant networks from a huge number of sources in various ways. It is possible to conveniently organize the collection of events, filtering, search, automation (all kinds of alerts), etc. There are many similar tools, but Graylog offers unrealistic performance using modern components, convenient analytics and a beautiful interface.
To work, he needs Java , he will store his configuration in MongoDB , and use ElasticSearch to search and store logs. About the collection of information from WIndows will be lower, but the spoiler - the agent no longer needs Java.
So, we have an official manual on which we should collect Graylog with you. But a lot of things are missed in it, these are just pieces of information, so let's go step by step ourselves (I use Ubuntu 14.04, as the developers currently advise it). Since Graylog was originally designed for the largest networks, it is recommended to install the database, the search engine and Graylog itself on different servers, create clusters, nodes from it all. I take the simplest config in which everything is spinning on the same machine.
First part: installing graylog. ( video instruction )
Java first (version 8 or higher):
Then MongoDB (what if that changes, here's a manual for you):
Following ElasticSearch (which also has its own manual ):
Elastic need:
autorun setting:
Editing configuration file:
namely specify the name of the cluster, for example:
and deny access to it over the network (since the whole system is on one machine):
still recommend banning dynamic scripts, but I have an elastic on this option swears:
Restart Elastic:
And check
If the output does not have frank errors, then everything is in order.
Installing and trying to start Graylog:
Now we set the password for access to it (I have “123456789”), encrypted, as it should be in adults (who will not understand the meaning of the commands below: watch the video , or write questions):
In the same configuration file I specify the ip of my future Graylog server and the prefix (it is the name of the Elastic cluster above).
I restart Graylog and try to log in via the web interface:
The second part: setting up logging to Graylog from Linux. ( video instruction )
We don’t need to get into the console of the receiving log server anymore. We go to a web muzzle and we create Input for logs. To paint navigation through the web interface is a bad thing, because there is video . In short:
To test Input operation, you can perform graylog in the console of the same server.
The configuration of Linux machines to send logs, in principle, is simple. Almost everywhere, syslogd releases behave the same. Who does not remember anything about logging demons - refresh my memory on the channel . So debian and redhat.
The rsyslog job file is created:
with text (the address and port is taken from the configured Input):
The log daemon is re-fetched by the command
And you can view received messages in the Graylog web interface.
The third part: setting up log reception in Graylog from Windows. ( video instruction )
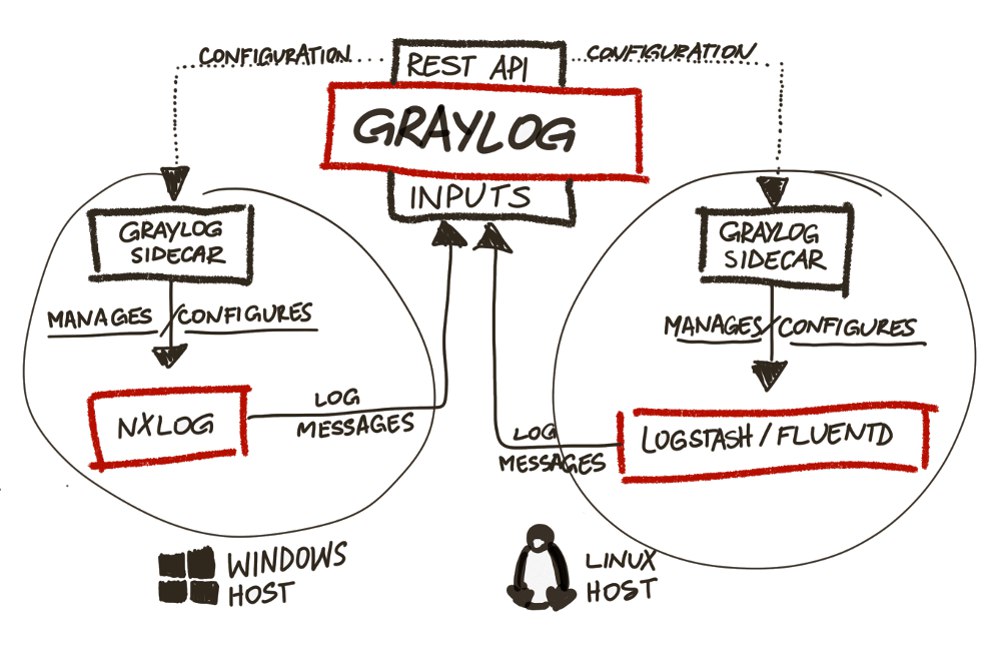
In versions of Graylog earlier than the second, the graylog collector on java was used. In the second (actual) it is simply ignored and gives errors (I tried to repair it for half a day until I understood it). Instead, it uses the graylog sidecar , which receives the config from the Graylog server (which is very convenient, since there is no need to climb the screw servers to edit the settings) and sends it to nxlog (or whatever you like), which it collects and sends.
To receive messages from Windows, you need to create a separate Input via the web interface:
To create a configuration of sending logs for nxlog on Windows, you need to create a collector through the web interface in graylog:
Go to Windows, Download and install nxlog and graylog-sidecar .
We remove as service nxlog, and set as service sidecar:
We edit the Sidecar configuration file ( C: \ Program Files (x86) \ graylog \ collector-sidecar \ collector_sidecar.yml ), namely, we specify the global (12900) listening port, server ip, and most importantly: the label by which the config will be accepted. It looks like this to me:
Run sidecar
Create
We look at the logs in its directory ( C: \ Program Files (x86) \ graylog \ collector-sidecar \ ), and if everything is ok - go to the web-face to watch the logs of Windows on the server.
Nuances:
Well, after that, work begins in the web interface: what logs where to get, how to react to what events, what to filter, etc. Start digging - figure it out. Just in case, once again manual .
Who really wants to understand Linux, but does not understand where to start - I ask to my channel .
')
Instead of introducing: Graylog is open source software designed to collect logs in giant networks from a huge number of sources in various ways. It is possible to conveniently organize the collection of events, filtering, search, automation (all kinds of alerts), etc. There are many similar tools, but Graylog offers unrealistic performance using modern components, convenient analytics and a beautiful interface.
To work, he needs Java , he will store his configuration in MongoDB , and use ElasticSearch to search and store logs. About the collection of information from WIndows will be lower, but the spoiler - the agent no longer needs Java.
So, we have an official manual on which we should collect Graylog with you. But a lot of things are missed in it, these are just pieces of information, so let's go step by step ourselves (I use Ubuntu 14.04, as the developers currently advise it). Since Graylog was originally designed for the largest networks, it is recommended to install the database, the search engine and Graylog itself on different servers, create clusters, nodes from it all. I take the simplest config in which everything is spinning on the same machine.
First part: installing graylog. ( video instruction )
Java first (version 8 or higher):
sudo add-apt-repository ppa:webupd8team/java sudo apt-get update sudo apt-get install oracle-java8-installer Then MongoDB (what if that changes, here's a manual for you):
sudo apt-key adv --keyserver hkp://keyserver.ubuntu.com:80 --recv EA312927 echo 'deb http://downloads-distro.mongodb.org/repo/debian-sysvinit dist 10gen' | sudo tee /etc/apt/sources.list.d/mongodb.list sudo apt-get update sudo apt-get install mongodb-org Following ElasticSearch (which also has its own manual ):
sudo wget -qO - https://packages.elastic.co/GPG-KEY-elasticsearch | sudo apt-key add - echo "deb http://packages.elastic.co/elasticsearch/2.x/debian stable main" | sudo tee -a /etc/apt/sources.list.d/elasticsearch-2.x.list sudo apt-get update sudo apt-get install elasticsearch Elastic need:
autorun setting:
sudo update-rc.d elasticsearch defaults 95 10 Editing configuration file:
sudo vi /etc/elasticsearch/elasticsearch.yml namely specify the name of the cluster, for example:
cluster.name: graylog
cluster.name: graylog
and deny access to it over the network (since the whole system is on one machine):
network.bind_host: localhost
network.bind_host: localhost
still recommend banning dynamic scripts, but I have an elastic on this option swears:
script.disable_dynamic: true
script.disable_dynamic: true
Restart Elastic:
sudo service elasticsearch restart And check
curl -XGET 'http://localhost:9200/_cluster/health?pretty=true' If the output does not have frank errors, then everything is in order.
Installing and trying to start Graylog:
sudo apt-get install apt-transport-https wget https://packages.graylog2.org/repo/packages/graylog-2.0-repository_latest.deb sudo dpkg -i graylog-2.0-repository_latest.deb sudo apt-get update sudo apt-get install graylog-server sudo rm -f /etc/init/graylog-server.override sudo start graylog-server Now we set the password for access to it (I have “123456789”), encrypted, as it should be in adults (who will not understand the meaning of the commands below: watch the video , or write questions):
sudo apt-get install pwgen SECRET=$(pwgen -s 96 1) sudo -E sed -i -e 's/password_secret =.*/password_secret = '$SECRET'/' /etc/graylog/server/server.conf PASSWORD=$(echo -n 123456789 | shasum -a 256 | awk '{print $1}') sudo -E sed -i -e 's/root_password_sha2 =.*/root_password_sha2 = '$PASSWORD'/' /etc/graylog/server/server.conf In the same configuration file I specify the ip of my future Graylog server and the prefix (it is the name of the Elastic cluster above).
sudo vi /etc/graylog/server/server.conf rest_listen_uri = http://10.0.1.10:12900/ web_listen_uri = http://10.0.1.10:9000/ elasticsearch_index_prefix = graylog I restart Graylog and try to log in via the web interface:
10.0.1.10 : 9000 /(by itself, all ports specified in the config should be open). When you start Graylog, you can fool around a few minutes and write in the web interface that everything is bad, do not accept the password and throw it on the main page. Give it time to recover and try.
The second part: setting up logging to Graylog from Linux. ( video instruction )
We don’t need to get into the console of the receiving log server anymore. We go to a web muzzle and we create Input for logs. To paint navigation through the web interface is a bad thing, because there is video . In short:
- UDP Input is created in the “System” menu;
- syslog udp is specified;
- specifies the port (the default is 512, but for graylog to use ports below 1024 you need a lot of traffic), so for example 1234;
- the address for listening to incoming messages is indicated, I have 10.0.1.10;
- click Launch.
To test Input operation, you can perform graylog in the console of the same server.
echo "Hello Graylog" | nc -w 1 -u 10.0.1.10 1234 and look in the web interface for messages received at Input.The configuration of Linux machines to send logs, in principle, is simple. Almost everywhere, syslogd releases behave the same. Who does not remember anything about logging demons - refresh my memory on the channel . So debian and redhat.
The rsyslog job file is created:
sudo vi /etc/rsyslog.d/90-graylog2.conf with text (the address and port is taken from the configured Input):
$template GRAYLOGRFC5424,"<%PRI%>%PROTOCOL-VERSION% %TIMESTAMP:::date-rfc3339% %HOSTNAME% %APP-NAME% %PROCID% %MSGID% %STRUCTURED-DATA% %msg%\n"
*.* @10.0.1.10:1234;GRAYLOGRFC5424
The log daemon is re-fetched by the command
sudo service rsyslog restart (well, or whatever it is in your OS).And you can view received messages in the Graylog web interface.
The third part: setting up log reception in Graylog from Windows. ( video instruction )
In versions of Graylog earlier than the second, the graylog collector on java was used. In the second (actual) it is simply ignored and gives errors (I tried to repair it for half a day until I understood it). Instead, it uses the graylog sidecar , which receives the config from the Graylog server (which is very convenient, since there is no need to climb the screw servers to edit the settings) and sends it to nxlog (or whatever you like), which it collects and sends.
To receive messages from Windows, you need to create a separate Input via the web interface:
- choose GELF UDP;
- specify the node, server ip graylog;
- remember or edit the message receiving port (by default 12201).
To create a configuration of sending logs for nxlog on Windows, you need to create a collector through the web interface in graylog:
- choose Collectors;
- select Manage Configuration;
- create a configuration;
- specify the label (it is by the sidecar label on windows that it will understand what configuration for nxlog to download to itself on the machine);
- create Output for nxlog (in which we simply specify the Input settings from the previous step: GELF UDP Output, ip, port);
- we create Input for nxlog (we specify the simplest option: Windows Event Log).
Go to Windows, Download and install nxlog and graylog-sidecar .
We remove as service nxlog, and set as service sidecar:
'C:\Program Files (x86)\nxlog\nxlog.exe' -u
'C:\Program Files (x86)\graylog\collector-sidecar\graylog-collector-sidecar.exe' -service install
We edit the Sidecar configuration file ( C: \ Program Files (x86) \ graylog \ collector-sidecar \ collector_sidecar.yml ), namely, we specify the global (12900) listening port, server ip, and most importantly: the label by which the config will be accepted. It looks like this to me:
server_url: http://10.0.1.10:12900
node_id: graylog-collector-sidecar
collector_id: file:C:\Program Files (x86)\graylog\collector-sidecar\collector-id
tags: windows
log_path: C:\Program Files (x86)\graylog\collector-sidecar
update_interval: 10
backends:
- name: nxlog
enabled: true
binary_path: C:\Program Files (x86)\nxlog\nxlog.exe
configuration_path: C:\Program Files (x86)\graylog\collector-sidecar\generated\nxlog.conf
Run sidecar
'C:\Program Files (x86)\graylog\collector-sidecar\graylog-collector-sidecar.exe' -service start
'C:\Program Files (x86)\graylog\collector-sidecar\graylog-collector-sidecar.exe' -service start
Create
eventcreate /l Application /t INFORMATION /id 1 /d “Suck it”
event eventcreate /l Application /t INFORMATION /id 1 /d “Suck it”
eventcreate /l Application /t INFORMATION /id 1 /d “Suck it”
We look at the logs in its directory ( C: \ Program Files (x86) \ graylog \ collector-sidecar \ ), and if everything is ok - go to the web-face to watch the logs of Windows on the server.
Nuances:
- it happens that the config file needs to be created manually empty C: \ Program Files (x86) \ graylog \ collector-sidecar \ generated \ nxlog.conf;
- it happens that you need to restart the Windows, so that all services are all grabbed;
- I had a cant with a typo in the name of the label, I killed an hour, figuring out;
- the label itself must be framed in the web interface, otherwise it is not a label.
Well, after that, work begins in the web interface: what logs where to get, how to react to what events, what to filter, etc. Start digging - figure it out. Just in case, once again manual .
Source: https://habr.com/ru/post/282974/
All Articles