Windows performance analysis using OS features and PAL utility
Article author - Mikhail Komarov, MVP - Cloud and Datacenter Management
This article will cover:
- mechanism for working with performance counters;
- setting up data collectors using both the graphical interface and the command line;
- creating a black box to record data.
We will also consider and discuss working with the PAL utility and its application for data collection and analysis, including typical problems of localized systems.
In general, the performance task can be presented in three parts: data collection, analysis of the obtained data and the creation of a black box for proactive monitoring of the problem system.
Data collection
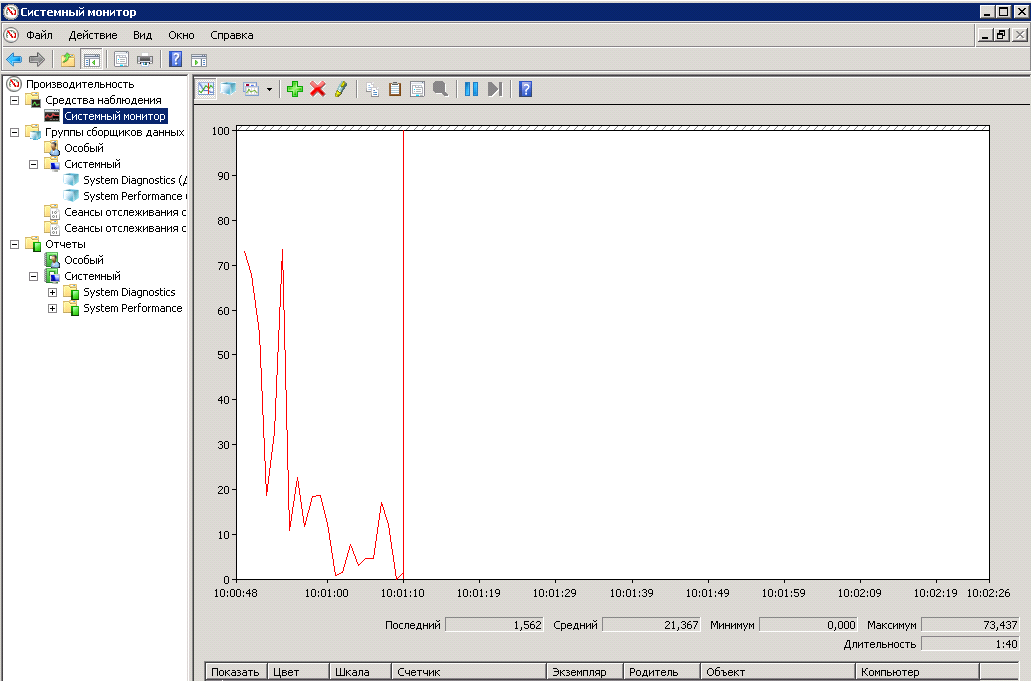
Let's start with the well-known Performance Monitor. This is a standard utility that is included in all modern editions of Windows. It is called either from the menu, or from the command line or the search bar in Windows 8/10 by entering the perfmon command. After launching the utility, we see a standard panel in which we can add and remove counters, change the presentation and scale the charts with data.
')
There are also data collectors that collect system performance data. With certain skills and dexterity, the operations of adding counters and setting up data collection parameters can be performed from the graphical interface. But when the task of setting up data collection from multiple servers arises, it is wiser to use command line utilities. Here we will deal with these utilities.
The first utility is Typeperf , which can output data from performance counters to the screen or to a file, and also allows you to get a list of counters installed in the system. Examples of using.
Displays the CPU load at 1 second intervals:
typeperf "\Processor(_Total)\% Processor Time" 
Displays the names of the performance counters associated with the PhysicalDisk object to the file:
typeperf -qx PhysicalDisk -o counters.txt In our case, we can use the Typeperf utility to create a file with the counters we need, which we will later use as a template for importing counters into a data collector .
The next utility is Logman . This utility allows you to create, modify and manage various data collectors. We will create a data collector for performance counters. Here, for example, is a brief help on the Logman command , which relates to performance counters and data collector management.
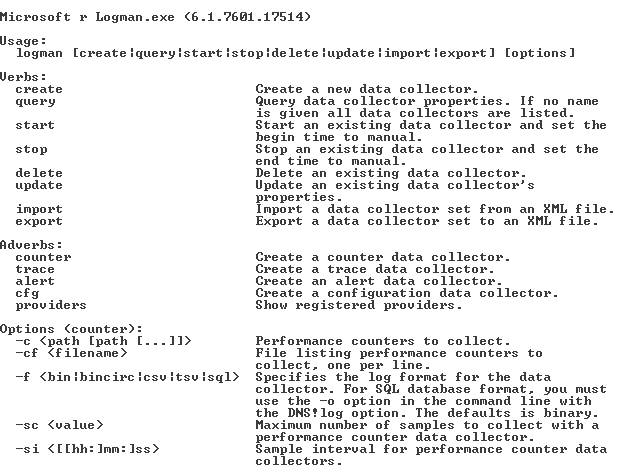

Let us examine a few examples that we need in the future.
Create a data collector named DataCollector_test by importing performance counters from the test.xml file:
logman import DataCollector_test -xml C:\PerfTest\test.xml Creating a file for collecting performance data with the circular mode enabled and the specified size:
logman update DataCollector_test -f bincirc -max 600 Changing the path to the default performance file:
logman update DataCollector_test -o C:\PerfTest\Test_log.blg Starting DataCollector_test data collector :
logman start DataCollector_test Stop the DataCollector_test data collector :
logman stop DataCollector_test Note that all these actions can be performed with a remote computer.
Consider another utility - Relog , which allows you to manipulate the data file after the data collector. Here is its description:

Below are a few scenarios for using this utility.
Extracting performance counter data from the logfile.blg file using the counters list.txt filter with a list of counters and writing the result to a binary format:
relog logfile.blg -cf counters.txt -f bin Extract a list of performance counters from logfile.blg to a text file counters.txt :
relog logfile.blg -q -o counters.txt We will not work directly with this utility, but information about it will help in the future if there are any problems in the PowerShell file that the PAL utility generates.
We note one more thing: some analysis systems require data with the names of performance counters in English. If the interface of our system is in Russian, then we need to do the following manipulations: get a local user, give him the right to collect data (usually give local administrator rights), log in to the system under it and change the interface language in the system properties.

Be sure to log out and log in a second time under this user to initialize the English interface and log out. Then specify in the data collector that data will be collected on behalf of this user.

After that, the names of the counters and files will be in English.
We also note the possibility of collecting data for SQL Server using the utility from the product. This is SQLDIAG , which handles Windows performance logs, Windows event logs, SQL Server Profiler traces, SQL Server lock information, and SQL Server configuration information. You can specify which types of information you need to collect using the SQLdiag program in the SQLDiag.xml configuration file.

You can use the PSSDIAG tool with codeplex.com to configure the SQLDiag.xml file.

Here is the window of this tool.

In summary, the data collection process for SQL may look like this. With the help of PSSDIAG, we generate an xml file. Then we send this file to the client, which launches SQLDIAG with our xml file on a remote server and sends us for analysis the result of the work as a blg file, which we will analyze in the next section.
Data Analysis with PAL
This utility is written by Clint Huffman, who is a Microsoft PFE engineer and is engaged in analyzing system performance. He is also one of the authors of the authorized Vital Sign course, which is readable at Microsoft and is available for corporate customers, including in Russia in Russian. The utility is distributed freely; I will provide a link to it below.
This is what the utility startup window looks like.

The Counter Log tab specifies the path to the data file with performance counters collected earlier. We can also set the interval for which the analysis will be performed.

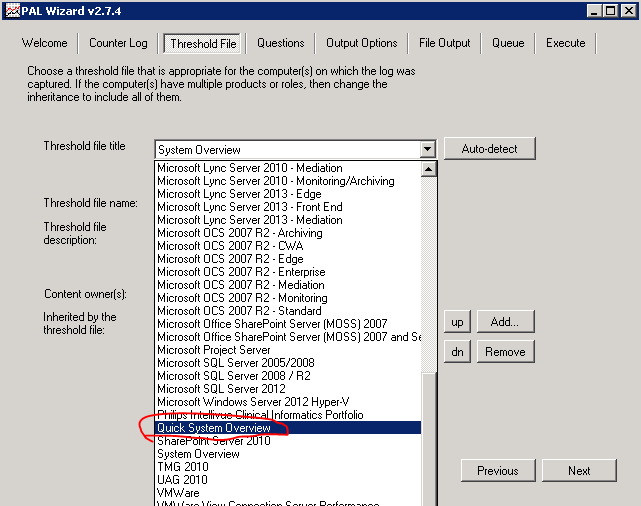
The Threshold File tab contains a list of templates that can be exported to xml format and used as a list of counters for the data collector. Check out the large selection of templates for performance analysis for various systems. An example of loading from the command line was shown above. The most valuable thing is that in these previously prepared templates, the boundary values for these parameters are set, which will be used later for analyzing the collected data !!!

So, for example, look at the boundary values for disk performance counters:

We can create our own templates using the necessary counters that will be tailored to the needs of our organization.
We act according to the following algorithm: on the workstation, we launch the PAL utility, go to the Threshold File tab and export the template as an xml file. Based on this file on the server, we create a data collector and start the assembly of information.
After collecting the data, copy the resulting file to the workstation so that the analysis does not load the server, return to the Counter Log tab , specify the path to the file. Go back to the Threshold File and select the same template that was exported for the data collector.
Switch to the Question tab and specify the amount of RAM on the server on which the data was collected. In the case of a 32-bit system, fill in UserVa .

Go to the Output Options tab, on which we set the split interval for analysis. The default AUTO divides the interval into 30 equal parts.

The File Output tab looks pretty ordinary, we point out the path to the final report files in HTML or XML format.

The Queue tab shows the final script on PowerShell. In general, we can say that the utility collects the parameters that it substitutes in the PAL.PS1 script.

The final tab sets the performance options. You can simultaneously run multiple scripts and specify the number of threads on the processor. I would like to emphasize that processing blg is not done by the utility, but by the PowerShell script, and this opens up possibilities for fully automating the analysis of logs. For example, the data collector is restarted every day, as a result, the current blg file is released and a new one is created. The old file is copied to a special server where the script that will process this file will be launched. After that, the finished HTML or XML file with the results is moved to a specific directory or sent to the mailbox.

Please note that the utility should work only in English localization. Otherwise, we get an error message.

Also, the data file should be with the names of the counters in English. I have indicated above how to do this. After clicking Finish, the PowerShell script will run, the time of which depends on the amount of data and the speed of the workstation.
The result of the utility will be a report in the selected format, in which there are graphs and numerical data that allow you to understand what happened in the system for a given period, taking into account the boundary values of the alerts in the template on the Threshold File tab. In general, analyzing an HTML file will at the initial stage identify problem areas in the system and understand where to go next, both in terms of more precise monitoring and in terms of upgrading or reconfiguring the system. The Clint Huffman blog has a script that can be used to convert a template file with boundary conditions into a more understandable format.


Black box
Sometimes there is a need for preventive monitoring of the problem system. To do this, we will create a “black box” in which we will write performance data. Let's return to the scripts described earlier.
Create a data collector named BlackBox by importing performance counters from the SystemOverview.xml file that you downloaded from the PAL utility or created yourself:
logman import BlackBox -xml C:\ BlackBox\SystemOverview.xml Creating a file for collecting performance data with the circular mode enabled and the specified size of 600 MB (about 2 days with a standard set of counters):
logman update BlackBox -f bincirc -max 600 Changing the path to the default performance file:
logman update BlackBox -o C:\ BlackBox \ BlackBox _log.blg Launch BlackBox Data Collector:
logman start BlackBox This script creates a task to restart the data collector in case of a system restart:
schtasks /create /tn pal /sc onstart /tr "logman start BlackBox " /ru system Just in case, we will correct the properties of the data manager in order not to fill the disk space, since after restarting the data collector, a new file is created with a limit of 600 MB.

Note that you can copy the data file only when the data collector is stopped. You can stop the latter using a script or using a graphical interface.
Stop BlackBox data collector:
logman stop BlackBox This concludes the part devoted to the collection and primary performance analysis.
Resources
Performance monitor
https://technet.microsoft.com/en-us/library/cc749154.aspx
PAL utility
https://pal.codeplex.com/
Clint Huffman Blog
http://blogs.technet.com/b/clinth/
Book clint huffman
Windows Performance Analysis Field Guide
http://www.amazon.com/dp/0124167012/ref=wl...=I2TOVTYHI6HDHC
Source: https://habr.com/ru/post/282740/
All Articles