Web service for simulating pedestrian traffic and identifying improvement problems
Some time ago I published here my article devoted to the problem of improvement of courtyards: habrahabr.ru/post/257563
The article considered an algorithm that allows you to predict where the pedestrians will go off the tracks and stomp on the lawns, spreading dirt and spoiling all the beauty. The algorithm was a simulation of the movement of pedestrians in a given area using the modified A * and the navigation graph modified during the movement.
The topic unexpectedly interested Habr's visitors; in the comments, many expressed a wish to try running the algorithm on their data. In the end, I made the implementation of the algorithm in the form of a web service. Under the cat will be a description of its capabilities, step-by-step instructions, as well as some implementation details. I invite everyone to test the work of the service and the algorithm, well, and use it in my projects whenever possible.
I will demonstrate the process of applying the service on the example of this section of Stachek Avenue in St. Petersburg:
')
The site itself is a great example of how not to design residential areas. It is quite possible that the unsuccessful layout is due to the fact that there was once nothing but the highway, and now there is a large residential area. I do not know. But the fact is that along it is very bad with the presence of sidewalks, passages and walkways. And even on the satellite image can be seen wide public trails through the lawns. Let's see if the algorithm will produce something similar to the situation in reality.
I will immediately assume that the frontend is not my specialty, so I did some things for the first time, and the interface probably leaves much to be desired. And the service itself is launched on the free Heroku plan and can go under the habra effect. Alas, I don’t expect any extra money to pay for normal hosting.
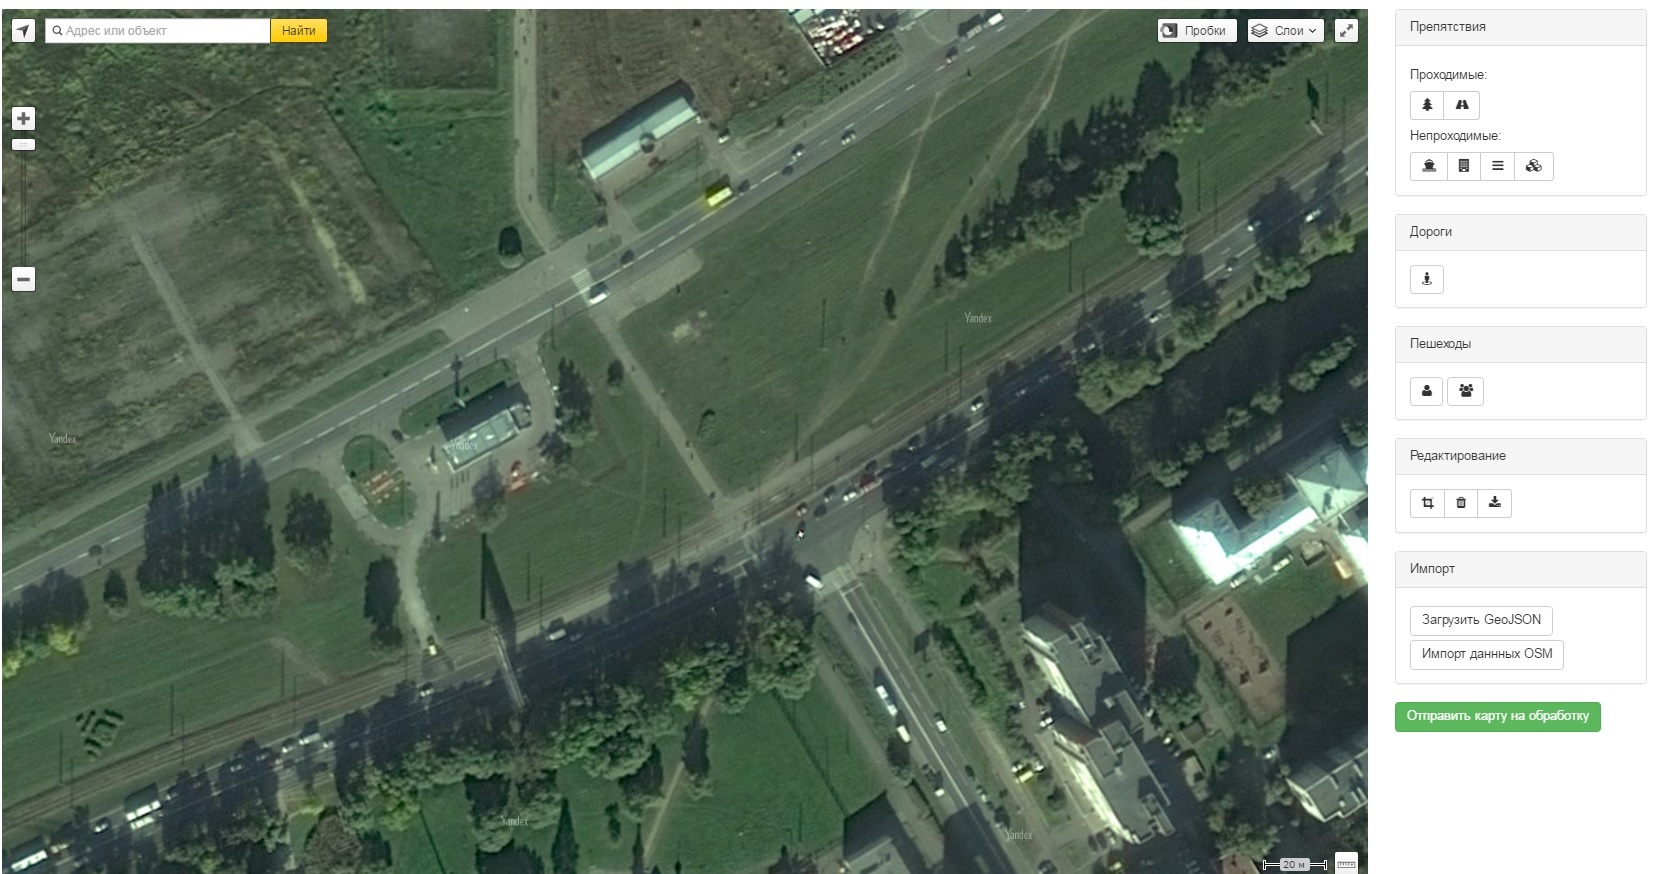
So, to draw your map go to http://antroadplanner.ru/editor/editor
The editor is based on Yandex.Maps. Why this particular map service? Because after all, their map of Russia is updated more frequently and in more detail. For example, Victory Park, mentioned in the last article, they have an updated look, after reconstruction, while Google maps and OSM still draw an outdated plan.
So, let's start drawing a map.
On the right is a toolbar that allows you to add objects to the map: obstacles and pedestrian generators. From the point of view of the maps API, pressing each button leads to a call.
I didn’t work with maps before, so I really liked the ease of editing. All the care about working with vertices and lines, the processing of clicks api takes over. Very comfortably.
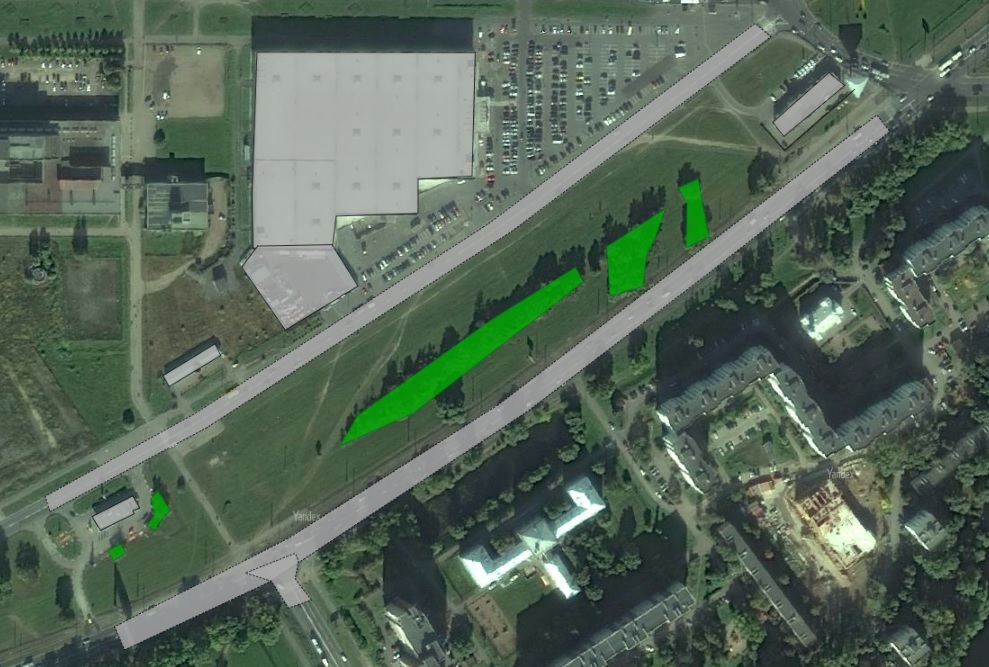
To begin, mark out the main obstacles - houses and groups of trees. People don’t like to walk between tight-fitting trunks. Use for this tool "building" and "vegetation" from the panel of obstacles.
Then mark the roads. This is a special kind of obstacle: pedestrians will not walk along the roadway, but will be able to cross it across.
As the experience of testing has shown, the difference between the types of terrain “road” and “footpath” is the most bewildering, since both are most often covered with asphalt, but the point is, from the point of view of simulation, they are fundamentally different.
Here is the map after marking the main obstacles:
Now you need to add tracks and sidewalks. Separately, it is worth noting pedestrian crossings - they must be made by a gap in the obstacle “road” with a pedestrian path laid inside. Not very convenient, yes, but so far.
After adding the tracks, it is the turn to add pedestrian generators - all those places between which they will move on our map. In the case of the site in question, this will be:
1) The entrances to the shop Maksidom (the largest building on the right-top), auto and a few small buildings
2) Two tram and bus stops along the highway
3) All paths leading outside the zone in question.
Generators can be “large” and “normal”, differing in the amount of traffic generated during the simulation. Big in this case, we note Maxid and parking around him.
Here is the final map. The tracks are light gray, the generators are brown.
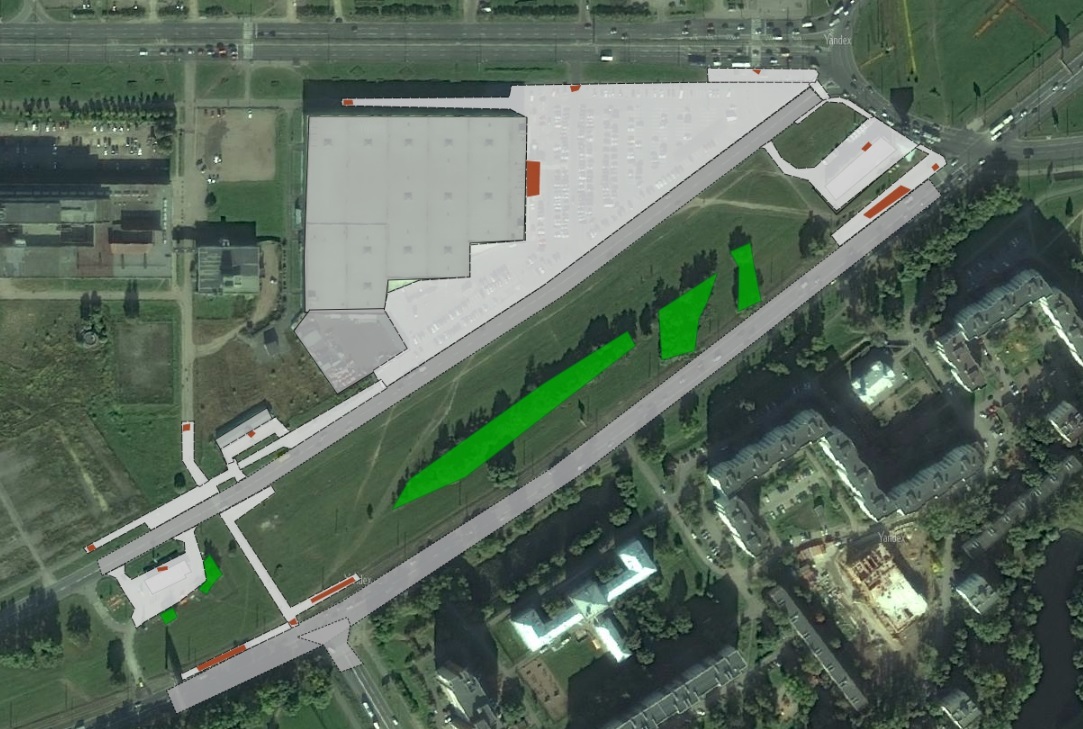
Only one small stroke is left - to indicate the exact boundaries of the simulation zone. Without this, some very clever pedestrians can take advantage of the lack of marked neighborhoods in the neighborhood - after all, it now turns out that our map seems to be “in the open field” - and bypass obstacles going beyond the region of interest to us. To do this, use the element "border".
So, the card is ready, send for processing. Optionally, you can specify your email, which will receive a notification of the results.

Calculations
The simulation can take a long time (up to half an hour), so the results are not immediately available. For computing uses a distributed network built using the JPPF framework. As a result, after sending the map, the web server simply adds it to the database and waits until the server of calculations becomes available. I run it from time to time on my home machines, but I don’t have the opportunity to keep it on all the time.
Having established a connection with the computing server, the web server begins to send tasks to it, and the web server scatters their execution over the computation nodes, and then collects the results.
In general, JPPF is quite a useful thing, for many years I have been using it in various projects requiring lengthy calculations, I started from version 2, and now there are already 5-something. It includes control servers, compute nodes, monitoring tools, and more recently works on android (although I have little idea who wants to read something heavy, long and devouring a battery on an android). Allows the flexibility to customize the requirements for the nodes at the start of the task, in general, has everything that can be expected from a similar solution for distributed computing. Except, perhaps, stability — over the years, for some reason, it has not improved.
At the moment I can let the compute nodes run on two of my machines. I was already asked whether you can connect your own nodes to help the project. Here I am in some difficulty. On the one hand, technically there is nothing difficult in this - just download the archive from the offsite, set the server IP in the config and launch it. On the other hand, I haven’t yet figured out how to protect the server from launching “alien” tasks. Since if you open his address to the outside, then anyone will be able to send their tasks to him, actually performing the code remotely on the nodes. Probably, this is not very safe from the point of view of the owners of these nodes (yes, of course, the java virtual machine, security manager, everything is up, but who can’t guarantee that you don’t have to go through them?).
So, the calculations are completed, their result can be seen either by the link in the letter, or by entering the ID card in the form in the header of the site.
And what we see: and we see about the same as in the satellite image. The program showed that people really want to walk from the stops directly in the direction of Maxidom, which is very short of the sidewalk along the highway and people walk along a large lawn along (this path can be seen on the Yandex map, although you should take a closer look).
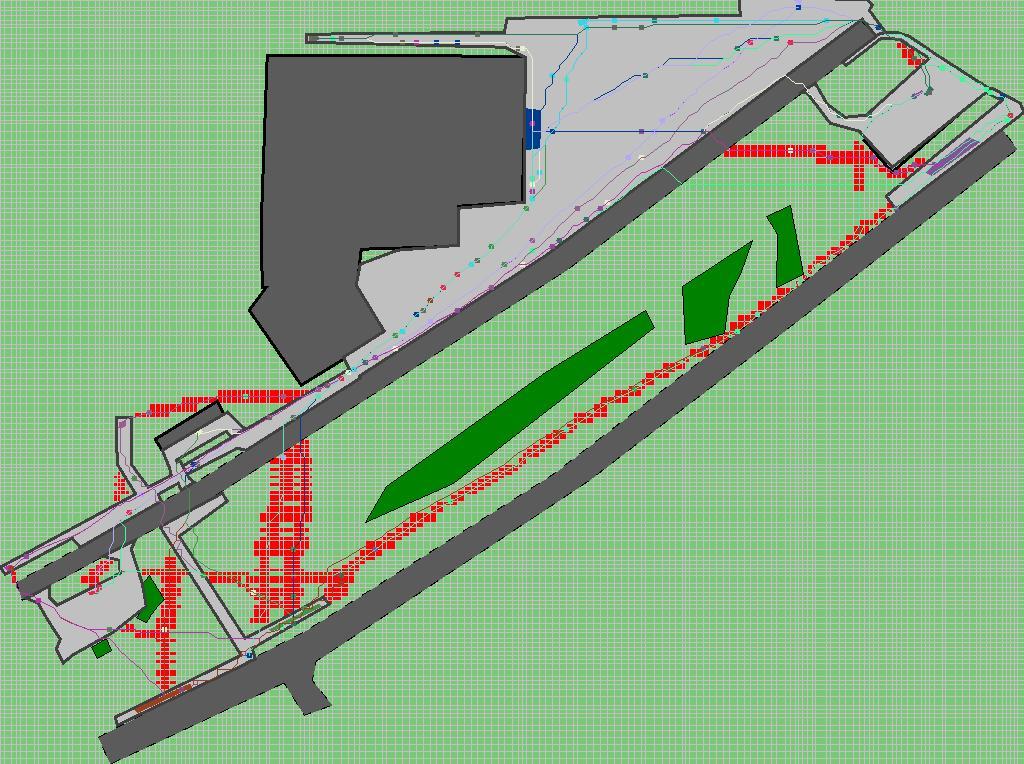
Well, people do not want to turn at right angles! Therefore, people from transport stops tend to go diagonally, straight to the goal. That is perfectly visible both on the plan generated by the algorithm and on the real satellite image.
Of course, the result is not perfect. In part, this is determined by the inaccuracies of the map marked by us (sometimes even the position of a single tree can significantly change the picture of the tracks), and partly by the mysteriousness of human nature and the incomplete compliance of the computer model with it. Therefore, I do not intend to make the tracks exactly where the algorithm suggests it. But now it can serve as a powerful tool for detecting problems in planning.
Conclusion
So, the web service is done, I invite all interested to test and use. There is still a lot of work both on the part of the interface and on the part of the algorithm, but I hope that even in this form, it can warn designers from making typical mistakes.
A more up-to-date and updated tutorial is available at http://blog.antroadplanner.ru/Help- drawing a map /
A blog in which I write about service updates, examples of work and any thoughts on the subject of beautification:
https://blog.antroadplanner.ru
UPD 1: For those who receive the error "the map is not connected": if the border of the map is not drawn by hand, then the bounding box of all geometry is taken over the border. Moreover, if you have a long building going through the entire map - BB will be built along its edges, and the map will be divided into two unrelated areas. Therefore, it is always best to draw the border, in this case leaving gaps along the edges.
UPD 2: For those who are too lazy to manually arrange the building - you can use the data import from OSM . To do this, you need to convert a fragment of the OSM card to the GeoJSON format (for example, using the JOSM tool) and load it into the editor. True, such maps require manual refinement: it is necessary to place pedestrian generators and repair roads, since in OSM roads are not thick and are defined by lines, not polygons
Here is an example of a large and complex map derived from OSM data:

The article considered an algorithm that allows you to predict where the pedestrians will go off the tracks and stomp on the lawns, spreading dirt and spoiling all the beauty. The algorithm was a simulation of the movement of pedestrians in a given area using the modified A * and the navigation graph modified during the movement.
The topic unexpectedly interested Habr's visitors; in the comments, many expressed a wish to try running the algorithm on their data. In the end, I made the implementation of the algorithm in the form of a web service. Under the cat will be a description of its capabilities, step-by-step instructions, as well as some implementation details. I invite everyone to test the work of the service and the algorithm, well, and use it in my projects whenever possible.
I will demonstrate the process of applying the service on the example of this section of Stachek Avenue in St. Petersburg:
')
The site itself is a great example of how not to design residential areas. It is quite possible that the unsuccessful layout is due to the fact that there was once nothing but the highway, and now there is a large residential area. I do not know. But the fact is that along it is very bad with the presence of sidewalks, passages and walkways. And even on the satellite image can be seen wide public trails through the lawns. Let's see if the algorithm will produce something similar to the situation in reality.
I will immediately assume that the frontend is not my specialty, so I did some things for the first time, and the interface probably leaves much to be desired. And the service itself is launched on the free Heroku plan and can go under the habra effect. Alas, I don’t expect any extra money to pay for normal hosting.
So, to draw your map go to http://antroadplanner.ru/editor/editor
The editor is based on Yandex.Maps. Why this particular map service? Because after all, their map of Russia is updated more frequently and in more detail. For example, Victory Park, mentioned in the last article, they have an updated look, after reconstruction, while Google maps and OSM still draw an outdated plan.
So, let's start drawing a map.
On the right is a toolbar that allows you to add objects to the map: obstacles and pedestrian generators. From the point of view of the maps API, pressing each button leads to a call.
currentPoly = new ymaps.Polygon(...) // currentPoly.editor.startDrawing() // I didn’t work with maps before, so I really liked the ease of editing. All the care about working with vertices and lines, the processing of clicks api takes over. Very comfortably.
To begin, mark out the main obstacles - houses and groups of trees. People don’t like to walk between tight-fitting trunks. Use for this tool "building" and "vegetation" from the panel of obstacles.
Then mark the roads. This is a special kind of obstacle: pedestrians will not walk along the roadway, but will be able to cross it across.
As the experience of testing has shown, the difference between the types of terrain “road” and “footpath” is the most bewildering, since both are most often covered with asphalt, but the point is, from the point of view of simulation, they are fundamentally different.
- A road is a roadway of major streets. Pedestrians do not walk along it "along", but only cross.
- A footpath is all those places where pedestrians can walk in any direction. This is not only the track itself, but also, for example, intrapassways or parking lots.
Here is the map after marking the main obstacles:
Now you need to add tracks and sidewalks. Separately, it is worth noting pedestrian crossings - they must be made by a gap in the obstacle “road” with a pedestrian path laid inside. Not very convenient, yes, but so far.
After adding the tracks, it is the turn to add pedestrian generators - all those places between which they will move on our map. In the case of the site in question, this will be:
1) The entrances to the shop Maksidom (the largest building on the right-top), auto and a few small buildings
2) Two tram and bus stops along the highway
3) All paths leading outside the zone in question.
Generators can be “large” and “normal”, differing in the amount of traffic generated during the simulation. Big in this case, we note Maxid and parking around him.
Here is the final map. The tracks are light gray, the generators are brown.
Only one small stroke is left - to indicate the exact boundaries of the simulation zone. Without this, some very clever pedestrians can take advantage of the lack of marked neighborhoods in the neighborhood - after all, it now turns out that our map seems to be “in the open field” - and bypass obstacles going beyond the region of interest to us. To do this, use the element "border".
So, the card is ready, send for processing. Optionally, you can specify your email, which will receive a notification of the results.
Calculations
The simulation can take a long time (up to half an hour), so the results are not immediately available. For computing uses a distributed network built using the JPPF framework. As a result, after sending the map, the web server simply adds it to the database and waits until the server of calculations becomes available. I run it from time to time on my home machines, but I don’t have the opportunity to keep it on all the time.
Having established a connection with the computing server, the web server begins to send tasks to it, and the web server scatters their execution over the computation nodes, and then collects the results.
In general, JPPF is quite a useful thing, for many years I have been using it in various projects requiring lengthy calculations, I started from version 2, and now there are already 5-something. It includes control servers, compute nodes, monitoring tools, and more recently works on android (although I have little idea who wants to read something heavy, long and devouring a battery on an android). Allows the flexibility to customize the requirements for the nodes at the start of the task, in general, has everything that can be expected from a similar solution for distributed computing. Except, perhaps, stability — over the years, for some reason, it has not improved.
At the moment I can let the compute nodes run on two of my machines. I was already asked whether you can connect your own nodes to help the project. Here I am in some difficulty. On the one hand, technically there is nothing difficult in this - just download the archive from the offsite, set the server IP in the config and launch it. On the other hand, I haven’t yet figured out how to protect the server from launching “alien” tasks. Since if you open his address to the outside, then anyone will be able to send their tasks to him, actually performing the code remotely on the nodes. Probably, this is not very safe from the point of view of the owners of these nodes (yes, of course, the java virtual machine, security manager, everything is up, but who can’t guarantee that you don’t have to go through them?).
So, the calculations are completed, their result can be seen either by the link in the letter, or by entering the ID card in the form in the header of the site.
And what we see: and we see about the same as in the satellite image. The program showed that people really want to walk from the stops directly in the direction of Maxidom, which is very short of the sidewalk along the highway and people walk along a large lawn along (this path can be seen on the Yandex map, although you should take a closer look).
Well, people do not want to turn at right angles! Therefore, people from transport stops tend to go diagonally, straight to the goal. That is perfectly visible both on the plan generated by the algorithm and on the real satellite image.
Of course, the result is not perfect. In part, this is determined by the inaccuracies of the map marked by us (sometimes even the position of a single tree can significantly change the picture of the tracks), and partly by the mysteriousness of human nature and the incomplete compliance of the computer model with it. Therefore, I do not intend to make the tracks exactly where the algorithm suggests it. But now it can serve as a powerful tool for detecting problems in planning.
Conclusion
So, the web service is done, I invite all interested to test and use. There is still a lot of work both on the part of the interface and on the part of the algorithm, but I hope that even in this form, it can warn designers from making typical mistakes.
A more up-to-date and updated tutorial is available at http://blog.antroadplanner.ru/Help- drawing a map /
A blog in which I write about service updates, examples of work and any thoughts on the subject of beautification:
https://blog.antroadplanner.ru
UPD 1: For those who receive the error "the map is not connected": if the border of the map is not drawn by hand, then the bounding box of all geometry is taken over the border. Moreover, if you have a long building going through the entire map - BB will be built along its edges, and the map will be divided into two unrelated areas. Therefore, it is always best to draw the border, in this case leaving gaps along the edges.
UPD 2: For those who are too lazy to manually arrange the building - you can use the data import from OSM . To do this, you need to convert a fragment of the OSM card to the GeoJSON format (for example, using the JOSM tool) and load it into the editor. True, such maps require manual refinement: it is necessary to place pedestrian generators and repair roads, since in OSM roads are not thick and are defined by lines, not polygons
Here is an example of a large and complex map derived from OSM data:
Source: https://habr.com/ru/post/282626/
All Articles