Profiling JS code from functions. Yandex experience
For the last six months, the familiar Yandex Search Engine Result Page (SERP) interface has moved to a new architecture, with which the development of non-specific features becomes very fast, and the development of specific features is predictable. For a large distributed team of 40 front-tenders, this is a great success. When everything was almost ready and the new code began to run in production experiments, it turned out that the server-side JS template in the new architecture was noticeably slowed down.

The new code was easier and more logical to arrange, so the slowdown was not only undesirable, but also unexpected. To get the "green light" for the new architecture, it was necessary to speed up the code so that it worked at least as fast as the old one.
It was not possible to solve the problem by simply “looking at it”, it was necessary to understand it, it was necessary to profile it. Read on to find out how this was done.
Our kitchen
SERP written in BEM. Server templating is written in JS and consists of two parts:
- the code that converts the backend data into a BEMJSON page (tree of blocks, elements, and modifiers) is PRIV-template;
- The code that turns BEMJSON into HTML is BEMHTML templating .
The second part we did not touch, the architecture was replaced in the first.
Now in PRIV-templating, BEMJSON is generated for three platforms - desktops, tablets and phones. The slowdown affected only the first two platforms.
A PRIV code is a large number of functions in the global scope. Functions are named after BEM and are in different files, and during the build process they are collected into one file.
For example:
// - blocks['my-block'] = function(arg1, arg2) { /* ... */ } // - – // - blocks['my-block__elem'] = function(arg1, arg2) { /* ... */ } In the past, block functions were equal and were not included in any hierarchy. Just some blocks were low-level and actually generated BEMJSON, while others were high-level - the blocks were called the lower level.
In the new architecture, blocks have roles with a fixed interface. The blocks began to merge into levels of abstraction, forming a pipeline for processing source data into the final BEMJSON.
Before the start
A quick search showed that there is no universal JS code profiler and the topic itself is covered a little. I had to understand the methods on the go, simultaneously forming my own opinion about them.
Let's talk about profiling server-side JS-code, sorting out methods from simple to complex. Note: we worked exclusively on Node.JS 4.2.2.
')
GUI-approach. Chromium
The simplest and seemingly visual tool is the proflator built into the Chromium browsers, which can be used with the node-inspector module .
As a result of the work of the profiler, we get three views of the collected results:
- Top-Down;
- Bottom-up;
- Chart.
All three are different ways of displaying the complete call tree of the executed code. In the first case, the tree is built from top to bottom, in the second - from bottom to top, in the third - we will look at an example.
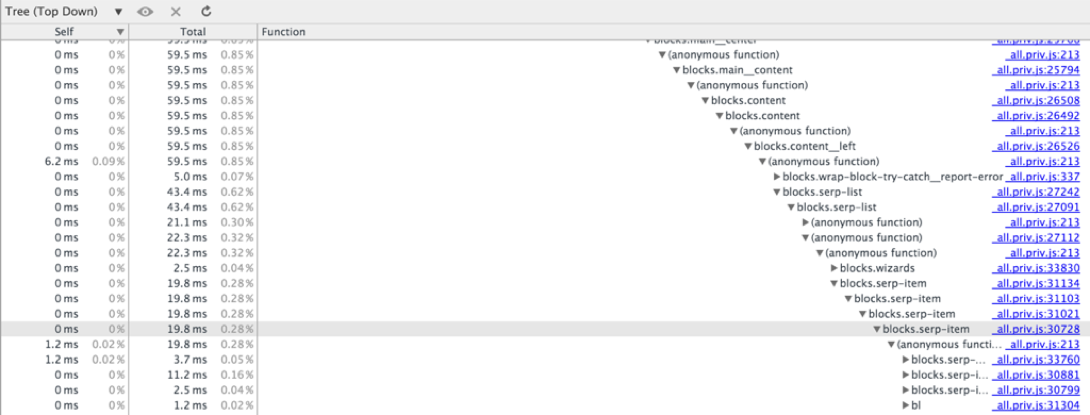
↑ Top-Down allows you to track the execution time of only those function calls that are at a shallow depth of the call stack. The problem is the lack of horizontal scrolling. In our case, with a tree height of 182, we managed to reach calls at a depth of 37, the rest remained hidden behind the right edge of the screen.
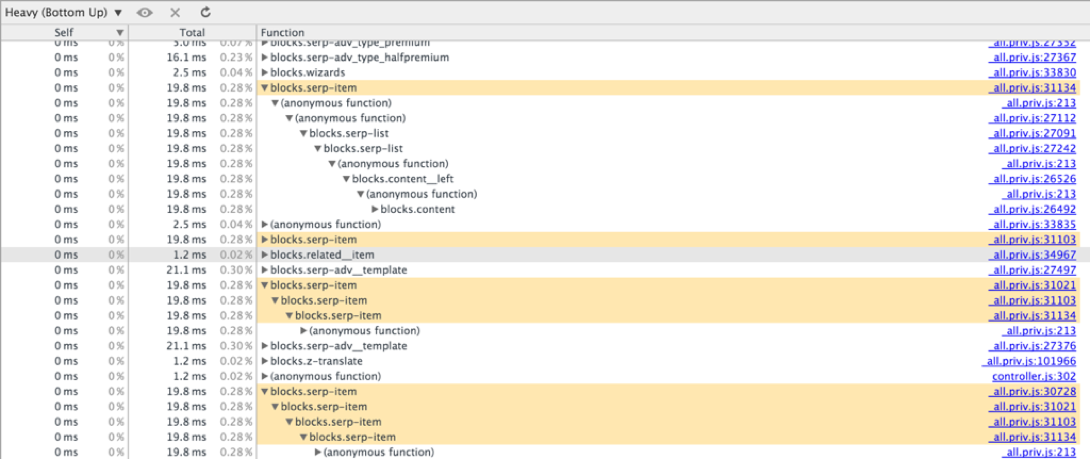
↑ Bottom-Up does not require horizontal scrolling, as you can start browsing the tree "from any place." If you started with a call to function F, climbed the tree to a call to function G and came up against the edge of the screen — we find the separate call to G and continue moving. The blessing is a search by function name. But functions are not displayed here, the total execution time of which turned out to be less than some constant.
If it was not possible to find the function in Bottom-Up, then it was executed in very little time, or, which also happens, it was zain-line when compiled.
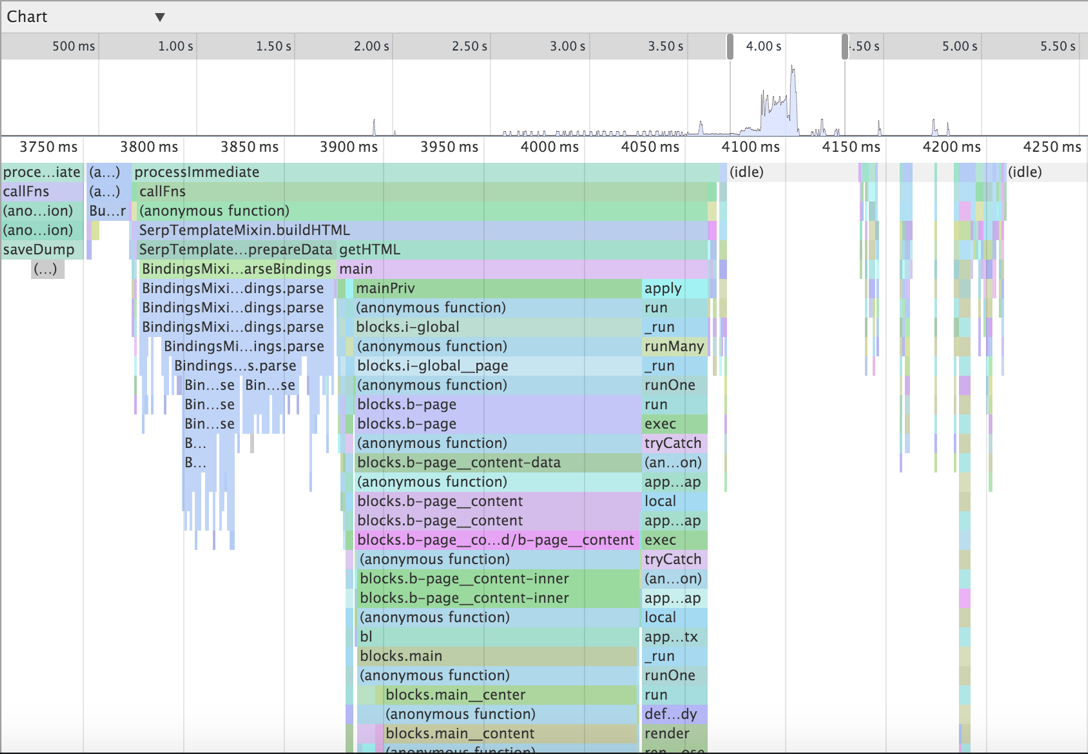
↑ Chart draws a call tree tied to the time axis with the possibility of changing the scale and only horizontal scrolling. Here we saw calls at a depth of 32, the rest went to the bottom of the screen.
GUI-approach. Webstorm
Chromium & node-inspector is not the only option for a GUI profiler, for example, WebStorm offers similar functionality:
Run → Edit Configurations ... → Node.js configuration → V8 Profiling tab
Here are four ways to display the call tree:
- Top Calls;
- Flame chart;
- Bottom-up;
- Top-down.
We note immediately that here you can control the threshold for filtering functions by execution time (you can not filter at all).
In our case, Top Calls did not show anything except the runtime of the shared libraries (bin / node, libsystem_kernel, libsystem_malloc, libsystem_c, and libstdc ++).
Flame chart is similar to Charts from Chromium, only incomprehensible and seemingly useless. Scale the image to see at least some of the challenges and their nesting, failed.
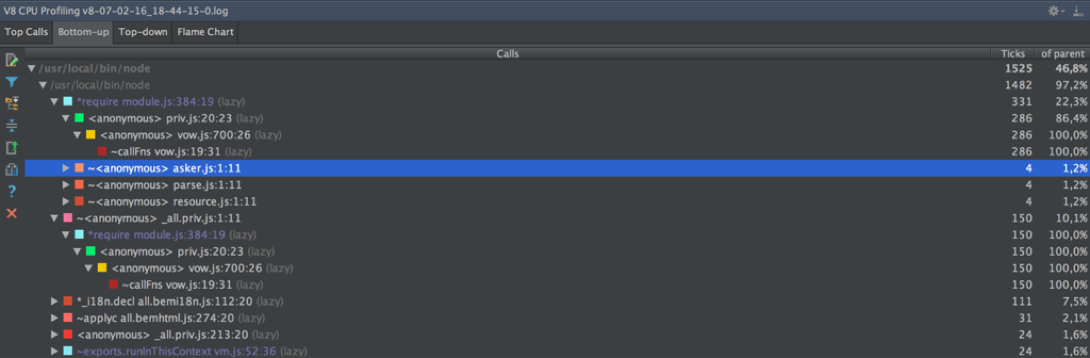
↑ Bottom-up resembles a similar mode from Chromium, only there is no search and the structure is slightly different. Without a search by function name it is impossible to use it.
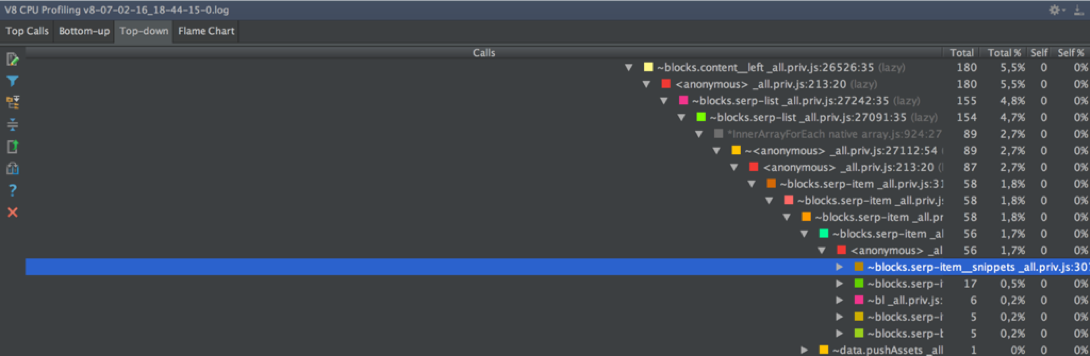
↑ Top-down suffers the same lack of horizontal scrolling as Chromium in a similar situation. See what functions were performed below the level of nesting 37, does not work. And here the stack is more detailed, it includes not only JS-calls, but also the insides of the language (ArrayForEach, InnerArrayForEach, Module._compile, Module._load, and others).
GUI output
Of the GUI-profiling methods considered, the most convenient is data collection through node-inspector & Chromium and their analysis in the form of a Bottom-Up view of a complete tree of calls with the ability to search.
The remaining methods and solutions can be conveniently used with the height of the call tree no more than 30.
However, all of these methods are not suitable for profiling server code. It is not enough to run node-inspector, turn on the CPU profile entry, make a couple of requests and start analyzing the data. We need a representative sample of characteristic queries and not only the total time for executing functions, but also other indicators — average time, median, different percentiles. Need a guided experiment.
Profiling theory
There are two basic approaches to profiling: instrumentation- and sampling-profiling.
When instumentation-profiling, we change the code being profiled, supplementing it with logging of all function calls with the time they are executed. This method collects detailed, but slightly distorted information, because as a result, it is not the source code that is profiled, but the modified one - with logging.
When sampling profiling, the code being profiled does not change, but the executing system periodically pauses its execution and logs the current snapshot of the call stack. The essence of this method will be discussed later with an example.
Operated experiment number 1.
Instrumentation approach
This approach is very organically implemented in our case, when all the code is a set of functions. Everything is done in a couple of steps.
Helper to record time in nanoseconds using process.hrtime (Date milliseconds will not suffice):
function nano() { var time = process.hrtime(); return time[0] * 1e9 + time[1]; } A wrapper that starts the original function and logs its execution time:
function __profileWrap__(name, callback, args) { var startTime = nano(), result = callback.apply(ctx, args), time = nano() - startTime; logStream.write(name + ',' + time + '\n'); return result; } Actually wrapping code:
Object.keys(blocks).forEach(function(funcName) { var base = blocks[funcName]; if (typeof base === 'function') { blocks[funcName] = function() { return __profileWrap__(funcName, base, arguments); }; } }); It's simple.
But in such an implementation, recursive calls were handled incorrectly. For example, such a case of indirect recursion:
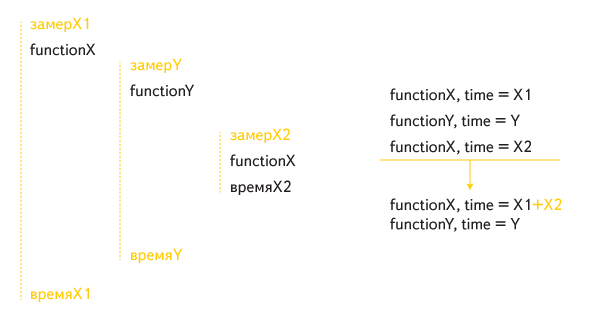
The total execution time of function X included its internal call twice: once as part of the time the external call was running, and a second time separately.
For correct processing of recursive calls, editing was required:
function __profileWrap__(name, callback, args) { if (called[name]) return callback.apply(ctx, args); called[name] = true; // var startTime = nano(), result = callback.apply(ctx, args), time = nano() - startTime; delete called[name]; logStream.write(name + ',' + time + '\n'); return result; } In addition, they added to the profiled code an entry in the log of the marker, signifying the end of processing a single request. The marker will help to match the log entries with specific queries in order to count different metrics of interest.
To process the log for computing, for example, the medians of the execution time of functions, you need the following code:
var requests = [], currentRequest = {}; function getMedians() { var funcTime = {}; requests.forEach(function(request) { Object.keys(request).forEach(function(funcName) { // (funcTime[funcName] = funcTime[funcName] || []).push(request[funcName]); }); }); Object.keys(funcTime).forEach(function(funcName) { var arr = funcTime[funcName], value; // while (arr.length < requests.length) arr.push(0); // value = median(arr); if (value > 0) { // funcTime[funcName] = value; } else { // delete funcTime[funcName]; } }); return funcTime; } function writeResults() { var funcMedians = getMedians(); // // : < > <> < > console.log( Object .keys(funcMedians) .sort(function(funcNameA, funcNameB) { return funcMedians[funcNameB] - funcMedians[funcNameA]; }) .map(function(funcName) { return funcName + '\t' + nano2milli(funcMedians[funcName]); }) .join('\n'); ); } function processLine(parsedLine, isItLast) { if (parsedLine.isMarker) { requests.push(currentRequest); currentRequest = {}; } else { // GET- currentRequest[parsedLine.funcName] = (currentRequest[parsedLine.funcName] || 0) + parsedLine.time; } if (isItLast) writeResults(); } // processLine(...) Having fired at the server with thousands of requests, we identified the blocks that caused everything to slow down. But this did not want to stop - the results needed to be confirmed by a different approach.
Towards a controlled experiment # 2.
Sampling-profiling out of the box
It is known that Node.JS out of the box supports this kind of profiling. It is enough to run the application with the necessary parameters, and the data will be collected in the specified file:
node --prof —logfile=v8.log my_app.js
man node - contains many more interesting options.
The log looks like this:

We note immediately that logging is not synchronized; when profiling a multi-threaded code, we received “stitched” lines. Having discovered this, we turned off the layer that organizes multithreaded PRIV code for the duration of the tests in our project.
In the process of finding the answer to the question of how to read the log, we managed to find the node-tick-processor module. This module parses the log and displays into the console the already familiar full call tree of the spent program in two forms - bottom-up and top-down , only the execution time for each function is considered not in milliseconds, but in ticks.
We wanted to know the details of the operation of the tick-processor algorithm and answer the questions:
- How is the call tree built?
- What do tics mean?
- Why ticks, not milliseconds?
It was immediately established that the source files of the tick-processor are files from v8 / tools .
Parsing the log happens like this.
The log is a csv file, each line is a command with parameters. The main commands are:
- commands binding code fragments to addresses (shared-library, code-creation, code-move);
- the tick command corresponding to the stack snapshot (the frequency of ticks is set by the option node —cpu_profiler_sampling_interval, by default
1 ms100 ms).
Code snippets are either C code snippets (static or shared) or JS code snippets (dynamic). All fragments are stored in three splaytree structures, respectively.
Tick lines are arranged like this:
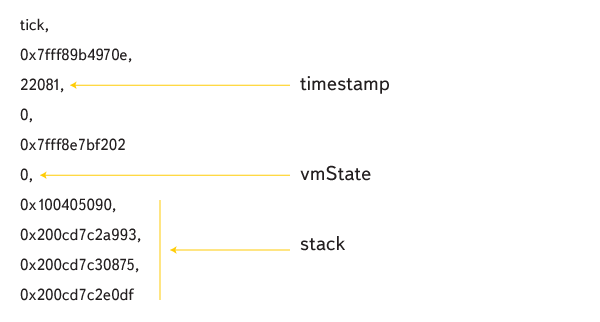
timestamp corresponds to tick time, vmState is the state of the virtual machine (0 is JS execution), then comes the stack of addresses. Using the splaytree structures, the function names in the stack are restored.
All stacks thus obtained are glued together, making up a full tree of challenges:
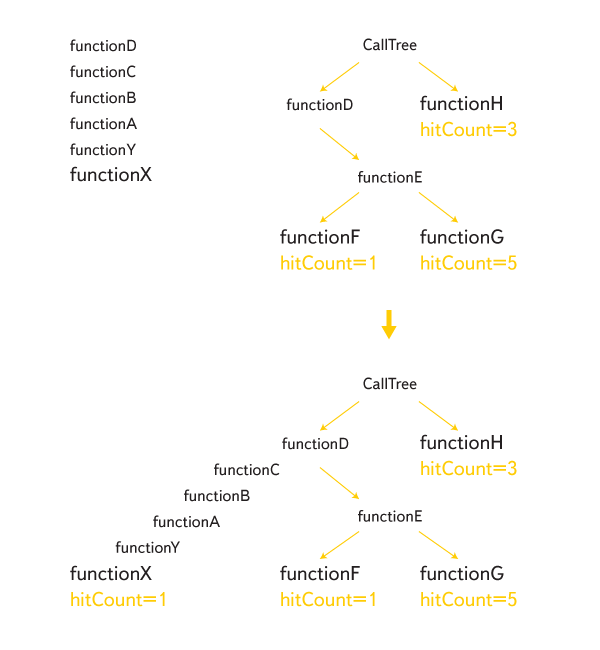
Each calllist is assigned a hitCount value with the meaning “how many times a function was called like this”. When profiling is completed, hitCount is calculated for all internal nodes from bottom to top. The values obtained are the tics that the tick-processor shows in its output.
There is an obvious, but crude way to convert ticks to milliseconds:
hitTime = (maxTimestamp - minTimestamp) / (timestamps.length - 1)blockTime = hitCount * hitTime
The time between ticks is not the same in reality, and the fact that we were inside function F at time T and at time T + 1 ms does not mean at all that the function was performed 2 ms. It is possible that completely different functions were performed between these points in time, which such a method of profiling “will not notice”. However, this is exactly how execution time is considered in Chromium - https://code.google.com/p/chromium/code search#chromium/ src/ third_party/ WebKit/ Source/ devtools/ front_end/ sdk/ CPUProfileDataModel.js&sq= package: chromium & type = cs & l = 31
In any case, we needed an alternative profiling method to validate the results of the instrumentation method.
Managed experiment number 2.
Sampling approach
Fortunately, I didn’t have to dig into the node-tick-processor for a long time, as there was a v8-profiler module that works like this:
var profiler = require('v8-profiler'); profiler.startProfiling('profilingSession'); doSomeWork(); console.log(profiler.stopProfiling('profilingSession')); In this case, an object of the following type is printed to the console:
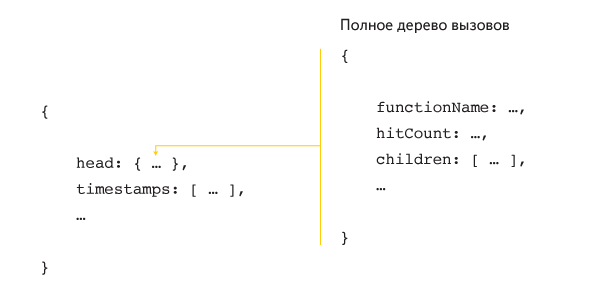
Our profiling code when using v8-profiler looks like this:
var hitTime; function checkoutTime(node) { var hits = node.hitCount || 0; node.children.forEach(function(childNode) { hits += checkoutTime(childNode); }); logStream.write(node.functionName + ',' + (hits * hitTime) + '\n'); return hits; } function getTime(profile) { var timestamps = profile.timestamps, lastTimestampIndex = timestamps.length - 1; // , hitTime = 1000 * (timestamps[lastTimestampIndex] - timestamps[0]) / lastTimestampIndex; checkoutTime(profile.head); } By analogy with instrumentation, editing is needed for correct recursion processing:
function stackAlreadyHas(node, name) { return node && (node.functionName === name || stackAlreadyHas(node.parent, name)); } function checkoutTime(node) { var name = node.functionName, hits = node.hitCount || 0; node.children.forEach(function(childNode) { // childNode.parent = name; hits += checkoutTime(childNode); }); // if (!stackAlreadyHas(node.parent, name)) { logStream.write(name + ',' + (hits * hitTime) + '\n'); } return hits; } Guided experiments. results
The median runtime for the serp-item block is the main block corresponding to one search results result (the page contains 10 such results):
| method | desktop | tablet |
|---|---|---|
| Instrumentation | 38.4 ms | 35.9 ms |
| Sampling | 25.3 ms | 25.0 ms |
Because of the fundamental differences in the methods, the absolute values are expected to be different.
In the next step, we tried to minimize the contribution of the profiling logic in the instrumentation method with the help of small optimizations. In the sampling method, we shortened the time between ticks (setSamplingInterval method). The picture has not changed. Calls close to the root of the tree had similar indicators, but the farther away the calls were from the root, the more they differed.
findings
Deeper calls correspond to functions called many times. For them, the measurement error is equal to the product of the method error and the number of calls, so small changes in the overall picture do not change.
We can assume that the sampling method often underestimates the indicators. Instrumentation method overstates performance by construction. Probably, when profiling a code with a low call tree, both methods will show similar results, but in the general case you should not expect this.
Despite the difference in absolute results, the relative values for specific blocks turned out to be close. Both methods showed the same list of "braking" blocks. “Guided experiments” were designed as “tools” for profiling our PRIV code.
The optimization cycle in general looked like this:
- Run the tool.
- If the required level of code performance is reached - the end.
- Find braking block functions.
- Optimize block functions.
- To the begining.
As a result, we optimized a number of blocks, and the updated code has ceased to yield to the speed of the old implementation.
Here are the current numbers for the serp-item (recall, the indicator for the entire page of search results is obtained by multiplying by 10):
| method | desktop | tablet |
|---|---|---|
| Instrumentation | 35.1 ms (-3.3) | 34.8 ms (-1.1) |
| Sampling | 24.9 ms (-0.4) | 24.8 ms (-0.2) |
Instead of conclusion
Strictly speaking, we had a simple case - profiling simple flat functions. In the case of profiling code with objects and inheritance or asynchronous code, it will be much more difficult to understand dependencies and to draw conclusions about the contribution of individual parts to the total program execution time.
If we have a task to profile more complex code, there will be an appropriate solution, which we will definitely describe here.
Source: https://habr.com/ru/post/282159/
All Articles