IL2CPP: Tips on debugging generated code
In the third article in the IL2CPP series, we will discuss some useful tips for debugging the generated C ++ code: how to set breakpoints, view the contents of strings and user-defined types, and identify the places where exceptions occur.
Note that in itself, debugging C ++ code generated from .NET IL code is not a pleasant task. However, the tips below will help you understand how the Unity project code runs on the target device (at the end of the article, we'll also talk a little about debugging managed code).
Be prepared that the generated code in your project may differ from what you see here. In each new version of Unity, we are trying to optimize the generated code and make it even more compact and productive.

Preparation for work
')
In this article I will use the version of Unity 5.0.1p3 on OSX. As an example, I will take a project from the previous article , but this time I will assemble it for the target iOS platform using the IL2CPP script engine. As in the previous article, I turned on the Development Player option so that il2cpp.exe generates type and method names in C ++ code based on names in IL code.
Once Unity has generated the project, you can open it in Xcode (I have version 6.3.1 installed, but another actual version will do), select the target device (iPad Mini 3 or any device on iOS) and build.
Breakpoint Layout
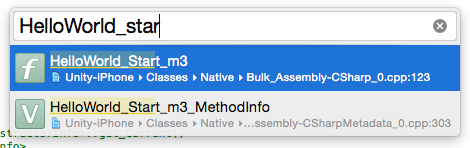
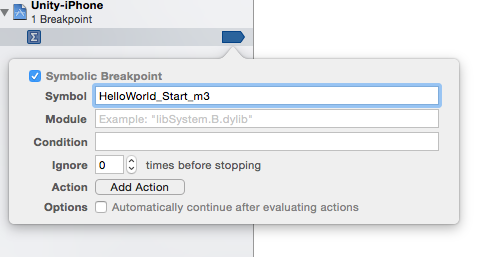
Before starting the project, I will set a breakpoint at the beginning of the Start method in the HelloWorld class. As you can see in the previous article, in the generated C ++ code, this method is called HelloWorld_Start_m3. Pressing Cmd + Shift + O, we start typing the name of the method to find it in Xcode, and then we set a breakpoint in it.
You can do the same by choosing Debug> Breakpoints> Create Symbolic Breakpoint (Debugging> Breakpoints> Create Character Breakpoint).
Now, when I run the Xcode project, it stops at the very beginning of the method.
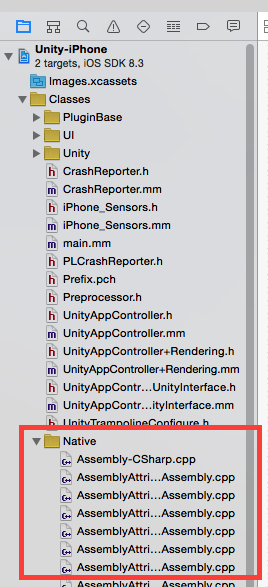
Similarly, breakpoints can be put on other methods of the generated code, if you know their names. Moreover, Xcode allows you to set breakpoints directly on file lines. All generated files can be found in the Xcode project - to do this, go to the Classes / Native directory in the project navigator.
View rows
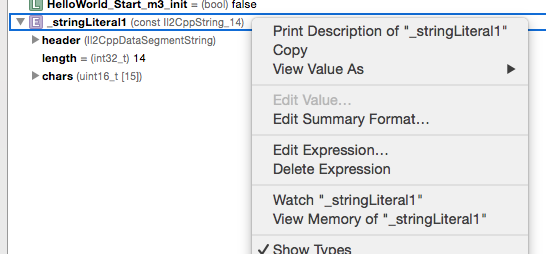
You can view the IL2CPP string representation in Xcode in two ways: directly or using the utility from libil2cpp, which converts the strings to std :: string objects for display in Xcode. Let's look at the value of the string named _stringLiteral1.
Using the built-in utility Ctags (or the Cmd + Ctrl + J commands in Xcode), we can proceed to the definition of _stringLiteral1 with type Il2CppString_14:
Virtually all lines in IL2CPP have this view. The definition of Il2CppString is in the object-internals.h header file. First comes the standard header of any managed type in IL2CPP - Il2CppObject (accessed using the typedef Il2CppDataSegmentString declaration), then a four-byte string length and an array of two-byte characters in UTF-16 format. Strings defined during compilation, such as_stringLiteral1, receive an array of characters of a fixed length, and those generated at runtime receive a selected array.
Add _stringLiteral1 to the Watch window and select the View Memory of “_stringLiteral1” option to view the representation of the string in memory.
Here is what we see in the Memory Viewer:

The string header is 16 bytes. It is followed by 4 bytes for the size of the string with the value 0x000E (14). The next byte after them is the first character of the string, 0x0048 (H). Theoretically, one character takes 2 bytes, but each character in this line is placed in a byte, so they are delimited by dots in the view on the right. However, everything is very legible. This method certainly works, but is not very well suited for long strings.
You can also view the contents of a string using the lldb debugger in Xcode. The utils / StringUtils.h header provides us with an interface for useful utilities from libil2cpp. For example, let's call the Utf16ToUtf8 method from the lldb command line. Its interface looks like this:
We can pass the chars element of the C ++ structure to this method, and it will return it as an object of std :: string in the format UTF-8. In this case, you can print the contents of the string using the p command at the lldb prompt.
View custom types
In addition, we can view the contents of custom types. In a simple script I wrote for this project, there is a C # type with the name Important and an InstanceIdentifier field. If you put a breakpoint immediately after creating the second instance of this type, you can see that the value of the InstanceIdentifier field in the generated code naturally becomes 1.
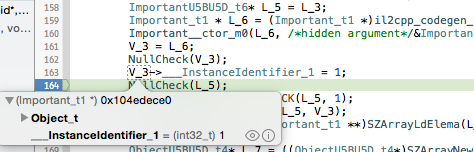
Thus, you can view the contents of custom types in the generated code in the same way as in C ++ code in Xcode.
Aborting code execution on exception
I often have to debug the generated code to track down the cause of the error, and in most cases, managed exceptions are involved. As I said before, C ++ exceptions are used to implement managed exceptions in IL2CPP. In Xcode, there are several ways to interrupt code execution in this situation.
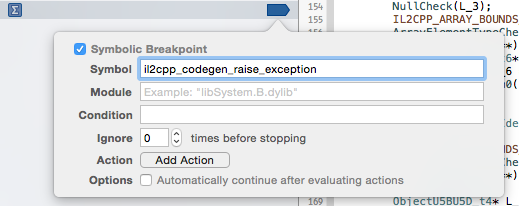
The easiest way is to set a breakpoint on the il2cpp_codegen_raise_exception function, which il2cpp.exe uses whenever a managed exception is thrown.
If you then allow the project to run, Xcode will stop it when the Start method code throws an InvalidOperationException exception. In this case, it may be very useful to look at the contents of the line. For example, in the ex argument, you might notice the element ___message_2, which points to a string with an exception message.
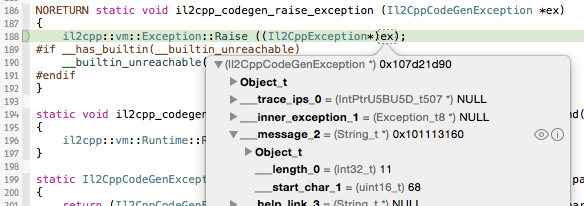
Using the above steps, you can display the contents of this line to find out the cause of the problem:
Note that this line is very similar to the one I showed above, but the names of the generated fields are slightly different. The chars field is ___start_char_1 and is of type uint16_t, not uint16_t []. However, this is still the first character of the array, and we can pass its address to the conversion function.
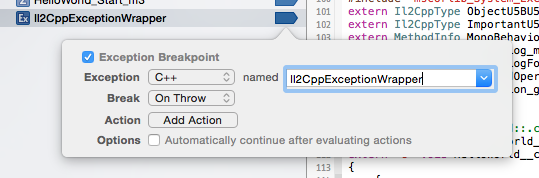
However, the generated code does not throw all managed exceptions. The runtime code libil2cpp does this only in some cases, and then without calling the il2cpp_codegen_raise_exception function. How then to intercept them?
By creating an exception breakpoint (Debug> Breakpoints> Create Exception Breakpoint), you can select C ++ exceptions in its parameters so that the execution of the code is interrupted when an exception of type Il2CppExceptionWrapper is issued. Thus, we will be able to intercept any managed exception, since all of them are wrapped in a C ++ type.
To check how this works, add the following 2 lines to the beginning of the Start method:
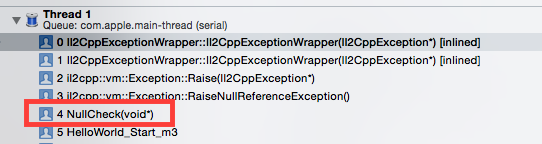
The second line will throw a NullReferenceException. By running this code in Xcode (after setting an exception breakpoint), we will see that its execution will really stop when an exception is thrown. However, the breakpoint is in the libil2cpp code, so we will only see the assembler code. In the call stack, we need to go up a few frames up to the NullCheck method, which is implemented by il2cpp.exe.
At this stage, we can go back one frame and see that an instance of the type of Important is really worth the value NULL.
Conclusion
I hope these tips have helped you understand how to keep track of issues in the C ++ code generated by IL2CPP. To better understand this debugging, I recommend delving into the other types used in the IL2CPP.
You may ask what about the managed code debugger. It's really nice to be able to debug managed IL2CPP code on a device.
And we already have an alpha version of the integrated debugger for the IL2CPP. We continue to work on it, so stay tuned.
In the next article in this series, we will look at several ways to implement method calls in IL2CPP and compare them in terms of performance.
Note that in itself, debugging C ++ code generated from .NET IL code is not a pleasant task. However, the tips below will help you understand how the Unity project code runs on the target device (at the end of the article, we'll also talk a little about debugging managed code).
Be prepared that the generated code in your project may differ from what you see here. In each new version of Unity, we are trying to optimize the generated code and make it even more compact and productive.
Preparation for work
')
In this article I will use the version of Unity 5.0.1p3 on OSX. As an example, I will take a project from the previous article , but this time I will assemble it for the target iOS platform using the IL2CPP script engine. As in the previous article, I turned on the Development Player option so that il2cpp.exe generates type and method names in C ++ code based on names in IL code.
Once Unity has generated the project, you can open it in Xcode (I have version 6.3.1 installed, but another actual version will do), select the target device (iPad Mini 3 or any device on iOS) and build.
Breakpoint Layout
Before starting the project, I will set a breakpoint at the beginning of the Start method in the HelloWorld class. As you can see in the previous article, in the generated C ++ code, this method is called HelloWorld_Start_m3. Pressing Cmd + Shift + O, we start typing the name of the method to find it in Xcode, and then we set a breakpoint in it.
You can do the same by choosing Debug> Breakpoints> Create Symbolic Breakpoint (Debugging> Breakpoints> Create Character Breakpoint).
Now, when I run the Xcode project, it stops at the very beginning of the method.
Similarly, breakpoints can be put on other methods of the generated code, if you know their names. Moreover, Xcode allows you to set breakpoints directly on file lines. All generated files can be found in the Xcode project - to do this, go to the Classes / Native directory in the project navigator.
View rows
You can view the IL2CPP string representation in Xcode in two ways: directly or using the utility from libil2cpp, which converts the strings to std :: string objects for display in Xcode. Let's look at the value of the string named _stringLiteral1.
Using the built-in utility Ctags (or the Cmd + Ctrl + J commands in Xcode), we can proceed to the definition of _stringLiteral1 with type Il2CppString_14:
struct Il2CppString_14 { Il2CppDataSegmentString header; int32_t length; uint16_t chars[15]; }; Virtually all lines in IL2CPP have this view. The definition of Il2CppString is in the object-internals.h header file. First comes the standard header of any managed type in IL2CPP - Il2CppObject (accessed using the typedef Il2CppDataSegmentString declaration), then a four-byte string length and an array of two-byte characters in UTF-16 format. Strings defined during compilation, such as_stringLiteral1, receive an array of characters of a fixed length, and those generated at runtime receive a selected array.
Add _stringLiteral1 to the Watch window and select the View Memory of “_stringLiteral1” option to view the representation of the string in memory.
Here is what we see in the Memory Viewer:
The string header is 16 bytes. It is followed by 4 bytes for the size of the string with the value 0x000E (14). The next byte after them is the first character of the string, 0x0048 (H). Theoretically, one character takes 2 bytes, but each character in this line is placed in a byte, so they are delimited by dots in the view on the right. However, everything is very legible. This method certainly works, but is not very well suited for long strings.
You can also view the contents of a string using the lldb debugger in Xcode. The utils / StringUtils.h header provides us with an interface for useful utilities from libil2cpp. For example, let's call the Utf16ToUtf8 method from the lldb command line. Its interface looks like this:
static std::string Utf16ToUtf8 (const uint16_t* utf16String); We can pass the chars element of the C ++ structure to this method, and it will return it as an object of std :: string in the format UTF-8. In this case, you can print the contents of the string using the p command at the lldb prompt.
(lldb) p il2cpp::utils::StringUtils::Utf16ToUtf8(_stringLiteral1.chars) (std::__1::string) $1 = "Hello, IL2CPP!" View custom types
In addition, we can view the contents of custom types. In a simple script I wrote for this project, there is a C # type with the name Important and an InstanceIdentifier field. If you put a breakpoint immediately after creating the second instance of this type, you can see that the value of the InstanceIdentifier field in the generated code naturally becomes 1.
Thus, you can view the contents of custom types in the generated code in the same way as in C ++ code in Xcode.
Aborting code execution on exception
I often have to debug the generated code to track down the cause of the error, and in most cases, managed exceptions are involved. As I said before, C ++ exceptions are used to implement managed exceptions in IL2CPP. In Xcode, there are several ways to interrupt code execution in this situation.
The easiest way is to set a breakpoint on the il2cpp_codegen_raise_exception function, which il2cpp.exe uses whenever a managed exception is thrown.
If you then allow the project to run, Xcode will stop it when the Start method code throws an InvalidOperationException exception. In this case, it may be very useful to look at the contents of the line. For example, in the ex argument, you might notice the element ___message_2, which points to a string with an exception message.
Using the above steps, you can display the contents of this line to find out the cause of the problem:
(lldb) p il2cpp::utils::StringUtils::Utf16ToUtf8(&ex->___message_2->___start_char_1) (std::__1::string) $88 = "Don't panic" Note that this line is very similar to the one I showed above, but the names of the generated fields are slightly different. The chars field is ___start_char_1 and is of type uint16_t, not uint16_t []. However, this is still the first character of the array, and we can pass its address to the conversion function.
However, the generated code does not throw all managed exceptions. The runtime code libil2cpp does this only in some cases, and then without calling the il2cpp_codegen_raise_exception function. How then to intercept them?
By creating an exception breakpoint (Debug> Breakpoints> Create Exception Breakpoint), you can select C ++ exceptions in its parameters so that the execution of the code is interrupted when an exception of type Il2CppExceptionWrapper is issued. Thus, we will be able to intercept any managed exception, since all of them are wrapped in a C ++ type.
To check how this works, add the following 2 lines to the beginning of the Start method:
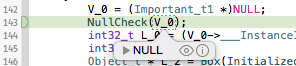
Important boom = null; Debug.Log(boom.InstanceIdentifier); The second line will throw a NullReferenceException. By running this code in Xcode (after setting an exception breakpoint), we will see that its execution will really stop when an exception is thrown. However, the breakpoint is in the libil2cpp code, so we will only see the assembler code. In the call stack, we need to go up a few frames up to the NullCheck method, which is implemented by il2cpp.exe.
At this stage, we can go back one frame and see that an instance of the type of Important is really worth the value NULL.
Conclusion
I hope these tips have helped you understand how to keep track of issues in the C ++ code generated by IL2CPP. To better understand this debugging, I recommend delving into the other types used in the IL2CPP.
You may ask what about the managed code debugger. It's really nice to be able to debug managed IL2CPP code on a device.
And we already have an alpha version of the integrated debugger for the IL2CPP. We continue to work on it, so stay tuned.
In the next article in this series, we will look at several ways to implement method calls in IL2CPP and compare them in terms of performance.
Source: https://habr.com/ru/post/281829/
All Articles