Introduction to Riemann: Event Monitoring and Analysis

In previous articles, we have repeatedly addressed the issues of monitoring, collecting and
storage metrics (see, for example, here and here ). Today we would like to return to this topic again and tell you about an unusual, but very interesting tool - Riemann .
Compared to other monitoring systems, it is characterized by increased complexity,
and at the same time much more flexibility and resiliency. On the Internet, we have come across publications where Riemann is described as "the most flexible monitoring system in the world." Riemann is well suited for collecting information on the operation of complex high-load systems in real time.
')
In fact, the monitoring system in the strict sense of Riemann is not. It would be more correct to call it the event processor.
It collects information about events from hosts and applications, combines events into a stream and sends them to other applications for further processing or storage. Riemann also monitors the status of events, which allows you to create checks and send notifications.
Riemann is distributed free under the Eclipse license. Most of the code is written by Kyle Kingsbury, also known under the pseudonym Aphyr (by the way, we recommend reading his blog: there are often interesting materials there).
Real-time event handling
The growth of interest in the problems of monitoring, collecting, storing and analyzing metrics, which we have been seeing recently, is quite understandable: computing systems are becoming more complex and heavier. In the case of high-load systems, the ability to track events in real time is of particular importance. Actually, Riemann was created in order to solve this problem.
The idea of processing events in a mode close to real time is not new: the first attempts at its implementation were made in the late 1980s. As an example, we can call the so-called Active Database Systems (active database systems), which performed a certain set of instructions if the incoming data in the database corresponded to a specified set of conditions.
In the 1990s, Data Stream Management Systems , which could already process incoming data in real time, and Complex Event Processing (CEP) systems appeared. Such systems could both detect events based on external data and internal logic, as well as perform certain analytical operations (for example, count the number of events for a certain period of time).
Examples of modern tools for handling complex events are, in particular, Storm (see also the article about it in Russian ) and Esper . They are focused on data processing without storage. Riemann is a product of the same class. Unlike the Storm, it is much simpler and more logical: the entire event-handling logic can be described in just one configuration file.
For many system administrators and practitioners, this feature may scare away: the configuration file is in fact a code in the Clojure language, but with which Riemann is also written.
Clojure refers to functional (and even more precisely - lispoobrazny) programming languages, which in itself is alarming. However, there is nothing scary about this: with all its uniqueness, Clojure is not as complicated as it seems at first glance. Consider its features in more detail.
Little Clojure
Clojure is a functional language based on LISP. Programs written in Clojure run on the JVM platform. The first version of this language appeared in 2007. Most recently, the latest version to date - 1.8.0.
Clojure is used in projects of companies such as Facebook, Spotify, SoundCloud, Amazon and others (see the official website for the full list).
Unlike other implementations of LISP for JVM (for example, ABCL or Kawa), Clojure is not fully compatible with either Common Lisp or Scheme, but it borrows a lot from these languages in it. There are some improvements in Clojure that are not found in other modern LISP dialects: data immutability, competitive code execution, etc.
Since Clojure was originally designed to work with JVM, it can work with numerous libraries that exist for this platform. Interaction with Java is implemented in both directions. You can call code written for Java. It is also possible to implement classes that are available for calling from Java and other JVM-based programming languages — for example, for Scala. More details about Clojure and its capabilities can be found in this article , as well as on the official website of Riemann . We also recommend that you familiarize yourself with another brief, but very informative introduction to Clojure .
Installation and first launch
To work with Riemann, we first need to install all the necessary
dependencies: Java and Ruby (some additional components are written on it, which will be discussed below):
$ sudo apt-get -y install default-jre ruby-dev build-essential Next, download and install the latest version of Riemann:
$ wget https://aphyr.com/riemann/riemann-0.2.10_all.deb $ dpkg -i riemann-0.2.10_all.deb Next, run:
$ sudo service riemann start For full-fledged work, we also need to install components for collecting and metrics written in Ruby:
$ gem install riemann-client riemann-tools That's all. To get started with Riemann everything is ready. Before turning to the practical part, let us make a small theoretical digression and clarify the meaning of the most important concepts: events, flows and index.
Events, Threads and Index
The basic concept in Riemann is an event. Events can be processed, counted, collected and exported to other programs. An event might look like this:
{:host riemann, :service riemann streams rate, :state ok, :description nil, :metric 0.0, :tags [riemann], :time 355740372471/250, :ttl 20} The given event consists of the following fields:
- : host - host name;
- : service - the name of the observed service;
- : state - event state (ok, warning, critical);
- : tags - event tags;
- : time - the time of the event in the Unix Timestamp format;
- : description - description of the event in any form;
- : metric - metric associated with the event;
- : ttl - time of event relevance (in seconds).
Some events can also have custom fields that can be added both during creation and during event processing (for example, fields with additional metrics).
All events are combined into streams. A thread is a function to which an event can be passed.
You can create an unlimited number of threads. Events pass through streams, but are not saved in them. However, it is often necessary to monitor the status of events - for example, they have lost relevance or not. For this, an index is used - a table of states of monitored events In the index, events are sorted by groups by host and by service, for example:
:host www, :service apache connections, :state nil, :description nil, :metric 100.0, :tags [www], :time 466741572492, :ttl 20 This event occurred on the host www in the service apache connections. The index always stores the most recent event. Indexes can be accessed from threads and even from external services.
We have already seen that each event contains a TTL (time to live) field. TTL is the length of time that an event is relevant. In the example just given, the TTL event is 20 seconds. All events with parameters: host www and: service apache connections fall into the index. If no such event occurs within 20 seconds, a new event will be created with the value expired in the state field. It will then be added to the stream.
Configuration
Let's move from theory to practice and do the configuration of Riemann. Open the configuration /etc/riemann/riemann.config. It is a Clojure program and by default looks like this:
; -*- mode: clojure; -*- ; vim: filetype=clojure (logging/init {:file "/var/log/riemann/riemann.log"}) ; Listen on the local interface over TCP (5555), UDP (5555), and websockets ; (5556) (let [host "127.0.0.1"] (tcp-server {:host host}) (udp-server {:host host}) (ws-server {:host host})) ; Expire old events from the index every 5 seconds. (periodically-expire 5) (let [index (index)] ; Inbound events will be passed to these streams: (streams (default :ttl 60 ; Index all events immediately. index ; Log expired events. (expired (fn [event] (info "expired" event)))))) This file is divided into several sections. Each section begins with a comment, denoted, as is customary in Clojure, by a semicolon (;).
The first section contains the file to which logs will be written. Next comes the section with the interfaces. Usually, Riemann listens on a TCP, UDP, and web interface. By default, they are all bound to the local host (127.0.0.1).
The following section contains settings for events and index:
(periodically-expire 5) (let [index (index)] ; Inbound events will be passed to these streams: (streams (default :ttl 60 ; Index all events immediately. index The first function (periodically-expire) removes from the index all events for which the period of relevance has expired, and assigns them the status expired. Event clearing runs every 5 seconds.
By default, Riemann copies to the events with expired relevance of the field: service and: host. You can copy and other fields; for this you need to use the option: key-keys with the function periodically-expired. So, for example, we can order to save not only the host name and service name, but also tags:
(periodically-expire 5 {:keep-keys [:host :service :tags]}) The following is a construction in which we define a symbol named index. The value of this symbol is index, i.e. this is the function that sends events to the index. It is used to tell Riemann when to index an event.
We use streams to describe streams. Each thread is a function that takes an event as an argument. The streams function indicates Riemann: "here is a list of functions that need to be called when adding new events." Inside this function, we set the TTL for events - 60 seconds. To do this, we used the default function, which takes a field from the event and allows you to set a default value for it. Events that do not have a TTL will receive expired status.
Then the default configuration calls the symbol index. This means that all incoming events will be added to the index automatically.
The final section contains an instruction to log events with the status of expired:
; Log expired events. (expired (fn [event] (info "expired" event)))))) Let's make some changes to the configuration file. In the section on network interfaces, replace 127.0.0.1 with 0.0.0.0 so that Riemann can receive events from any host.
At the very end of the file, add:
;print events to the log (streams prn #(info %)) This is the prn function that will write events to logs and to standard output. After that, save the changes and restart Riemann.
In a situation when you have to monitor the work of the server set, you can create not a common configuration file, but a whole directory with separate files for each server or group of servers (see recommendations in this article ).
A detailed instruction on writing a configuration file can be found here .
Sending data to Riemann
Now let's try to send data to Riemann. We use for this the client riemann-health, which is included in the previously installed riemann-tools package. Open another terminal tab and execute:
$ riemann-health This command sends Riemann data on the status of the host (CPU load, amount of used disk space, amount of used memory).
Riemann will start accepting events. Information about these events will be recorded in the /var/log/riemann/riemann.log file. It is presented as follows:
#riemann.codec.Event{:host "cs25706", :service "disk /", :state "ok", :description "8% used", :metric 0.08, :tags nil, :time 1456470139, :ttl 10.0} INFO [2016-02-26 10:02:19,571] defaultEventExecutorGroup-2-1 - riemann.config - #riemann.codec.Event{:host cs25706, :service disk /, :state ok, :description 8% used, :metric 0.08, :tags nil, :time 1456470139, :ttl 10.0} #riemann.codec.Event{:host "cs25706", :service "load", :state "ok", :description "1-minute load average/core is 0.02", :metric 0.02, :tags nil, :time 1456470139, :ttl 10.0} Riemann-health is just one of the utilities in the riemann-tools package. It includes a fairly large number of utilities for collecting metrics: riemann-net (for monitoring network interfaces), riemann-diskstats (for monitoring I / O subsystem), riemann-proc (for monitoring processes under Linux), and others. A complete list of utilities can be found here .
Create the first check
So, Riemann is installed and running. Now let's try to create the first check. Open the configuration file and add the following lines to it:
(let [index (index)] (streams (default :ttl 60 index ;#(info %) (where (and (service "disk /") (> metric 0.10)) #(info "Disk space on / is over 10%!" %)) The function (#info) is preceded by a comment sign - a semicolon (;). This is done so that Riemann does not record every event in the log. Next, we describe the where stream. It gets events that meet a given criterion. In our example, there are two such criteria:
- field: service must be disk /;
- field value: metric must be greater than 0.10 or 10%.
They are then passed to the child stream for further processing. In our case, information about such events will be recorded in the /var/log/riemann/riemann.log file.
Filtering: quick reference
Without event filtering, full-fledged work with Riemann is impossible, so it’s worth saying a few words about it.
Let's start by filtering events using regular expressions. Consider the following example describing the where stream:
where (service #”^nginx”)) In Clojure, regular expressions are # and are enclosed in double quotes. In our example, expressions with the name nginx in the field: service will be included in the where stream.
Events in the where stream can be combined using logical operators:
(where (and (tagged "www") (state "ok"))) In this example, events with a www tag and value ok in the state field will fall into the where stream. They are combined with tagged stream events.
Tagged is the abbreviated name of the tagged-all function, which combines all events with the given tags. There is another tagged-any function - it combines events marked with one or more of the specified tags into the stream:
(tagged-any ["www" "app1"] #(info %)) In our example, events tagged with www and app1 will be tagged in the stream.
With respect to events, you can perform mathematical operations, for example:
(where (and (tagged "www") (>= (* metric 10) 5))) In this example, there will be events with events with the www tag, for which the field value: metric multiplied by 10 will be greater than 5.
Similar syntax can be used to select events whose values in the: metric field fall within the specified range:
(where (and (tagged "www") (< 5 metric 10))) In the given example, events with the www tag, for which the field value: metric is in the range of 5 —10, will fall into the where stream.
Configure Notifications
Riemann can send notifications in case of compliance with specified test conditions. Let's start by setting up email notifications. In Riemann, the email function is used for this:
[
(def email (mailer {:from "riemann@example.com"})) (let [index (index)] ; Inbound events will be passed to these streams: (streams (default :ttl 60 ; Index all events immediately. index (changed-state {:init "ok"} (email "andrei@example.com"))))) Notifications are sent to Riemann on the basis of a special Clojure - Postal library. By default, a local mail server is used for mailing.
All messages will be sent from the address of the form riemann@example.com.
If the local mail server is not installed, Riemann will display an error message of the form:
riemann.email$mailer$make_stream threw java.lang.NullPointerException In the example code above, we used the changed-state label and thus indicated that Riemann should track events whose state has changed. The value of the init variable tells Riemann how the initial state of the event was. All events that have changed from ok to something else will be sent to the email function. Information about such events will be sent to the specified email address.
More detailed examples of setting up notifications can be found in the article by James Turnbull , one of the developers of Riemann.
Visualization of metrics: riemann-dash
Riemann has its own tool for visualizing metrics and building simple dashboards - riemann-dash. You can install it like this:
$ git clone git://github.com/aphyr/riemann-dash.git $ cd riemann-dash $ bundle Run riemann-dash with the command:
$ riemann-dash The riemann-dash home page is available in the browser at [ip-address of the server]: 4567:
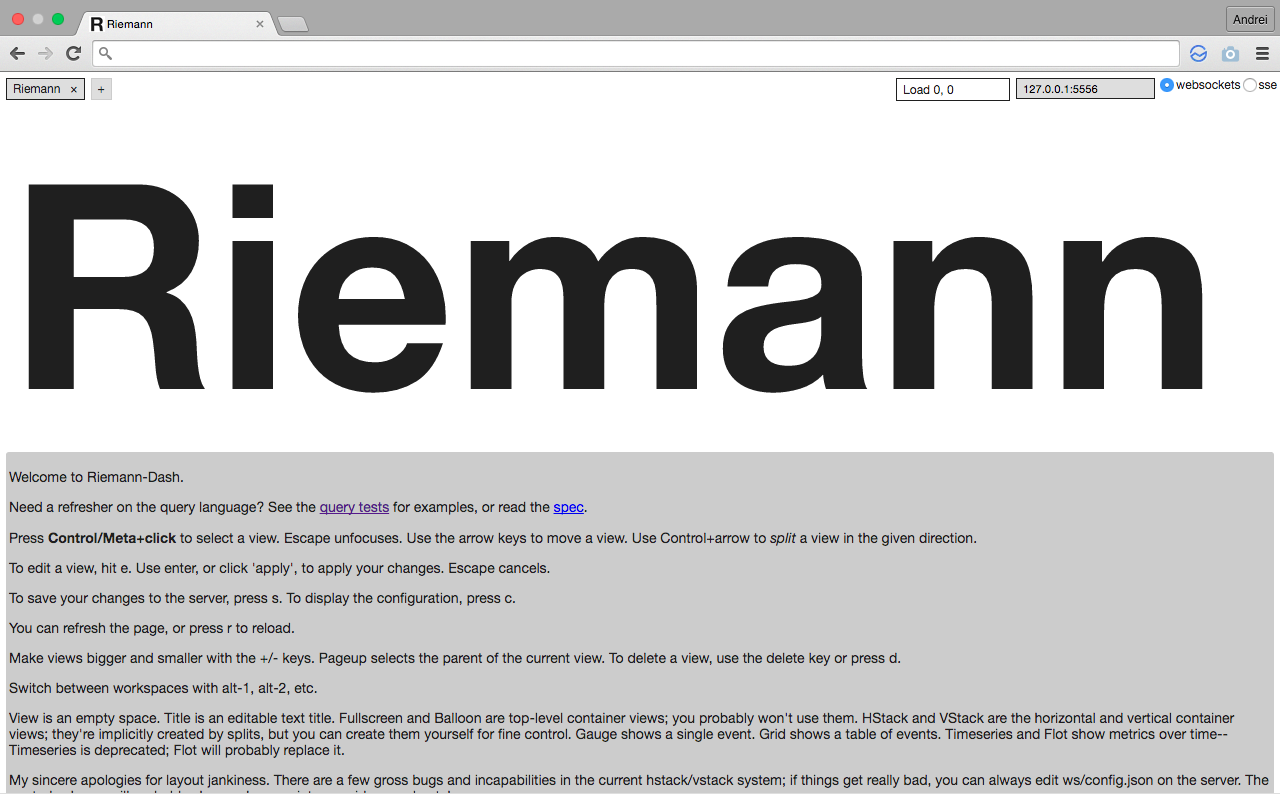
Let's go to the black Riemann inscription in the very center, press the Ctrl key (on Mac - cmd) and click on it. The inscription will be highlighted in gray. After that, press the E key to start editing:

In the drop-down menu, title, select the Grid item, and in the query field, write true:
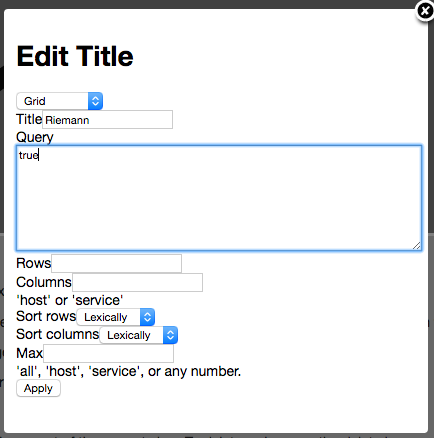
Having set the necessary settings, click on the Apply button:
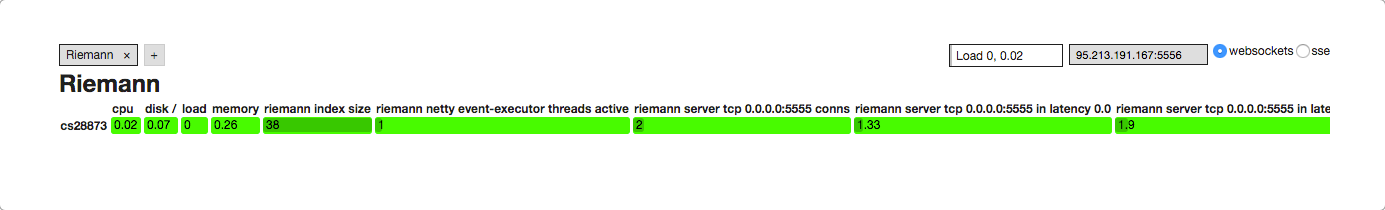
Dashboards are not very aesthetic and comfortable, but quite intuitive. The inconvenience, however, is compensated by the fact that third-party visualization tools can be used with Riemann, d in particular Graphite and Grafana - the interested reader can easily find relevant publications on the Internet. And we will describe the procedure for setting up the Riemann + InfluxDB + Grafana bundle in the next section.
Sending data to InfluxDB
The undoubted advantage of Riemann is its wide integration possibilities. Metrics collected with it can be sent to third-party repositories. Below we show how to integrate Riemann with InfluxDB and customize data visualization with Grafana.
Install InfluxDB:
$ wget https://s3.amazonaws.com/influxdb/influxdb_0.9.6.1_amd64.deb $ sudo dpkg -i influxdb_0.9.6.1_amd64.deb You can read more about InfluxDB configuration in the official documentation , as well as in one of our previous articles .
After the installation is completed, run the command:
$ sudo /etc/init.d/influxdb start Then create a database for storing data from Riemann:
$ sudo influx >CREATE DATABASE riemann Create a user for this database and set a password for it:
>CREATE USER riemann WITH PASSWORD ' riemann' >GRANT ALL ON riemann TO riemann That's it, the installation and basic configuration of InfluxDB is complete. Now you need to register the necessary settings in the Riemann configuration file (the code is taken from here and slightly modified):
; -*- mode: clojure; -*- ; vim: filetype=clojure ; capacitor, InfluxDB (require 'capacitor.core) (require 'capacitor.async) (require 'clojure.core.async) (defn make-async-influxdb-client [opts] (let [client (capacitor.core/make-client opts) events-in (capacitor.async/make-chan) resp-out (capacitor.async/make-chan)] (capacitor.async/run! events-in resp-out client 100 10000) (fn [series payload] (let [p (merge payload { :series series :time (* 1000 (:time payload)) ;; s → ms })] (clojure.core.async/put! events-in p))))) (def influx (make-async-influxdb-client { :host "localhost" :port 8086 :username "riemann" :password " riemann" :db "riemann" })) (logging/init {:file "/var/log/riemann/riemann.log"}) (let [host "0.0.0.0"] (tcp-server {:host host}) (udp-server {:host host}) (ws-server {:host host})) (periodically-expire 60) (let [index (index)] (streams index (fn [event] (let [series (format "%s.%s" (:host event) (:service event))] (influx series { :time (:time event) :value (:metric event) }))))) Save the changes and restart Riemann.
After that install Grafana:
$ wget https://grafanarel.s3.amazonaws.com/builds/grafana_2.6.0_amd64.deb $ sudo dpkg -i grafana_2.6.0_amd64.deb We will not give detailed instructions on how to configure Grafana, and there is no special need for this: you can easily find relevant publications on the Internet.
The Grafana home page will be accessible in a browser at http: // [Server IP]: 3000. Then you just need to add a new data source (InfluxDB) and create a dashboard.
Conclusion
In this article, we have presented a brief overview of the possibilities of Riemann. We covered the following topics:
- features of Clojure;
- installation and initial setup of Riemann;
- structure of the configuration file and features of its syntax;
- creating checks;
- setting notifications;
- visualization of metrics with riemann-dash
- Riemann integration with InfluxDB and visualization of metrics with Grafana
If it seems to you that we have missed some important details, write to us and we will complete the review. And if you use Riemann in practice, we invite you to share your experience in the comments.
If for one reason or another you cannot leave comments here - welcome to our corporate blog .
Source: https://habr.com/ru/post/281651/
All Articles