How to determine the best time for a transaction in the stock market: Trend following algorithms

Over the years, stock market participants have been trying to develop ways to predict future price movements. To do this, use special algorithms and software , machine learning, or even external services like Google Trends . To date, there is no technology to create forecasts, which would be 100% effective.
Researchers from the University of Macau a few years ago published a paper on the analysis of the effectiveness of trend-following algorithms, which do not attempt to predict price changes, but rather react to its changes in real time. We bring to your attention the main thoughts of this study.
')
Introduction
In general, there are two main approaches to estimating the probability of making such forecasts. The followers of the first of them believe that the market can be predicted by analyzing patterns of price behavior, and the accuracy of the forecast depends on the correct method of detecting these patterns, as well as using the correct set of parameters. The second approach assumes that the stock market is completely random, and it cannot be predicted using mathematical formulas (there is also mathematical evidence that this is not the case).
At the junction of these two "schools" was born the method of following the trend. He suggests that market trends are some random variables. Accordingly, one should not even try to make any forecasts, one only needs to generate buy and sell signals using the analysis of price movements in the long term. This method is widely used in financial markets, where traders use them to determine the moment of opening or closing positions for currency pairs, but it is not widely used in the stock market.
In today's article we will discuss two types of trend following algorithms. The researchers aimed to analyze the effectiveness of the application of these algorithms.
Two ways to analyze the market
There are two methods for predicting stock prices:
- Fundamental analysis - in this case, analysts evaluate information that is more relevant to the company, whose shares are traded on the stock exchange, rather than to the shares themselves. Decisions on certain actions on the market are made based on an analysis of the company's previous activities, revenue and profit forecasts, and so on.
- Technical analysis - in this case, the behavior of the stock price is examined and its various patterns are identified (time series analysis is used).
Many of the methods for predicting prices on the stock market that we considered earlier are in the field of technical analysis. Among the financiers and scientists, there are heated debates about whether it is possible, using the analysis of past prices, to predict their future movement.
The method of following the trend here is an alternative - it does not mean creating forecasts and only responds only to events that happened quite recently or are happening right now, without thinking about the future. At the same time, trade is subject to certain statistical rules - and the main task is to formulate them.
Trend following: basic principles
The success or failure of the trend following algorithm depends on what assumptions lie at its core. First of all, this assumption is the regular occurrence of price trends, which are the result of many factors. The second important point is the ability of the algorithm to benefit from price movements that form trends.
All traders tend to "limit loss" and "maximize profits" - most of all you can earn, synchronized with a powerful trend. And in order to do this, the trader needs to throw aside the emotional part of the trade (“intuition”) - the method of following the trend does not imply guessing the moment of its completion. On the contrary, it is necessary to act immediately after the onset of this moment.
Based on this, the Model Performance Probability Score (PPS) was developed - it combines the analysis of price behavior to create an assessment of risk and possible profit. The core of the model forms a binary separation of price behavior into negative and positive. The basic rule for trading according to this method sounds like holding a positive or negative rating until the moment when a definite change occurs - again, no predictions, just a reaction to change.
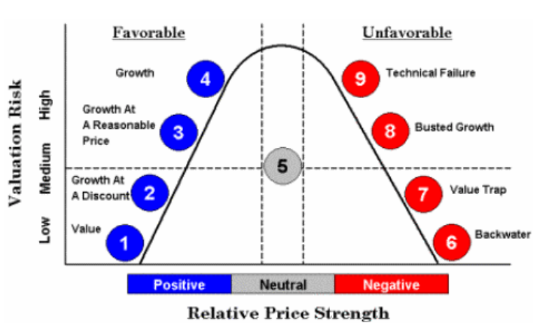
The distribution of price power by trend
How to determine the right time for the transaction
Price changes in the stock market represent an opportunity to increase profits from a transaction or reduce losses in the event of a failed set of circumstances. When a price change is detected that goes against the established trend, a choice arises between immediately closing the position or waiting for confirmation of the current trend reversal and re-entering the position in accordance with the new trend. To automate the process of making such decisions, several important aspects need to be considered.
- Managing transactions - the decision on how much financial asset to buy or sell, must be made on the basis of certain rules. To minimize risks, for example, the volume of transactions may decrease in a period of high volatility or a falling market. The purpose of this is simple - to reduce losses in unsuccessful periods in anticipation of the emergence of more positive trends.
- Market price - the system can use only the market price as input. Some data can be gleaned from the history of trading, but they cannot be used to predict the direction of price changes. To create a trading system using the trend following algorithm, you only need to get the most recent data from the latest quotes. Time and price are the main elements.
- Rules - as mentioned above, you need to limit losses and maximize profits. To do this, within the framework of a trend following system, rules are needed that will not take into account fundamental indicators. They should only automate trading by making decisions about the moment of entry into the market, the time it takes to hold a position, and the moment it exits the position when it stops being profitable.
Based on the PPS model, researchers have developed a new approach to the implementation of such a trading system. It operates on the basis of two signals extracted from the price trend - on the basis of this information, decisions are made on opening and closing positions.
P and Q rules
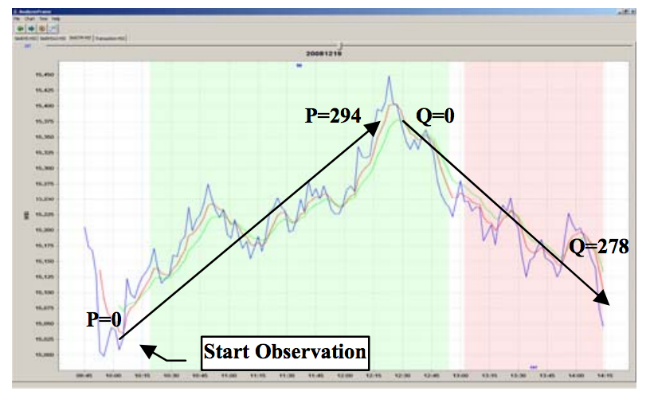
The rules described above for limiting losses and maximizing profit in this case are based on two variables - P and Q. The first one is used to determine when to open a position, and the second one - to exit it. If we denote the market trend as T, which is a function of time t - Price (t).
In this case, the system could open a position when the current Price price turns out to be on a trend above point P, and on the contrary, when it drops below Q level, the position will be closed:
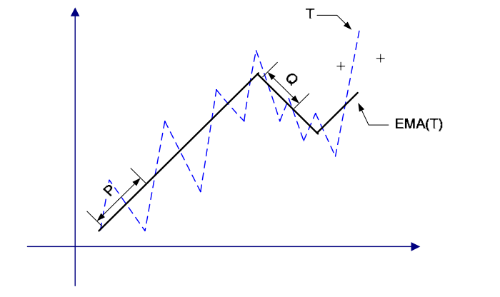
In real life, however, trends do not develop along such clear lines, they are much more volatile, and the price can be briefly raised and lowered below the general trend line. Therefore, the rules P and Q cannot be applied directly to the trend T - frequent price fluctuations will lead to the emergence of a huge number of trading signals to buy and sell. In order to avoid this, an exponential moving average (EMA) is used, which is calculated by the formula:
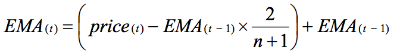
Where price (t) is the current price at time t, n is the number of periods in minutes for intraday trading or in days for off-market trading, and t is the time point in the market. The logic of using P and Q rules and EMA is described by the following pseudocode:
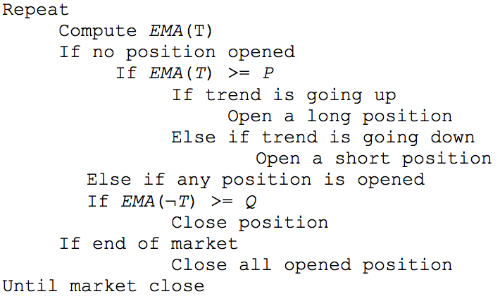
In this case, the values of P and Q are calculated on the basis of historical data. There are several ways to define them. The first of these is the bruteforce method, which involves testing a variety of P and Q combinations. An alternative method is to use neural networks.
The ranges of P and Q values obtained using heuristic measurements
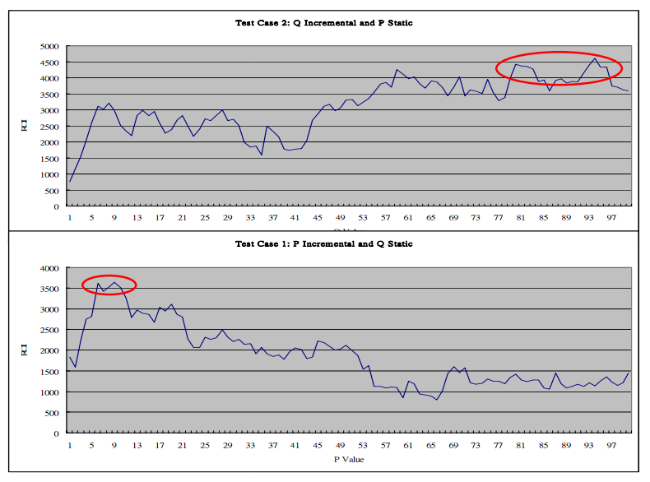
You can choose different values of P and Q, which will generate positive results.
Adaptive rules P and Q
In the previous section, the values of P and Q were obtained by analyzing the values that give the best results over a relatively long time interval. However, it is obvious that the rules that worked well on a certain part of the trend may not be so good on another. This means that the process of choosing P and Q must be modified so that they can be selected dynamically.
The new rules are called P 'and Q' - their values can change dynamically, and do not remain unchanged, as it was before. To determine the moments of entry and exit from the position in this case, you can use some technical analysis tools, such as the relative strength index (RSI). It is calculated by the following formula:
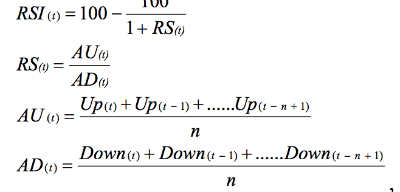
Where AU is the average price increase for n periods, AD is the average price decrease for n periods, n is the number of RSI periods (usually set to 14).
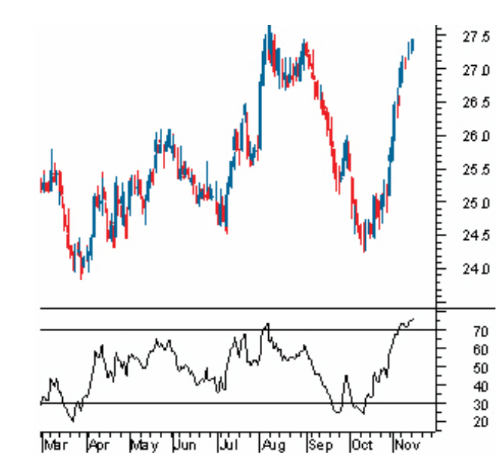
A simple example of use. In the figure below, the RSI has a range from 0 to 100. An asset is considered “overbought” above level 70 - this means that it can be overvalued and is a good candidate for a price drop. Similarly, if the RSI reaches level 30, then this is a sure sign of an undervalued asset.
As a result, using RSI and P & Q adaptive strategy, we can formulate the following rules for opening positions:
To open a long position in P ':
- The price is rising
- RSI (t) is greater than EMA (RSI (t))
- EMA (RSI (t)) less than 40 or above 60
For a short Q position:
- The price is going down
- RSI (t) is less than EMA (RSI (t))
- EMA (RSI (t)) is less than 40 or above 60
The figure below shows an example of opening a long position: at 10:35 it was opened after the relevant conditions were met. At 13:36, the criterion for opening a short position worked, and the long position was closed.
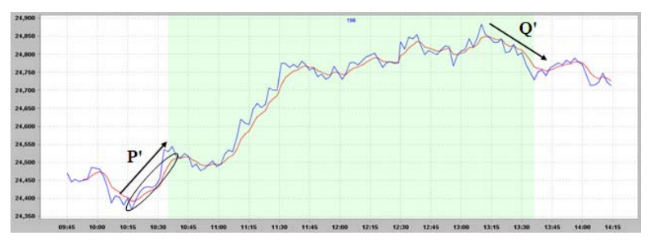
The values of P 'and Q' adaptively and dynamically change according to RSI readings. In the course of trading, the strategy evaluates the fluctuations of the trends and in accordance with them generates signals to buy or sell.
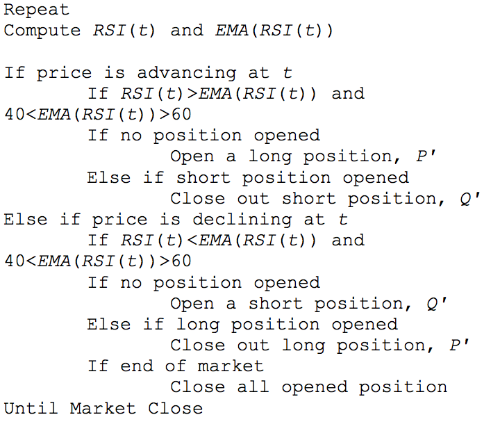
The pseudocode for such a strategy is as follows:
Simulation and results
During the experiment, designed to confirm or deny the performance of the proposed strategy, the researchers launched a simulation to analyze the futures contract on the Hong Kong Stock Exchange index (Hang Seng). Analyzed historical data for 2008, only 355 days. The challenge was to calculate the ROI (return on investment) for trading specific stocks.
The figure below shows the performance of a static and dynamic P & Q strategy:
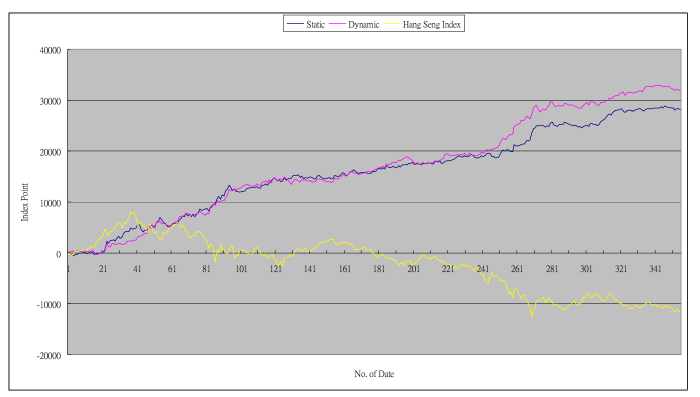
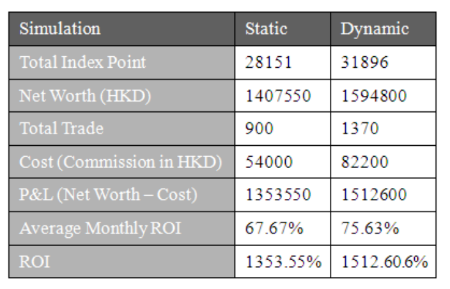
According to the data obtained, the adaptive strategy shows the best results - in the course of the simulation, the average monthly ROI in this case was 75.63%, and for the static strategy - 67.67%.
In addition, the researchers wanted to know how to minimize losses in case of their occurrence. According to the experiment, the probability of losses when using strategies to follow a trend increases with high market volatility. In order to confirm this hypothesis, a simulation of the occurrence of random fluctuations in the market was organized.
According to the results, automated trend following strategies began to work at a loss when the fluctuation rate reached 45%. This means that it is possible to reduce the probability of losses by programming a certain fluctuation threshold into the system, upon reaching which the trade must be stopped.
Source: https://habr.com/ru/post/281515/
All Articles