Free CRC error monitoring
Often, unpleasant things such as an increase in the number of errors on ports and an increase in signal attenuation on sfp modules occur on storage networks. Taking into account the high level of reliability of the SAN infrastructure consisting of two or more factories, the likelihood of an emergency is not so great, but the overlap of negative factors can lead to data loss or performance degradation. For example, imagine a situation: FOS is updated at one of the factories, everything works through a second factory, and between the switchboard to which the disk array is connected and the switchboard to which the servers are connected, the CRC error at one of the trunk ports starts to grow rapidly. Or even worse, the link disappears due to a decrease in the signal level caused by an increase in the temperature of the SFP module, which in turn has increased due to the increased utilization of this channel. In such cases, they usually say: "Well, who knew" or "100% reliable systems do not exist" and so on.
Literate architecture + proper monitoring = fault tolerance
So the problem is indicated, it is necessary to develop a set of measures to improve the resiliency of the storage network, it can be divided into two stages:
- Bringing the storage network architecture to “SAN best practices”
- monitoring system deployment
If there is a lot of literature and training courses about the SAN best practices, and you can invite tough experts from the integrator to conduct an examination, then choosing the right way to create a good SAN monitoring system is not so easy. This can be explained by a tight binding: software developer - manufacturer of switches. Of course, I don’t want to say that Cisco Fabric Manager or Brocade Network Advisor are bad, but they don’t allow me to do everything that is necessary in my opinion to increase the resiliency of the SAN network.
')
What to do
And so, the task has been set, it is necessary to find a solution, often it can be complicated by the lack of money in the budget for this year, or the integrator’s lack of information about the existence of suitable software, but this is not a problem because All the necessary components are freely available and all that is required is to make it all work.
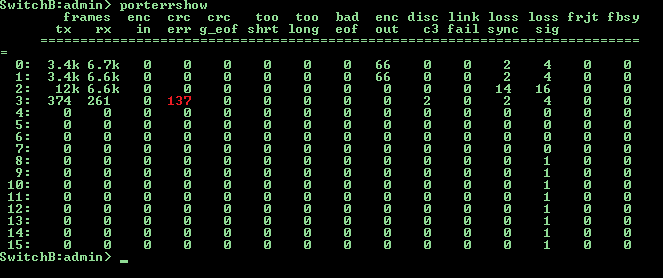
Let us analyze the implementation of CRC error monitoring on brocade switch SAN ports, most of the other parameters can be monitored in the same way.
Step one, data collection protocol
Information about the number of CRC errors can be obtained from the switches in different ways (snmp, https, telnet and ssh). My choice fell on the latter. telnet is not secure and it is better to disable it, https is difficult to extract specific values, and the snmp tree can change significantly both on different switches and when switching to the new FOS.
Step two, data collection method
To work with ssh, linux is best adapted in conjunction with bash + expect; this method can be used to connect via ssh with interactive command entry.
Step three, where to store
There is no big difference, you can store it even in text files, but we will look at an example with mysql. All monitoring is implemented in two scripts:
porterrshow.sh - collecting information and searching for the increment of CRC error values
expect.tcl - ssh connection
and three txt files:
temp.txt - data buffer
switches.txt - a list of san switches in the format login name password on each line
crc.txt - report on CRC errors found
The Select query looks for an increment in the growth of CRC errors compared to the data received one hour ago, respectively, the script must be run once per hour, and the script must begin and finish its work at the same hour. This limitation can be easily circumvented by entering the sequence number field of the script launch, or losing performance and setting a more complicated condition for sampling time values. The expect, mysql and ssh client packages must be installed on the server. The dbname database must contain a user user with read and write permissions to the table tablename. In the table tablename we get data similar to the output of the porterrshow command on the switch + date and time.
porterrshow.sh
#!/bin/bash rm /var/scripts/temp.txt # temp.txt while read line # switches.txt do read sw user pass <<< $line # n=0 # while read line; # expect.tcl do array[n]="$line"; n=$[n+1]; # expect.tcl done < <(/var/scripts/expect.tcl $sw $user $pass porterrshow) # if echo ${array[4]} | grep -q '='; # then k=5; else k=4; fi; for i in `seq $k $[n-1]`; # do read a1 a2 a3 a4 a5 a6 a7 a8 a9 a10 a11 a12 a13 a14 a15 a16 a17 a18 a19 <<< ${array[i]}; # (echo $sw,${a1%:},`date +%F`,`date +%T`,$a2,$a3,$a4,$a5,$a6,$a7,$a8,$a9,$a10,$a11,$a12,$a13,$a14,$a15,$a16,$a17) >> temp.txt # done; done < /var/scripts/switches.txt # mysql -uuser -ppass dbname << EOF; LOAD DATA LOCAL INFILE "temp.txt" INTO TABLE tablename FIELDS TERMINATED BY ','; EOF # (mysql -uuser -ppass dbname << EOF select new.switch, new.port, new.crcerr-old.crcerr from tablename new, tablename old where new.switch=old.switch and new.port=old.port and new.date=old.date and new.crcerr!=old.crcerr and new.crcerr!=0 and new.date=curdate() and hour(new.time)=hour(now()) and hour(old.time)=hour(now())-1; EOF ) > /var/scripts/crc.txt # CRC if grep -q 'switch' /var/scripts/crc.txt then cat /var/scripts/crc.txt | mailx -r SAN_Switch_CRC_Tester -s "CRC errors is increased" sanadmin1@mywork.com fi # expect.tcl
#!/usr/bin/expect # 10 set timeout 10 # if {$argc != 4} { puts "Usage $argv0 host user pass command" exit 1} # set host [lindex $argv 0] set user [lindex $argv 1] set pass [lindex $argv 2] set command [lindex $argv 3] # SSH spawn ssh -oStrictHostKeyChecking=no -oCheckHostIP=no $user@$host $command expect *assword: send "$pass\r" expect eof Source: https://habr.com/ru/post/281432/
All Articles