Metric recommendation system imhonet.ru
The purpose of this story is to share ways to solve the problem that the authors worked on when developing the imhonet.ru reference service. Since the problem is not purely scientific and technical, but rather located at the intersection of technology and business and may be useful to a wider audience than a regular technical report, we chose just such a presentation format for our work - we tried to write the story in as simple a language as possible. The first part of the story is devoted to a fairly detailed justification of how to correctly measure the quality of the workings of the recommender system algorithms. And at the end illustratively listed several examples in which we carried out these measurements to solve specific problems.
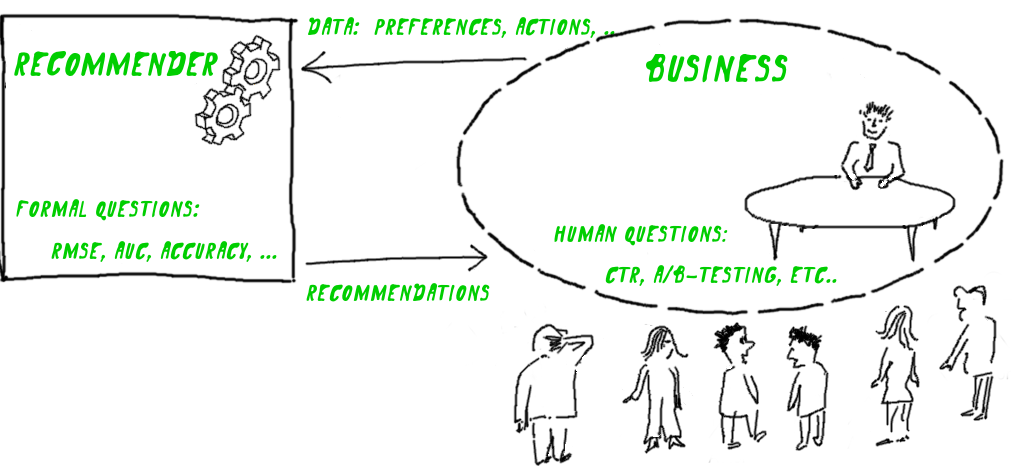
Any recommendation system helps to solve a specific business problem. And the result is measured in ways that are understandable for the business problem - the number of visitors, sales, CTR, etc. However, the quality of the recommender algorithm in this way is too difficult to measure - it will depend on a huge variety of conditions, among which the recommender algorithm itself may be the tenth thing.
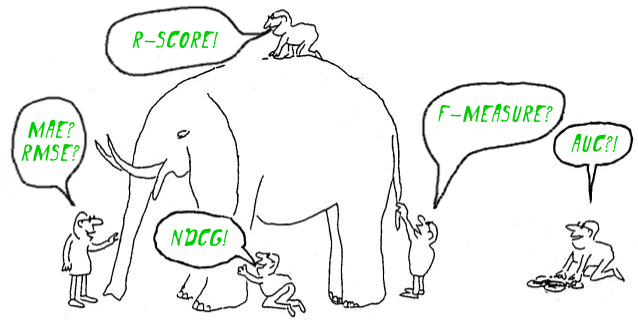
So it turns out that formal numerical criteria for recommender algorithms need to be invented by their developers in isolation from the business task. As a result, the work devoted to recommender systems is full of various useful numerical metrics, but sometimes quite tricky in relation to the problems to be solved.
')
The optimal approach to be discussed is to try to construct a metric directly for a business problem. It is clear that this is easier said than done, so the discussion below will deal with a specific example: how this is done for the reference service of imhonet.ru movies. Although we tested this approach on the films, but it is rather distracted, as can be seen by replacing the film word in the whole next story with something else.
Service product - personal lists of recommended films. The feedback is fairly accurate, and therefore valuable - direct ratings to these films:

It makes sense to use such a good feedback to the fullest. Estimates, for the sake of convenience in terminology, we will sometimes be called "signals of satisfaction."
Why in the task we are talking about the list of recommendations, and, for example, not about one element? Therefore, why the search engine gives a list of links: it does not know the full context of the request. If he knew the full context (for example, the contents of the user's head), then, probably, the only result would make sense, otherwise the part of the work still remains for the author of the request.
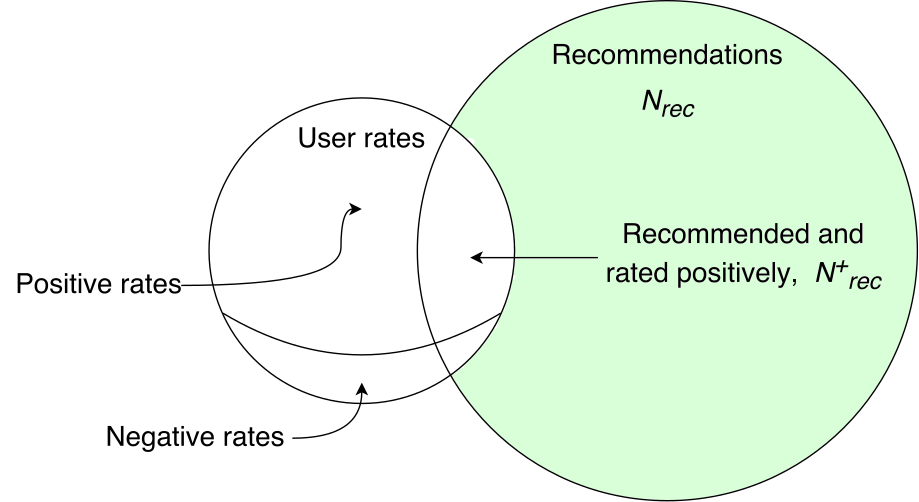
We compare the feedback of users - ratings, with the lists of items that we recommended:

We will need to consider the following situations:
Go through them one by one.
Hit

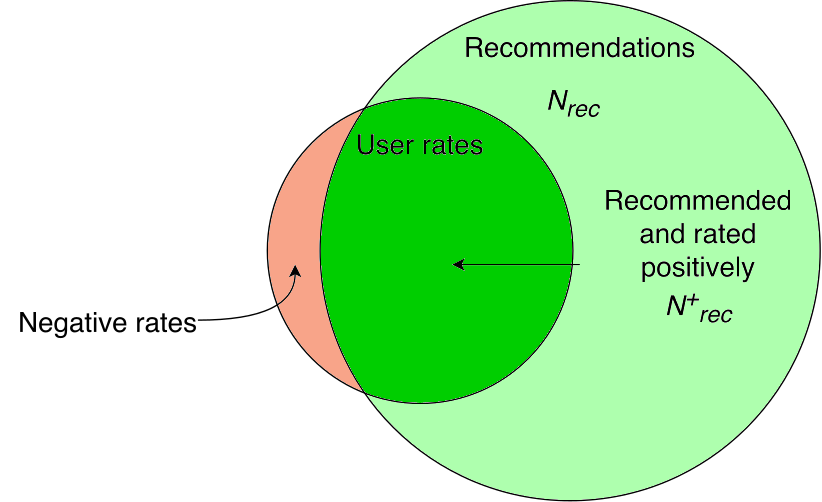
If a film was recommended to a person, and there is a positive signal from him, it means that we hit exactly. It is precisely such cases that interest us, so let's call them successes and maximize their number:
Mishit

The film that was recommended and received a negative signal is an example of the cases that we should avoid. It is even possible that avoiding such cases is more important than maximizing the number of cases of success.
This is a bit unexpected, but practice has shown that such cases can simply be neglected - the probability of the coincidence of negative signals with elements from the list of recommendations, which any imputed recommender system gives, turns out to be too small to significantly affect the value of the metric. Therefore, it is not necessary to specifically consider this case. And this means that the metric will be insensitive to negative evaluations. More precisely, a negative assessment will be equivalent to simply the lack of assessment by the user (this will be completely clear a little later).
Recommended but not rated
If the film was recommended, but we do not have a positive signal, then it seems that it means nothing. You never know why it happened - a person could not watch the movie or not appreciate it. However, from the point of view of the entire audience, the entire mass of signals, these are cases for which the probability that a film for some reason does not deserve a high mark for a person is definitely higher than for cases of sheer success. Therefore, it would be possible to consider this incident also negative, but it is very difficult to estimate how much this probability is. That is, we cannot determine the degree of negativity. As a result, it makes sense to assume that simply nothing happened and not to take into account the case explicitly. In practice, it turns out that the majority of such cases are - firstly, we should always advise some excess (that is, take the N rec value with a margin), secondly, most people, as a rule, do not mark every viewed film (t .e., we see only a part of their assessments).
Rated but not recommended
The opposite case - the film was not recommended, but there is a positive signal, that is, the adviser missed the opportunity to increase the number of successes. While such opportunities are found, you can improve the result:

If the recommendations contain all positive signals, the accuracy of the system is maximum - there is nothing more to improve:
So, in our scheme, it turns out that improving the quality of recommendations is an increase in the number of successes. in the list of recommendations (the size of which, N rec is fixed).
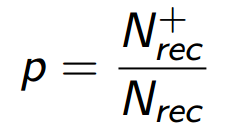
If instead of just the number of successes we use the value precision (p), i.e. we will divide - the number of successes by N rec , then, essentially, nothing will change: instead of the number of successes, we will maximize the value, which differs from it only by dividing by a constant:
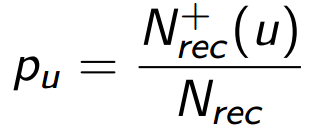
But, as we will see later, this division will allow to take into account in the metric a very significant aspect of the task - the dependence of the metric on the order of recommendations in the list. In addition, the value of p has clear logic that can be described in a probabilistic language. Suppose that a person consumes our product, namely, it looks through all the elements of the list of recommendations. Then p means for him the probability to find in this list a suitable element - one that will satisfy him in a relative future. Denote precision for user u as p u :
It is appropriate to generalize this formula to our entire audience (or measured sample) of users ( Users ):
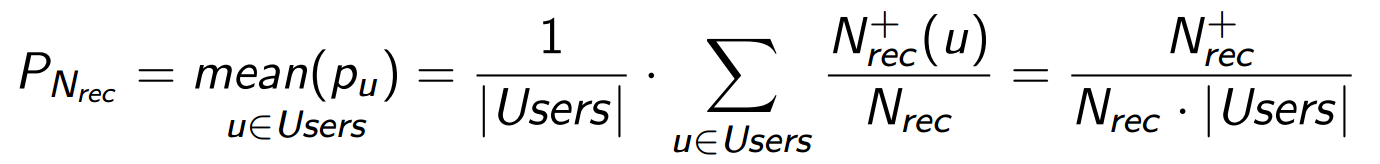
Everyone looks at their own list and chooses what they need, and P Nrec shows the average probability of success for all cases. Value on the right side, this is now the total number of successes in the entire sample.
So far, we have evaluated the list of elements as a whole, but we know perfectly well that its beginning is more important than the tail. Anyway, if the list is not too short. The metric that takes this into account, and therefore depends on the order of the elements in the list, is called discounted. The beginning of the list is more important than the tail, due to the uneven distribution of users' attention - people almost always look at the first element, look at the first and the second, and so on, more rarely. This means that for a proper discounting, we need some behavioral model. And the data with which we can support this model (train).
We imagine an average user who scans the elements in turn, starting with the first, and then, at a certain moment, stops doing it:
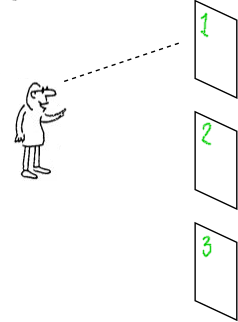
We can not identify a specific user, and do not want. Sometimes the same person will want to see a list of 2 items, and sometimes out of 20.
It would be nice to get the average probability of the transition from each element to the next, but we have enough data, even a little easier.
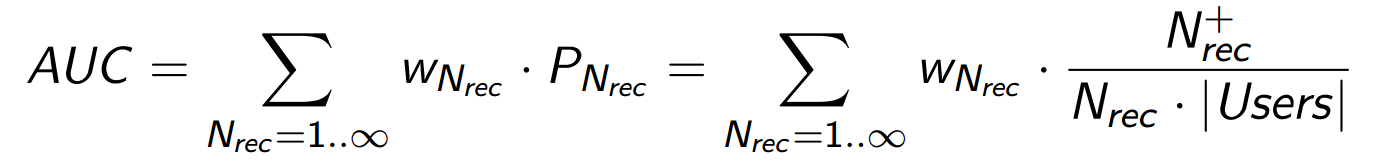
Suppose that we have the probability that an arbitrary person will scan a list of long N elements: w N for any reasonable N. Then we can average the values of P N by the formula of total probability, meaning by P N the average value of the probability of success for that part of our audience which looked through a list of length N. In our terminology, it will look like this:

It turns out that, in contrast to precision , the value of AUC estimates the average probability of success for personal recommendation lists in more realistic conditions — when lists are viewed by living people whose attention is unevenly distributed. Note that to get the value of AUC , we used the dependence of the value of P Nrec ( precision ) on N rec - the size of the list of recommendations, which we fixed a little earlier.
The term AUC denotes, among other things, the integral precision by recall , which is sometimes used as a quality metric of classifiers.
The summation we made is in some sense an analogue of such a metric: with different values of N rec, we model different values of Recall .
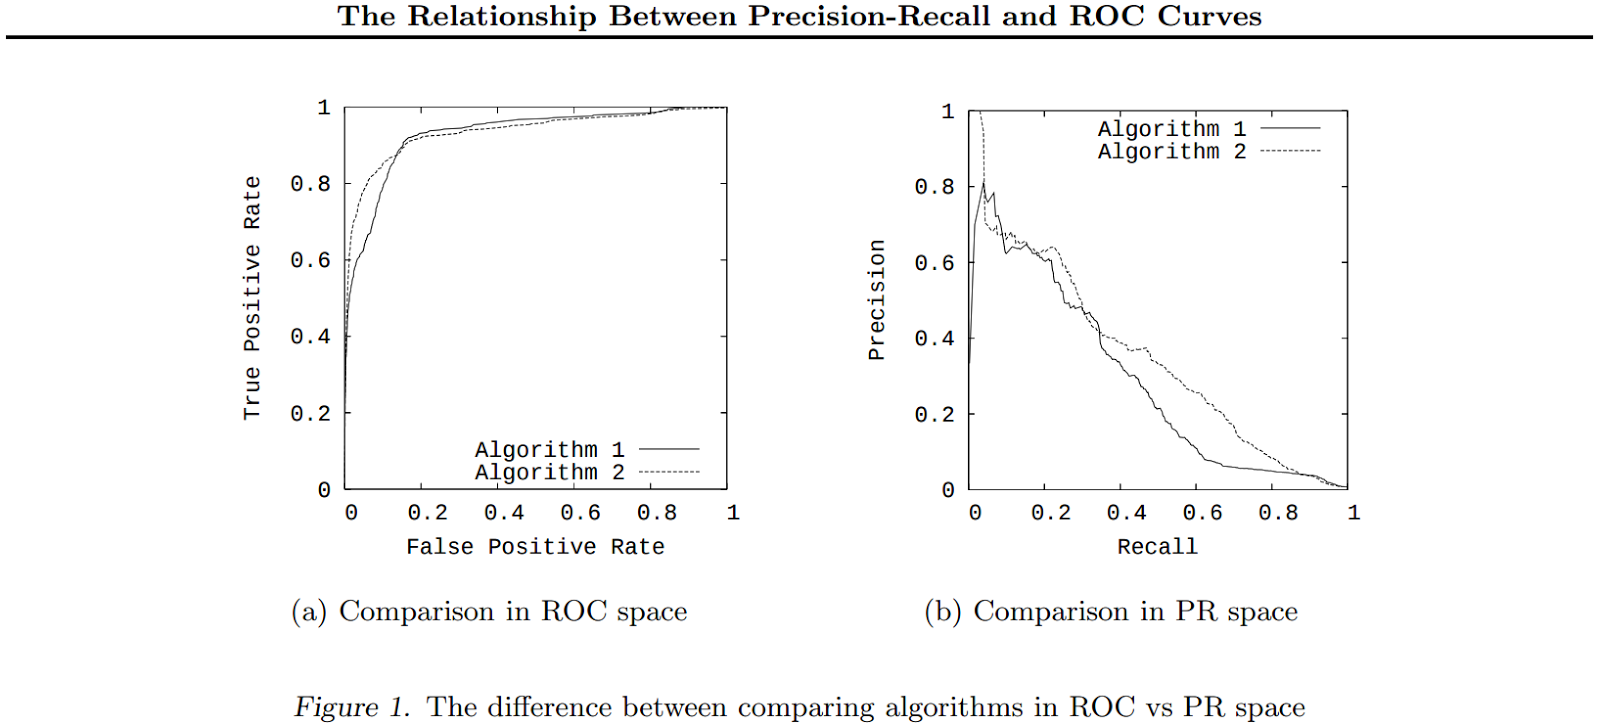
This is a (already classic) example of constructing ROC curves in precision-recall coordinates.
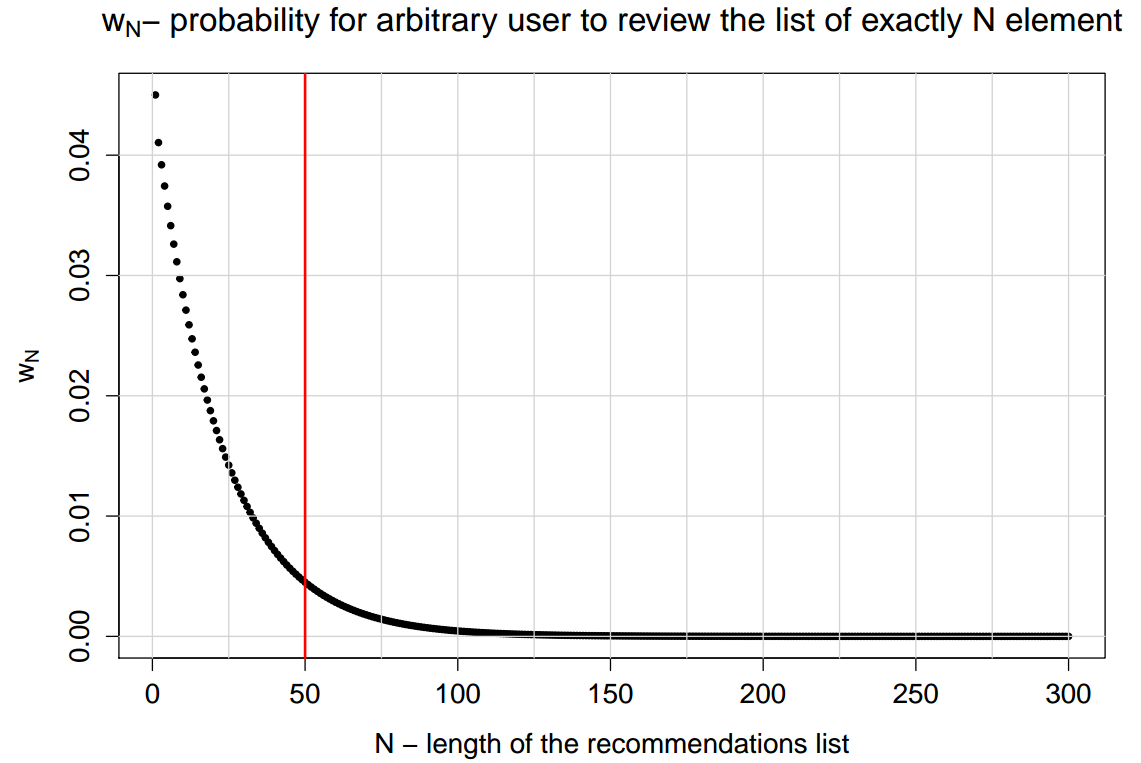
There is a simple and common model for estimating the values of w N , which makes it possible not to process the entire probability distribution of transitions, but gives a qualitatively correct behavior of the values of w N :

The only parameter of the Q model is the probability that an arbitrary user will go to the next page of the list (it is easy to get it from the web logs of pagination). Suppose that the pages contain m elements each, and users with the same probability p go to the next element or, in other words, with probability (1-p) on each element go away. Then p is easily obtained from the relation Q = p m . (If we assume that the first element will be scanned with probability 1.) Then, we need the probability w N that a person will look at N elements, and then leave, it is easy to calculate:
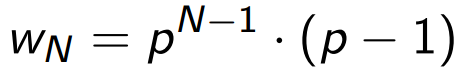
In our experiment, the pages consisted of 50 elements, and the value of Q was equal to 0.1 . The dependence of w N on N at the same time looks like this:
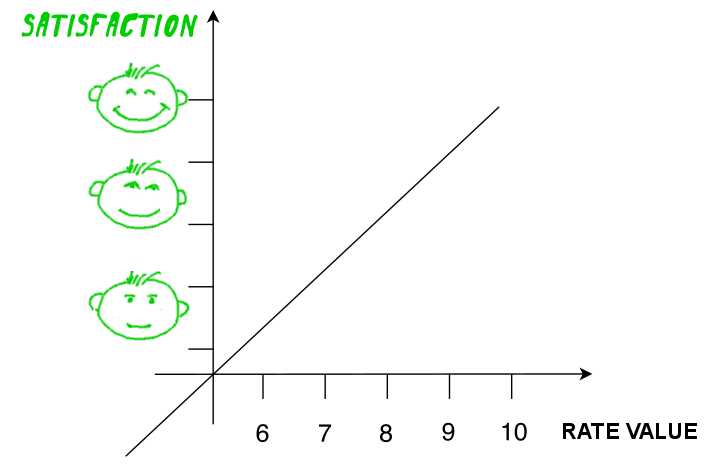
So far, we have used only the fact of a positive signal and ignored the fact that we have its value. It is clear that ignoring this information would be unfair. When the scale of the collection of assessments is chosen well, the magnitude of the signal should be, on average, proportional to human satisfaction:
Following this logic, replace in the current metric:
... counter success by (more informative) amount of positive points:
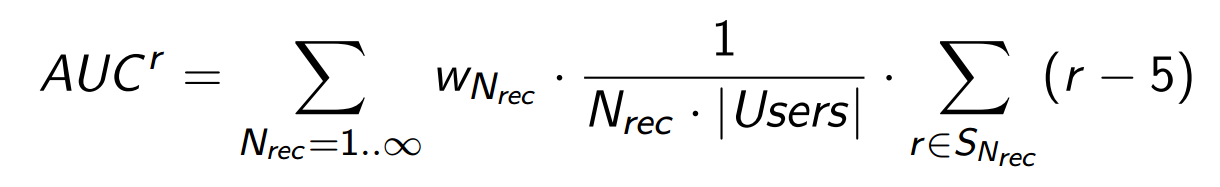
S Nrec - many successful evaluations, that is, those positive evaluations that are counted in . The positive part of our scale begins with 6 points, so we (just for convenience) subtract 5 from all r estimates.
Why can this be done? Because you can imagine the role of positive points in the metric a bit differently:
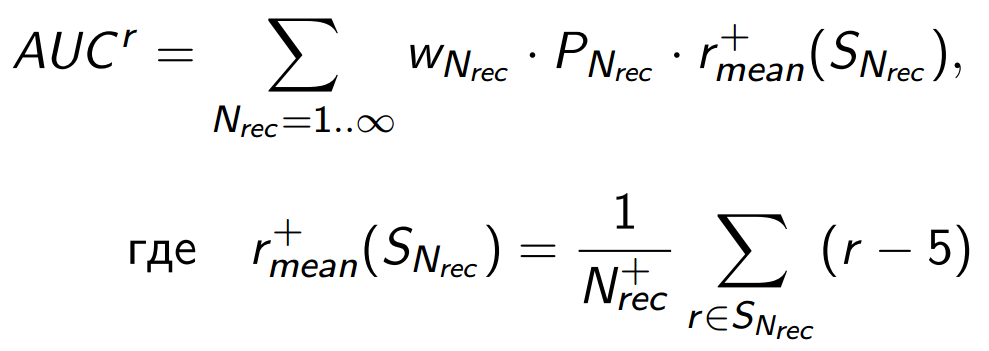
This is the average positive score for the audience that will see a list of long N rec . And since we assumed that lists of different lengths are viewed by approximately the same people, an increase in the metric will depend only on the ability of the algorithm to increase the average score for the top of the lists at the expense of the bottom for all users.
The product of the probability of success by the average score in case of success can be called the total amount of satisfaction that the recommendatory algorithm can achieve. That is, now the metric, although it loses its purely probabilistic interpretation, is better suited to our goals. (Note that the numerical value of the AUC r can be any - in fact, this is the specific number of positive points in the feedback, which depends on the sample size, audience activity, selected behavioral model of users, etc.)
Suppose that two recommender algorithms generated top lists that differ slightly in the order of elements. It turned out that in the first case, the actual user ratings were distributed like this:
and in the second:

Simultaneous accounting and estimation values and discounting allow AUC r to distinguish them reasonably and quantitatively, that is, to find out that the second algorithm is better and say how much.
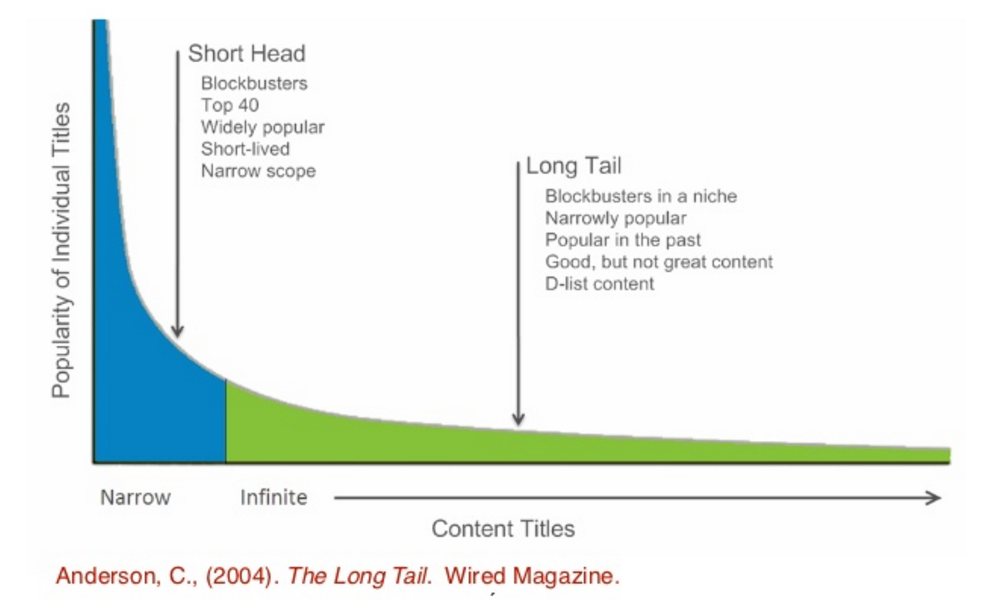
Movies, like other media products, have a funny feature: the distribution of elements in popularity is extremely uneven, there are quite a few films that are known and appreciated by a large number of people - this is a short head , and the vast majority are known to relatively few - this is a long tail .
For example, the distribution of imhonet estimates looks like this:

This distribution is so steep in the short head part that, for any summation of signals, films from it dominate, giving more than 80% of the contribution to the metric. This causes its numerical instability: the disappearance or appearance in the top of the recommendations of just a few objects from the short head can dramatically change the value of the metric.
Ahead of your curiosity, we note that the short-head feature of the graph can be straightened in log-log coordinates:
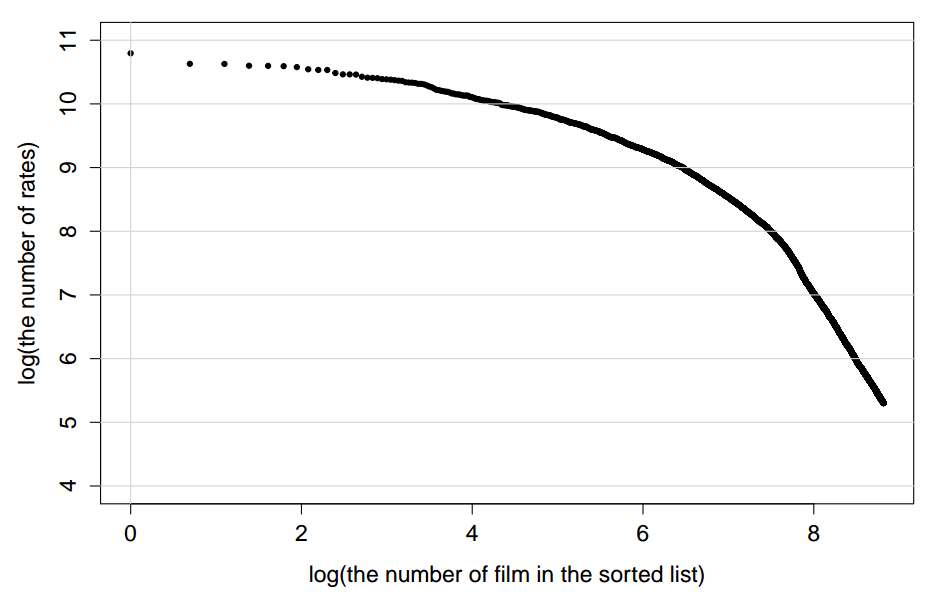
Such coordinates are used, for example, to describe the distribution of the frequency of words in natural languages.
Recall that the purpose of recommender systems is effective personalization. She is associated with skill accurately
pick items from long tail . The elements from the short head are mostly known to everyone, that is, they almost do not need to be included in the recommendations:
Therefore, a sensible solution is to simply reduce the weight of the short head in the metric. How to do it correctly? We start from the metric problem itself - numerical instability will necessarily lead to a decrease in sensitivity. We simulate test cases that the metric must distinguish and achieve its maximum sensitivity in them. As a point of reference, we take a situation where we do not know anything about the users in our sample. Then all the personal lists of recommendations will turn out the same and will correspond to some movie ratings. To build this movie rating, we use the simple probability that the film will be liked, calculated on the entire rating base. For example, it may be the probability that an arbitrary score of a film is more than 5 points:

(For calculations, we, of course, will correct this probability by the Laplace rule. And we can take into account the magnitudes of the estimates.)
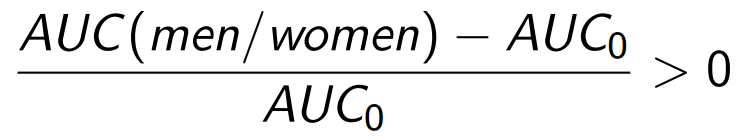
Fortunately, in addition to ratings, we know about the users from our sample various additional information that they indicate in the questionnaire: gender, age, likes fiction or vice versa, and much more. For example, we know the floor. Then we can build instead of one general two different recommendation lists. We will do this using the Bayesian probability formula:

Here the probability for our point of reference P (r> 5) works as a priori. Since two different recommendation lists are better than one, we can rightly expect an increase in the value of the metric:

It is more convenient to assess the relative increase:
An increase in the metric should also occur when using any other information about users that is relevant to film preferences. The greater the increase, the more sensitive it is to this information. Since we are not interested in a specific case about gender, in order not to retrain on it, we will average the AUC increase over the many ways we can divide the audience. In our experiment, user answers were used in the questionnaire for 40 different questions.
And now let's write out what the optimization problem looks like, which finds the necessary metric with optimal sensitivity. Recall that the basic idea is to reduce the weight for elements from a short head . The function responsible for the short head penalties for elements is denoted by σ . We need such a function σ , which provides the maximum sensitivity:
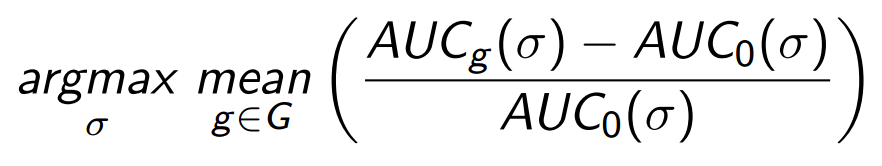
Here G is the set of ways to segment an audience with the corresponding calculations of recommendations for segments.
In a simple experiment that turned out to be effective, we used the step function as σ (sigmoid approximation), which simply zeroes the weights for the short head :

This means that the optimization task:
need to be solved for the only parameter σ that determines the position of the step in the list of films sorted by the number of ratings. For example, here’s what happened with our optimization:
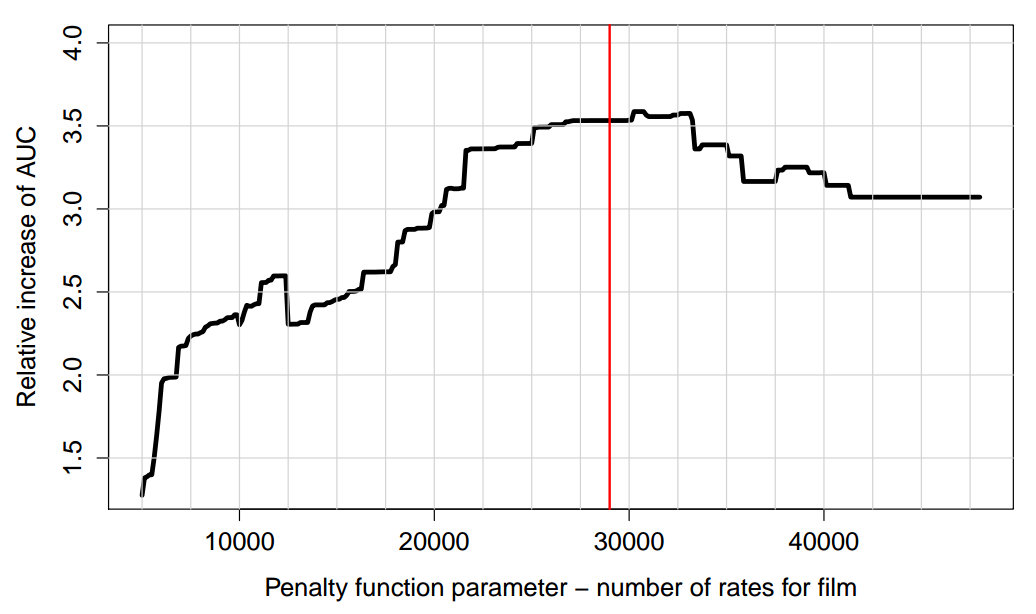
On the left side - we penalize too many elements. On the right - no one is fined. In the optimal position (40 films fined), the sensitivity of the metric is improved by ~ 20%.
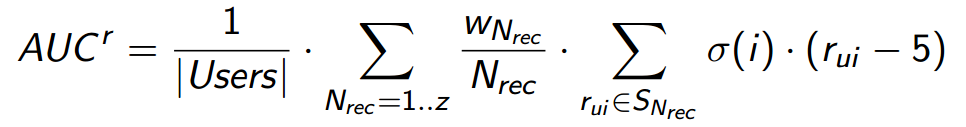
We present the final form of the metric, which takes into account all the above logic. AUC r metric which:
can be written as follows:
We note here another interesting point. All users with their ratings are included in the formula for AUC r equally. However, we know that sometimes people can use the rating scale in different ways - some can give a lot of high points, others, on the contrary, rarely give high points. This means that if we use the immediate values of the estimates of r in the metric, the contribution from the first users will be higher due to the reduced contribution from the second. Output - enter a normalized scale in which the estimates made by different types of users will be comparable to each other. In practice, however, it turned out that when we work with a large sample, this effect can be neglected. The main reason is that the type of use of the scale does not correlate with the taste of the person, so averaging over the audience, which occurs when calculating AUC r , has the same effect as using a normalized scale.
Here are some practical examples of using metrics. We used machine learning models of the recommendation system imhonet.ru, the details of which we omit here - we simply show the results of solving problems in which the target metric was AUC r . A particular problem for recommender systems is cold start tasks. We have them of two types:
The more people put the estimates, the more accurate his lists of recommendations. Let us compare this dependence (red line) with the value of the metric, which gives the overall rating ( AUC 0 , black line), and with the level when we give recommendations using only gender and age (orange line):
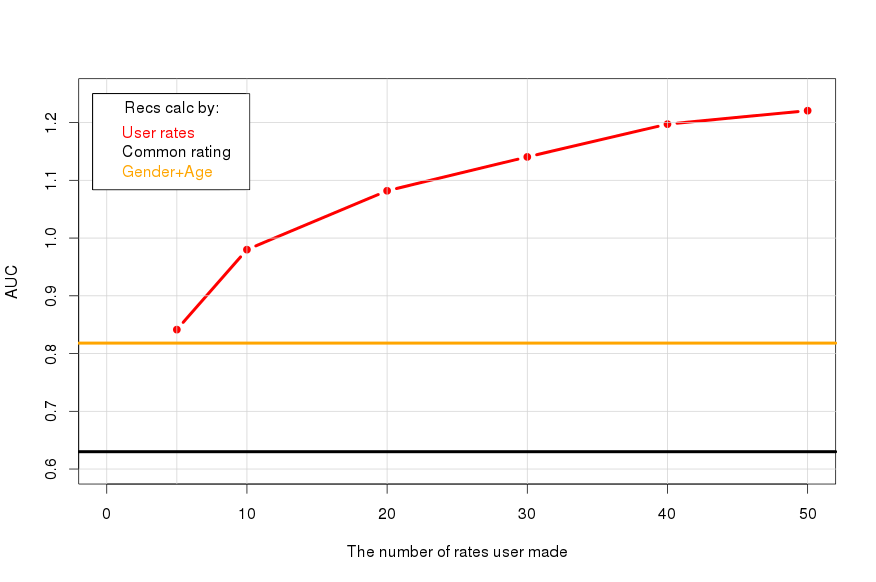
Information about gender and age gives about the same as 5 ratings.
Questionnaire. For an ordinary person, it is not always easy to formulate your preferences immediately in the form of assessments of the elements, so for beginners we offer to answer simple questions, such as “Do you like anime?”, “Do you like action?”. For this purpose, we have brought several hundred such questions. Let's see what their use can give:

The questions are not so informative, but they are still beneficial, since it is much easier to answer than to put in numerical estimates. For example, 10 ratings are equivalent to 25 responses.
Profile recommendations from another section.It so happens that a person has already composed his profile from the ratings of the elements of another section. If there is a connection between preferences in different sections, you can try to use it. In our example, according to the evaluation profiles of art books, we are trying to make cinema recommendations:
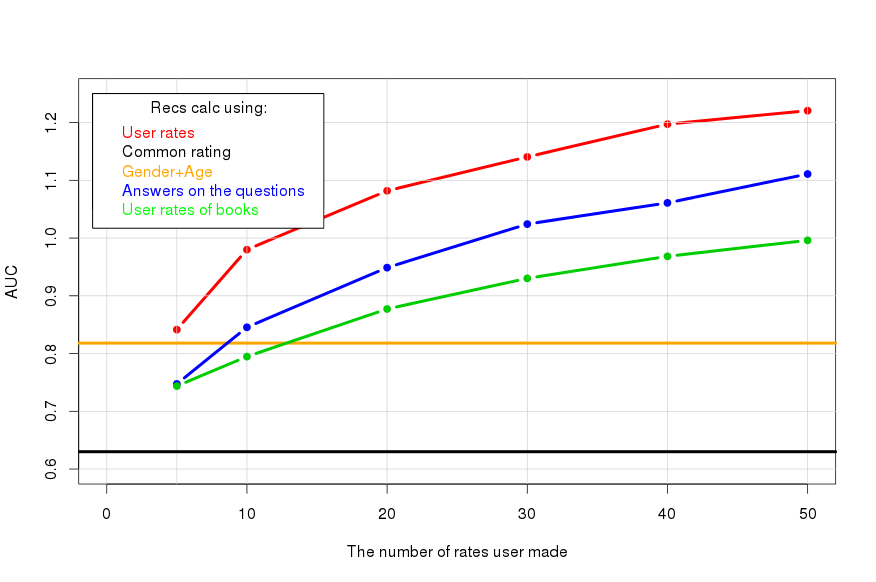
It turns out worse than the use of questions, but you can fix a certain effect.
New items It is very, very necessary to be able to start recommending new products before users start evaluating them. It is clear that this can be done only on the basis of outgoing data about the film. In our recommendation system, the properties of films that have a key influence on recommendations turned out to be:
This metadata allows you to start recommending a movie as if “good” users (not newbies) have already given him about 27 ratings:

That's not bad.
Thanks for attention!
Problem metrics for recommender
Any recommendation system helps to solve a specific business problem. And the result is measured in ways that are understandable for the business problem - the number of visitors, sales, CTR, etc. However, the quality of the recommender algorithm in this way is too difficult to measure - it will depend on a huge variety of conditions, among which the recommender algorithm itself may be the tenth thing.
So it turns out that formal numerical criteria for recommender algorithms need to be invented by their developers in isolation from the business task. As a result, the work devoted to recommender systems is full of various useful numerical metrics, but sometimes quite tricky in relation to the problems to be solved.
')
The optimal approach to be discussed is to try to construct a metric directly for a business problem. It is clear that this is easier said than done, so the discussion below will deal with a specific example: how this is done for the reference service of imhonet.ru movies. Although we tested this approach on the films, but it is rather distracted, as can be seen by replacing the film word in the whole next story with something else.
Service product and user feedback
Service product - personal lists of recommended films. The feedback is fairly accurate, and therefore valuable - direct ratings to these films:
It makes sense to use such a good feedback to the fullest. Estimates, for the sake of convenience in terminology, we will sometimes be called "signals of satisfaction."
Why in the task we are talking about the list of recommendations, and, for example, not about one element? Therefore, why the search engine gives a list of links: it does not know the full context of the request. If he knew the full context (for example, the contents of the user's head), then, probably, the only result would make sense, otherwise the part of the work still remains for the author of the request.
Recommendations and evaluations
We compare the feedback of users - ratings, with the lists of items that we recommended:
We will need to consider the following situations:
- Hit - the film was recommended, and there is a positive rating
- Mishit - recommended movie, but negative
- Recommended but not rated - the film was recommended, but no evaluation
- Rated but not recommended - there is a positive assessment of the film, but it was not recommended.
Go through them one by one.
Hit
If a film was recommended to a person, and there is a positive signal from him, it means that we hit exactly. It is precisely such cases that interest us, so let's call them successes and maximize their number:
Mishit
The film that was recommended and received a negative signal is an example of the cases that we should avoid. It is even possible that avoiding such cases is more important than maximizing the number of cases of success.
This is a bit unexpected, but practice has shown that such cases can simply be neglected - the probability of the coincidence of negative signals with elements from the list of recommendations, which any imputed recommender system gives, turns out to be too small to significantly affect the value of the metric. Therefore, it is not necessary to specifically consider this case. And this means that the metric will be insensitive to negative evaluations. More precisely, a negative assessment will be equivalent to simply the lack of assessment by the user (this will be completely clear a little later).
Recommended but not rated
If the film was recommended, but we do not have a positive signal, then it seems that it means nothing. You never know why it happened - a person could not watch the movie or not appreciate it. However, from the point of view of the entire audience, the entire mass of signals, these are cases for which the probability that a film for some reason does not deserve a high mark for a person is definitely higher than for cases of sheer success. Therefore, it would be possible to consider this incident also negative, but it is very difficult to estimate how much this probability is. That is, we cannot determine the degree of negativity. As a result, it makes sense to assume that simply nothing happened and not to take into account the case explicitly. In practice, it turns out that the majority of such cases are - firstly, we should always advise some excess (that is, take the N rec value with a margin), secondly, most people, as a rule, do not mark every viewed film (t .e., we see only a part of their assessments).
Rated but not recommended
The opposite case - the film was not recommended, but there is a positive signal, that is, the adviser missed the opportunity to increase the number of successes. While such opportunities are found, you can improve the result:
If the recommendations contain all positive signals, the accuracy of the system is maximum - there is nothing more to improve:
So, in our scheme, it turns out that improving the quality of recommendations is an increase in the number of successes.
Metric precision
If instead of just the number of successes we use the value precision (p), i.e. we will divide
But, as we will see later, this division will allow to take into account in the metric a very significant aspect of the task - the dependence of the metric on the order of recommendations in the list. In addition, the value of p has clear logic that can be described in a probabilistic language. Suppose that a person consumes our product, namely, it looks through all the elements of the list of recommendations. Then p means for him the probability to find in this list a suitable element - one that will satisfy him in a relative future. Denote precision for user u as p u :
It is appropriate to generalize this formula to our entire audience (or measured sample) of users ( Users ):
Everyone looks at their own list and chooses what they need, and P Nrec shows the average probability of success for all cases. Value
Discounting
So far, we have evaluated the list of elements as a whole, but we know perfectly well that its beginning is more important than the tail. Anyway, if the list is not too short. The metric that takes this into account, and therefore depends on the order of the elements in the list, is called discounted. The beginning of the list is more important than the tail, due to the uneven distribution of users' attention - people almost always look at the first element, look at the first and the second, and so on, more rarely. This means that for a proper discounting, we need some behavioral model. And the data with which we can support this model (train).
We imagine an average user who scans the elements in turn, starting with the first, and then, at a certain moment, stops doing it:
We can not identify a specific user, and do not want. Sometimes the same person will want to see a list of 2 items, and sometimes out of 20.
It would be nice to get the average probability of the transition from each element to the next, but we have enough data, even a little easier.
Suppose that we have the probability that an arbitrary person will scan a list of long N elements: w N for any reasonable N. Then we can average the values of P N by the formula of total probability, meaning by P N the average value of the probability of success for that part of our audience which looked through a list of length N. In our terminology, it will look like this:
It turns out that, in contrast to precision , the value of AUC estimates the average probability of success for personal recommendation lists in more realistic conditions — when lists are viewed by living people whose attention is unevenly distributed. Note that to get the value of AUC , we used the dependence of the value of P Nrec ( precision ) on N rec - the size of the list of recommendations, which we fixed a little earlier.
What is AUC?
The term AUC denotes, among other things, the integral precision by recall , which is sometimes used as a quality metric of classifiers.
The summation we made is in some sense an analogue of such a metric: with different values of N rec, we model different values of Recall .
This is a (already classic) example of constructing ROC curves in precision-recall coordinates.
How to quickly assess the value of the scales wN?
There is a simple and common model for estimating the values of w N , which makes it possible not to process the entire probability distribution of transitions, but gives a qualitatively correct behavior of the values of w N :
The only parameter of the Q model is the probability that an arbitrary user will go to the next page of the list (it is easy to get it from the web logs of pagination). Suppose that the pages contain m elements each, and users with the same probability p go to the next element or, in other words, with probability (1-p) on each element go away. Then p is easily obtained from the relation Q = p m . (If we assume that the first element will be scanned with probability 1.) Then, we need the probability w N that a person will look at N elements, and then leave, it is easy to calculate:
In our experiment, the pages consisted of 50 elements, and the value of Q was equal to 0.1 . The dependence of w N on N at the same time looks like this:
The value of evaluation and "satisfaction"
So far, we have used only the fact of a positive signal and ignored the fact that we have its value. It is clear that ignoring this information would be unfair. When the scale of the collection of assessments is chosen well, the magnitude of the signal should be, on average, proportional to human satisfaction:
Following this logic, replace in the current metric:
... counter success
S Nrec - many successful evaluations, that is, those positive evaluations that are counted in
Why can this be done? Because you can imagine the role of positive points in the metric a bit differently:
This is the average positive score for the audience that will see a list of long N rec . And since we assumed that lists of different lengths are viewed by approximately the same people, an increase in the metric will depend only on the ability of the algorithm to increase the average score for the top of the lists at the expense of the bottom for all users.
The product of the probability of success by the average score in case of success can be called the total amount of satisfaction that the recommendatory algorithm can achieve. That is, now the metric, although it loses its purely probabilistic interpretation, is better suited to our goals. (Note that the numerical value of the AUC r can be any - in fact, this is the specific number of positive points in the feedback, which depends on the sample size, audience activity, selected behavioral model of users, etc.)
Suppose that two recommender algorithms generated top lists that differ slightly in the order of elements. It turned out that in the first case, the actual user ratings were distributed like this:
and in the second:
Simultaneous accounting and estimation values and discounting allow AUC r to distinguish them reasonably and quantitatively, that is, to find out that the second algorithm is better and say how much.
Long tail and short head
Movies, like other media products, have a funny feature: the distribution of elements in popularity is extremely uneven, there are quite a few films that are known and appreciated by a large number of people - this is a short head , and the vast majority are known to relatively few - this is a long tail .
For example, the distribution of imhonet estimates looks like this:
This distribution is so steep in the short head part that, for any summation of signals, films from it dominate, giving more than 80% of the contribution to the metric. This causes its numerical instability: the disappearance or appearance in the top of the recommendations of just a few objects from the short head can dramatically change the value of the metric.
Ahead of your curiosity, we note that the short-head feature of the graph can be straightened in log-log coordinates:
Such coordinates are used, for example, to describe the distribution of the frequency of words in natural languages.
Recall that the purpose of recommender systems is effective personalization. She is associated with skill accurately
pick items from long tail . The elements from the short head are mostly known to everyone, that is, they almost do not need to be included in the recommendations:
Therefore, a sensible solution is to simply reduce the weight of the short head in the metric. How to do it correctly? We start from the metric problem itself - numerical instability will necessarily lead to a decrease in sensitivity. We simulate test cases that the metric must distinguish and achieve its maximum sensitivity in them. As a point of reference, we take a situation where we do not know anything about the users in our sample. Then all the personal lists of recommendations will turn out the same and will correspond to some movie ratings. To build this movie rating, we use the simple probability that the film will be liked, calculated on the entire rating base. For example, it may be the probability that an arbitrary score of a film is more than 5 points:
(For calculations, we, of course, will correct this probability by the Laplace rule. And we can take into account the magnitudes of the estimates.)
Fortunately, in addition to ratings, we know about the users from our sample various additional information that they indicate in the questionnaire: gender, age, likes fiction or vice versa, and much more. For example, we know the floor. Then we can build instead of one general two different recommendation lists. We will do this using the Bayesian probability formula:
Here the probability for our point of reference P (r> 5) works as a priori. Since two different recommendation lists are better than one, we can rightly expect an increase in the value of the metric:
It is more convenient to assess the relative increase:
An increase in the metric should also occur when using any other information about users that is relevant to film preferences. The greater the increase, the more sensitive it is to this information. Since we are not interested in a specific case about gender, in order not to retrain on it, we will average the AUC increase over the many ways we can divide the audience. In our experiment, user answers were used in the questionnaire for 40 different questions.
And now let's write out what the optimization problem looks like, which finds the necessary metric with optimal sensitivity. Recall that the basic idea is to reduce the weight for elements from a short head . The function responsible for the short head penalties for elements is denoted by σ . We need such a function σ , which provides the maximum sensitivity:
Here G is the set of ways to segment an audience with the corresponding calculations of recommendations for segments.
In a simple experiment that turned out to be effective, we used the step function as σ (sigmoid approximation), which simply zeroes the weights for the short head :
This means that the optimization task:
need to be solved for the only parameter σ that determines the position of the step in the list of films sorted by the number of ratings. For example, here’s what happened with our optimization:
On the left side - we penalize too many elements. On the right - no one is fined. In the optimal position (40 films fined), the sensitivity of the metric is improved by ~ 20%.
Summary: calculation formula
We present the final form of the metric, which takes into account all the above logic. AUC r metric which:
- measures the quality of personal recommendation lists according to user evaluations made after the fact, as the probability that the recommendation will be successful ( precision );
- sensitive to the order of the elements in the lists or, more precisely, discounted according to a simple behavioral model - viewing the recommendations of the user in turn and from top to bottom;
- takes into account the values of positive assessments, therefore, can measure not only the concentration of success , but also the amount of satisfaction ;
- correctly handles the problem of short head / long tail - finishes the elements of short head in such a way as to optimize the sensitivity;
can be written as follows:
- N rec - length of recommendation lists
- z is the limit for adding precision values. For long lists, the precision values are very small, as well as the WN rec multiplier, so a large enough z does not affect the metric, and it’s easy to choose
- | Users | - how many users are in the sample,
- WN rec - an estimate of the probability that a random user will view a list of exactly N rec length,
- S Nrec - many successful ratings if the recommendation lists are of length N rec ,
- σ (i) is the value of the penalty function ( short-head ) for the element i ,
- r ui - the score that element i received from user u .
We note here another interesting point. All users with their ratings are included in the formula for AUC r equally. However, we know that sometimes people can use the rating scale in different ways - some can give a lot of high points, others, on the contrary, rarely give high points. This means that if we use the immediate values of the estimates of r in the metric, the contribution from the first users will be higher due to the reduced contribution from the second. Output - enter a normalized scale in which the estimates made by different types of users will be comparable to each other. In practice, however, it turned out that when we work with a large sample, this effect can be neglected. The main reason is that the type of use of the scale does not correlate with the taste of the person, so averaging over the audience, which occurs when calculating AUC r , has the same effect as using a normalized scale.
Some examples from practice
Here are some practical examples of using metrics. We used machine learning models of the recommendation system imhonet.ru, the details of which we omit here - we simply show the results of solving problems in which the target metric was AUC r . A particular problem for recommender systems is cold start tasks. We have them of two types:
- Newbie We need to quickly begin to give him accurate recommendations.
- New We need to quickly begin to accurately recommend the item to users.
The more people put the estimates, the more accurate his lists of recommendations. Let us compare this dependence (red line) with the value of the metric, which gives the overall rating ( AUC 0 , black line), and with the level when we give recommendations using only gender and age (orange line):
Information about gender and age gives about the same as 5 ratings.
Questionnaire. For an ordinary person, it is not always easy to formulate your preferences immediately in the form of assessments of the elements, so for beginners we offer to answer simple questions, such as “Do you like anime?”, “Do you like action?”. For this purpose, we have brought several hundred such questions. Let's see what their use can give:
The questions are not so informative, but they are still beneficial, since it is much easier to answer than to put in numerical estimates. For example, 10 ratings are equivalent to 25 responses.
Profile recommendations from another section.It so happens that a person has already composed his profile from the ratings of the elements of another section. If there is a connection between preferences in different sections, you can try to use it. In our example, according to the evaluation profiles of art books, we are trying to make cinema recommendations:
It turns out worse than the use of questions, but you can fix a certain effect.
New items It is very, very necessary to be able to start recommending new products before users start evaluating them. It is clear that this can be done only on the basis of outgoing data about the film. In our recommendation system, the properties of films that have a key influence on recommendations turned out to be:
- Genres
- Directors
- Actors
- Screenwriters
This metadata allows you to start recommending a movie as if “good” users (not newbies) have already given him about 27 ratings:
That's not bad.
Thanks for attention!
Source: https://habr.com/ru/post/281066/
All Articles