Experiment: What does the random walk hypothesis say about financial market forecasting?
In a blog on Habré and the analytical section of our site, we write a lot about algorithms and tools for predicting the movement in financial markets. At the same time, many observers believe that such activities are akin to playing in a casino - everything is random on the stock exchange, which means that nothing can be predicted. NMRQL quantitative analyst hedge fund Stuart Reed published on the website Turing Finance the results of a study in which he used the random walk hypothesis, trying to confirm or disprove the thesis about the randomness of financial markets. We present to you the main thoughts of this material.
As Reed writes, hackers and traders, in fact, are doing the same thing - they find the inefficiency of the system and exploit it. The only difference is that some, pursuing a variety of goals, hack computers, networks or even people, and the second - financial markets and their goal is to make a profit.
')
In this context, the topic of random number generators is very interesting - they are used to encrypt data and communications, but if a vulnerability is found in the generator, then it is no longer secure, and hackers can use the error to decrypt the information. There are various sets of tests that such generators must pass in order to be able to evaluate their robustness. One such kit is the NIST test group. In this article, we will look at the application of these tests to financial strategies in order to understand whether the market can be “hacked”.
Hypothesis of random walk
In the real world, many systems exhibit random properties. For example - the spread of epidemics such as Ebola, the behavior of cosmic radiation, the movement of particles in the water, good luck while playing roulette, and, according to the hypothesis of random walk , even the movement of financial markets.
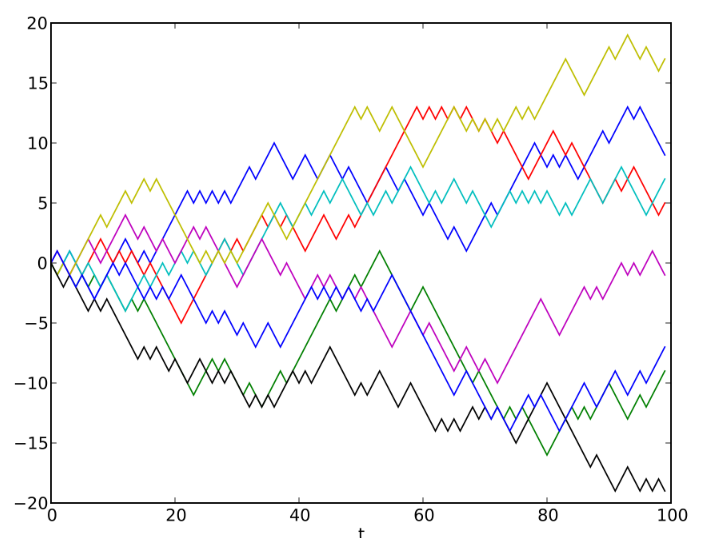
Consider an interesting test conducted by Professor of Economics at Princeton University Burton G. Malkiel. In its course, students were given a hypothetical action, which initially cost $ 50. The closing price of the auction for this stock was determined every day with a coin toss. If an eagle fell out, the price was half a point higher, and in the case of the tails, half a pound lower. Thus, each time the chance of a rise or fall in value compared to the previous “trading day” was 50%. Thus, price cycles and trends were determined.
Subsequently, Malkiel visualized the results using charts and showed them to "Chartists," that is, specialists who predicted future price movements based on patterns of their past fluctuations. Chartists advised him to immediately buy stocks. But since this stock did not exist, and its price was determined by tossing a coin, there were no real patterns, and therefore there could not be a trend. The result of the experiment allowed Malkiel to assert that the stock market is just as random as a coin flip.
This is similar to the “ Turing 's financial test, ” in which people familiar with the financial market are invited to look at the time series chart and determine which real market data is on them, which is a simulation using random processes:
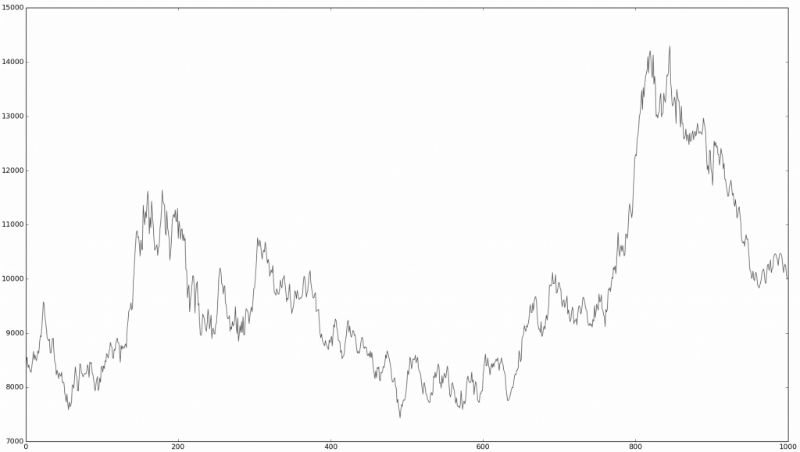
Is this a real market?
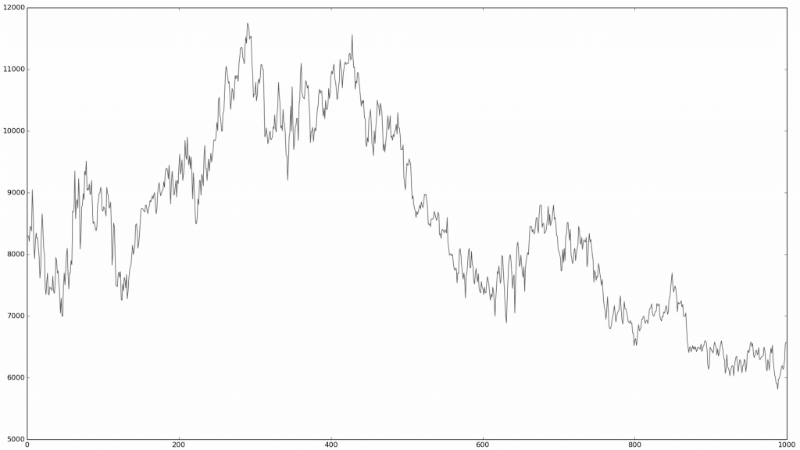
Is it random?
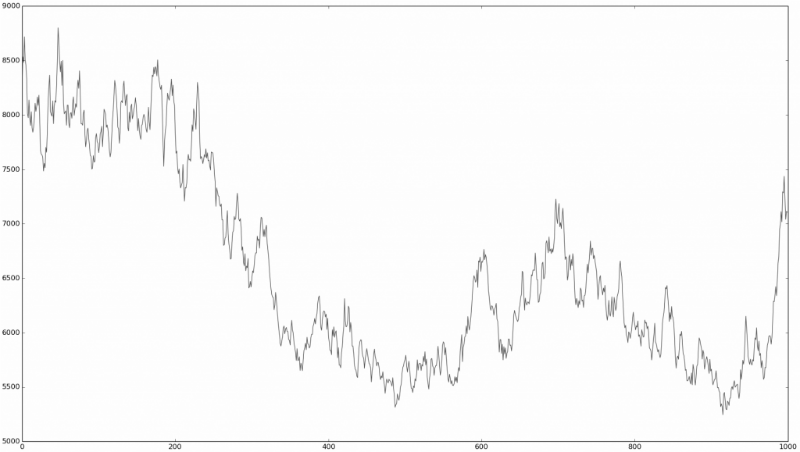
Or is there no difference at all?
It is quite difficult to determine. It is these observations that led many financial market researchers to think about how truly random the behavior of stocks on a stock exchange is. The theory, which suggests that prices move at random, is called the random walk hypothesis.
Many of the researchers conducted tests similar to Malkiel's experiment, but in fact they do not prove that the stock market develops by chance. They only prove that for the human eye, in the absence of additional information, real price movements cannot be distinguished from random ones.
There are drawbacks to the hypothesis itself:
- It considers different markets as a homogeneous environment, not taking into account the differences between them.
- It does not explain the many empirical examples in which people constantly won in the market.
- It is based on the statistical definition of randomness, and not on algorithmic. This means that the hypothesis does not distinguish between local and global randomness, does not take into account the concept of relativity of randomness.
And yet, whether someone likes it or not, it cannot be denied that the widespread adoption of the random walk hypothesis among quantitative analysts on the stock market as a whole has had a serious impact on how various financial instruments are valued - for example, derivatives or structured products. .
Algorithmic vs statistical randomness
Any function that cannot be predicted is stochastic (random). And, any function whose conclusion can be predicted is deterministic (non-random). Everything is complicated by the fact that many deterministic functions may be similar to stochastic ones. For example, most random number generators are actually deterministic functions, whose output is stochastic. Most random number generators are not really random, so they are described with pseudo or quasi prefixes.
In order to test the "validity" of the random walk hypothesis, it is necessary to determine whether the financial results of a particular action (our function) are stochastic or deterministic. Theoretically, there is an algorithmic and statistical approach to the problem, but in practice only the latter is used (and there are explanations for that).
Algorithmic approach
The theory of computable functions, also known as recursion theory or Turing computability, is a branch of theoretical computer science that works with the concept of computable and non-computable functions. A function is called computable depending on whether it is possible to write an algorithm that, in the presence of some input data, can always calculate it.
If randomness is a property of unpredictability, then the output of the function can never be accurately predicted. It follows logically from this that all-random processes are non-computable functions, since it is impossible to create an algorithm for calculating them. The famous Church-Turing thesis postulates that a function is computable only if it can be calculated using the Turing machine:
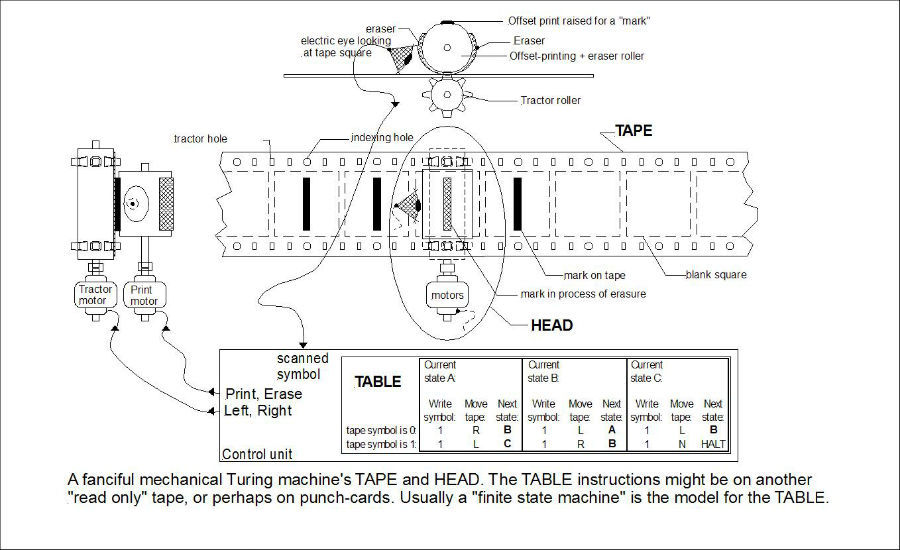
It would seem that everything is simple - you just need to use the Turing machine to determine whether there is an algorithm that predicts the behavior of stock prices (our function). But here we are faced with the problem of stopping , that is, the task of determining whether the algorithm will work forever, or someday it will end.
It is proved that this problem is unsolvable, which means that it is impossible to know in advance whether the program will stop or continue working. This means that it is impossible to solve the problem of finding an algorithm that can “calculate” a function (predict the price of a stock) - before stopping the Turing machine it will be necessary to sort through all possible algorithms, and this will take an infinite amount of time. Therefore, it is impossible to prove that the financial market is completely random.
If you do not take into account this fact, then such studies have led to the emergence of an interesting area called algorithmic information theory . It deals with the relationship between computability theory and information theory. It defines various types of randomness - one of the most popular is the definition of randomness according to Martin-Lef, who agrees, in order for the string to be recognized as random, it must:
- To be incompressible — compression implies a search for a representation of information that uses less information. For example, the infinite long binary string 0101010101 .... can be expressed more precisely as 01, repeated infinitely many times, while the infinitely long line 0110000101110110101 ... does not have a clearly defined pattern, which means it cannot be compressed to anything shorter than the same line 0110000101110110101 ... This means that if the Kolmogorov complexity is greater than or equal to the length of the string, then the sequence is algorithmically random.
- To pass statistical tests for randomness - there are many tests for randomness that check the difference between the distribution of a sequence relative to the expected distribution of any sequence that is considered random.
- Not to bring profit is an interesting concept, which implies that if it is possible to create a certain bet , leading only to success, then it means that it is not accidental.
In general, it is necessary to distinguish between global and local random walk. The first relates to the markets in the long run, while the local hypothesis of random walk may argue that the market is random for a certain minimum period of time.
In the absence of additional information, many systems may seem to be random without being such - for example, the same random number generators. Or, a more complex example, the price movement of a certain stock may seem random. But if you look at financial statements and other fundamental indicators, then everything may turn out to be completely nonrandom.
Statistical approach
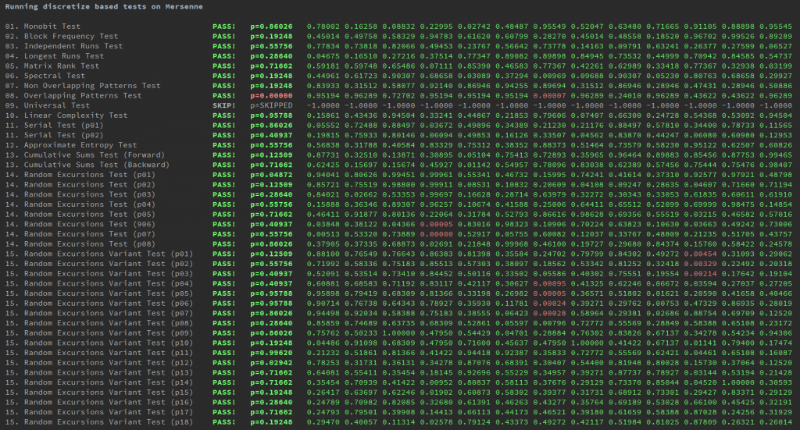
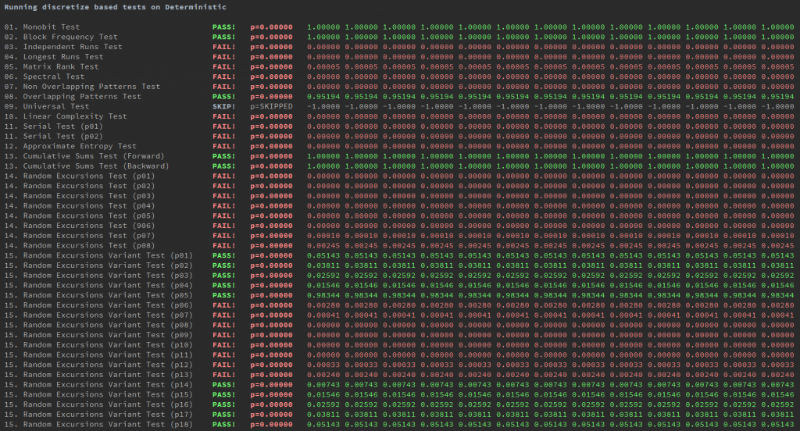
The sequence is statistically random when it contains no detectable patterns. This does not mean real randomness, that is, unpredictability - most pseudo-random random number generators, which are not unpredictable, while being statistically random. The main thing here is to pass the NIST test suite. Most of these tests involve testing how the output distribution of a supposedly random system matches the results of a truly random system. The link provides the Python code for such tests.
Hacking the market
After reviewing the theoretical foundations of the concept of chance and examining tests that allow it to be revealed, another important question is whether it is possible with the help of such tests to create a system that will determine the randomness or nonrandomness of market sequences better than a person.
The researcher decided to conduct his own experiment, for which he used the following data:
- The DJIA Index from 1900 to 2015 (daily chart) ~ 115 years
- The S & P 500 Index from 1950 to 2015 (daily chart) ~ 65 years
- The Hang Seng Index from 1970 to 2015 (daily chart) ~ 45 years
- The Shanghai Composite Index from 1990 to 2015 (daily chart) ~ 25 years
Assets of various types were also analyzed:
- Gold prices in US dollars from 1970 to 2015 (daily chart) ~ 45 years
- Exchange rates of the dollar / pound pair (USD vs GBP) from 1990 to 2015 (daily chart) ~ 25 years
- The spot price of Brent crude European oil from 1990 to 2015 (daily chart) ~ 25 years
The NIST test suite worked on real-life data sets — they were discretized and broken down into periods of 3.5.7 and 10 years. In addition, there are two ways to generate test windows — overlapping windows and non-overlapping windows. The first option is better because it allows you to see the coming randomness of the market, but it affects the quality of the aggregated P-values, since the windows are not independent.
In addition, two simulated data sets were used for comparison. The first one is a binary data set generated using the discretization strategy of the Mersenne vortex algorithm (one of the best pseudo-random generators).
The second is binary data generated by the SIN function.
Problems
Each experiment has its weak points. Not without them this time:
- Some tests require more data than the market has generated (except when using minute or tick charts, which is not always possible), which means that their statistical significance is slightly less than ideal.
- NIST tests check only standard randomness - this does not mean that markets are not distributed normally or in some other way, but they are still random.
- Randomly selected time periods (starting January 1 of each year) and significance level (0.005). Tests should be carried out on a much more extensive set of samples that begin with each month or quarter. The p-value did not have a serious impact on the final conclusions, because at its different values (0.001, 0.005, 0.05) some tests still did not pass in certain periods (for example, 1954-1959).
results
Here are the results achieved using two methods of testing with overlapping or non-overlapping windows:
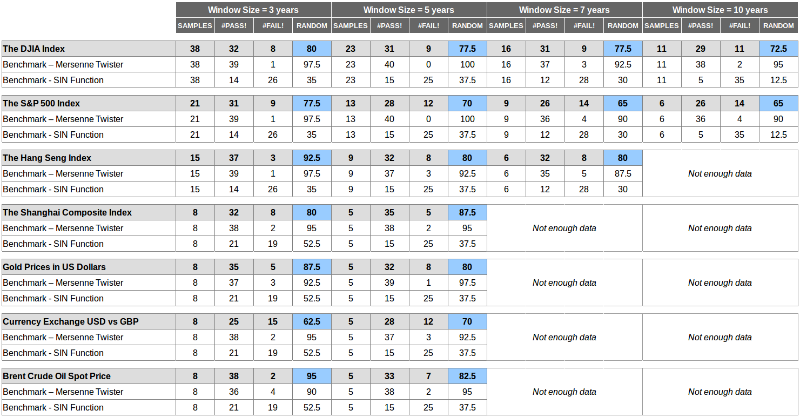

The conclusions can be drawn as follows:
- The values lie between the values of the two benchmarks, which means that the markets are less random than the Mersenne vortex and more random than the SIN function. But in the end they are not accidental.
- Values are seriously different in measurement - the size of the window seriously affects the result, and uniqueness - the markets are not equally random, some of them are more random than others.
- Values for benchmarks are consistently good for a Mersenne vortex (on average more than 90% of tests passed) and bad for a SIN graph (10-30% of tests passed on average).
At the beginning of the article we looked at an example with the experiment of Professor Burton Malkiel, who wrote the famous book A Random Walk Down Wall Street - he presented a random walk using a coin toss and showed the results to the charts. When the Chartist declared that he needed to buy the “share,” Prof. Malkiel compared the financial market with a coin toss and used this thesis to justify the strategy of passive purchases and holding positions.
However, the author of the current study believes that such a conclusion is erroneous, since the professor's experiment only says that, from the point of view of the Chartist, there is no difference between coin toss and the market. However, from the point of view of quantitative analysts and traders or their algorithms, this is not obvious. And an experiment conducted with the help of the NIST test suite showed that, although it is difficult for a person to distinguish randomly generated data from real financial information, the markets are far from random.
Source: https://habr.com/ru/post/280954/
All Articles