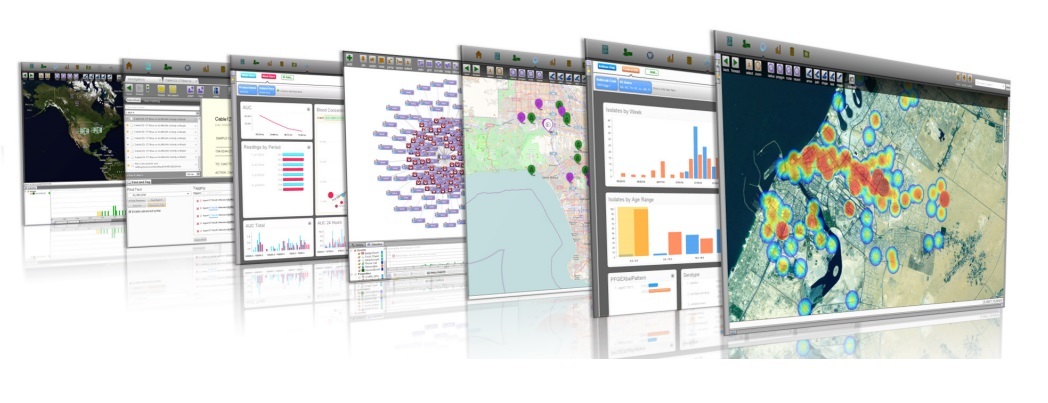
Palantir: how to detect a botnet
In 2009, Chinese cyber prospecting experienced the power of the all-seeing eye of Palantir. Information Warfare Monitor analysts have uncovered major Chinese intelligence operations — Ghostnet and the Shadow Network . ( report )
Together with Edison, we continue to investigate the capabilities of the Palantir system.
“I hope there are not many years left before the human brain and computers will be closely connected, and the resulting partnership will think like the human brain can never, and process the data in ways that are not available to the machines we know.” Said Joseph Liklider 56 years ago , he started the department of information technology in leading universities in America and began to build ARPANET. “People will set goals, formulate hypotheses, define criteria, and carry out assessment. Computers will do routine work to clear the way for technical and scientific discoveries. ”
')
“The complementarity of a person and a computer is not only a global fact. It is also the way to build a successful business. I realized this from my own experience with PayPal. In the mid-2000s, our company, having survived the collapse of the dot-com bubble, quickly grew, but we were disturbed by one serious problem: due to credit card fraud, we lost more than $ 10 million monthly. Performing hundreds and even thousands of translations per minute, we could not physically track each of them - no team of controllers could work at this speed. We did what any team of engineers would do in our place: we tried to find an automated solution. ”
Peter Thiel said and founded Palantir.
Under the kat case about how using a tool for financial analytics, you can open a botnet.
The case is “fictional,” but the screenshots show 2009 data.
(For help with the translation, thanks to Vorsin Alexey)
0:00 This video will show how using Palantir for financial analytics, we can explore non-financial data structured over time.
0:09 To be precise, we’ll show a revelation of a possible botnet attack made on the basis of analyzing a certain number of cyberdata using Palantir Finance and Palantir Goverment.
0:16 All information about connections rejected by a router in four days will be given.
0:22 We’ll see how the analyst will examine the data and investigate what looks suspicious.
0:28 We will start at a very general level, over the entire set of objects and we will add filters one by one, thus going down, step by step.
0:35 The field below will show the filtered objects.
0:41 To get started, we will distribute the data on rejected connections to the ports to which they are directed. We do this using a filter.
0:48 There are many types of filters for researching data.

0:51 We can filter by data properties, and for this we use filters on the left, at the top of the screen.
0:54 By numeric values using a histogram and other filters.
0:58 By time-based properties using timeline filters.
1:01 We want to find out how many connections were rejected on all ports of destination, so we will add a filter “by port destination”.
1:10 The histogram filter shows us the distribution of destination ports.
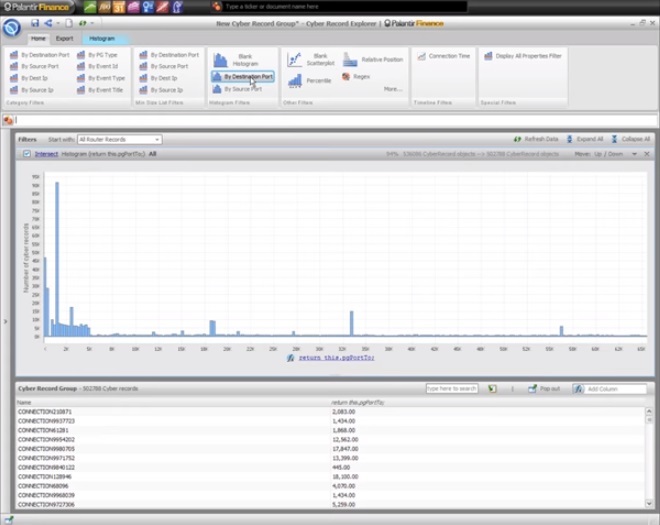
1:14 Along the X axis there are different groups of ports, along the Y axis we see how many connections are fixed in the port bucket.
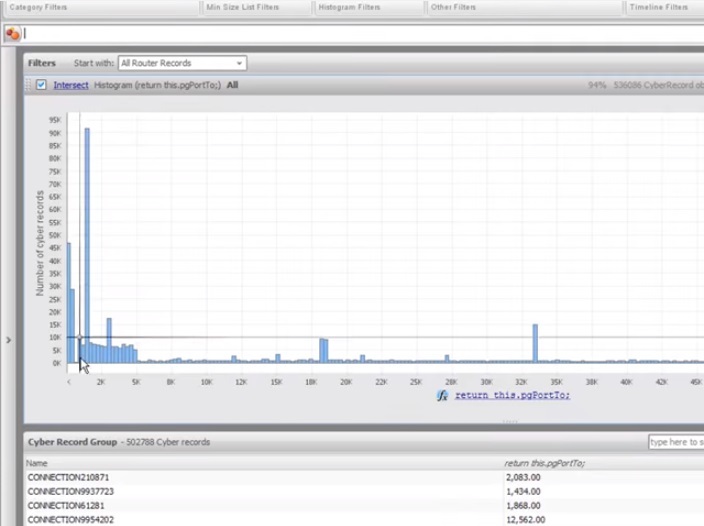
1:21 The histogram shows us several different things: first, we see that almost all the ports were involved.
1:27 The highest concentration of activity is noticeable in ports up to 5000, which makes sense, since this segment includes the most frequently used ports, for example, the AD port for HTTP or port 23 for Telnet.

1:37 Let's look at the largest column.
1:41 Looking at the field below, we see that this column refers to port 1434, which is significant, as this port is used for MS SQL, and it is often the target of a SQL slammer worm.
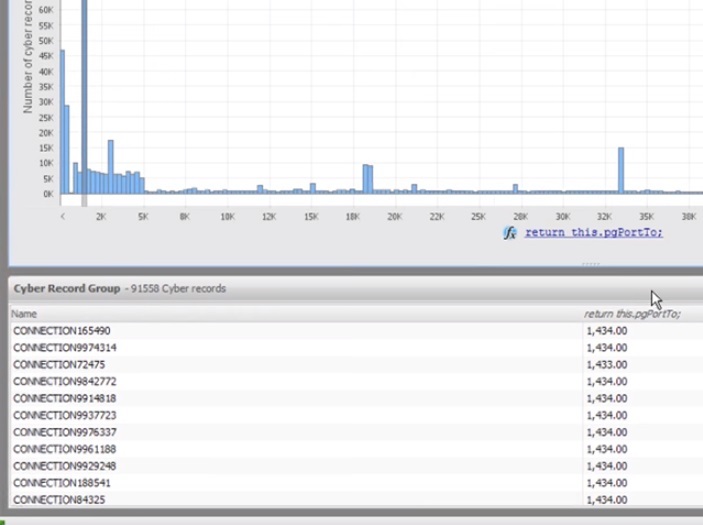
1:51 Ports with higher numbering are less commonly used for legitimate purposes, so we examine one of these port segments.
1:56 We can click on the port segment to filter the results by objects from this segment.
2:00 This segment may contain several ports, but we are only interested in one, the most frequently involved.
2:07 We can use “zoom” (Zoom) - one of the selection functions in the histogram.
2:09 Increasing, we see that port 18100 is responsible for almost all connections.

2:15 We will allocate this port to investigate connections addressed to it.
2:20 Let's see how these connections are distributed by IP address.
2:25 We can add a category filter to see all the IP addresses that are targeted for this segment (ports).
2:30 We see that almost all connections are addressed to the same IP.
2:33 We’ll highlight this address to see only connections connected to it.
2:37 Now we examine these connections by the time they appear.
2:41 We’ll do this by adding a “connection time” filter.
2:45 We can see that the entire mass of connections occurred within ten hours, and the number of connections grew, reached a peak, and eventually disappeared.
2:53 This is an interesting example, we will come back to it later.
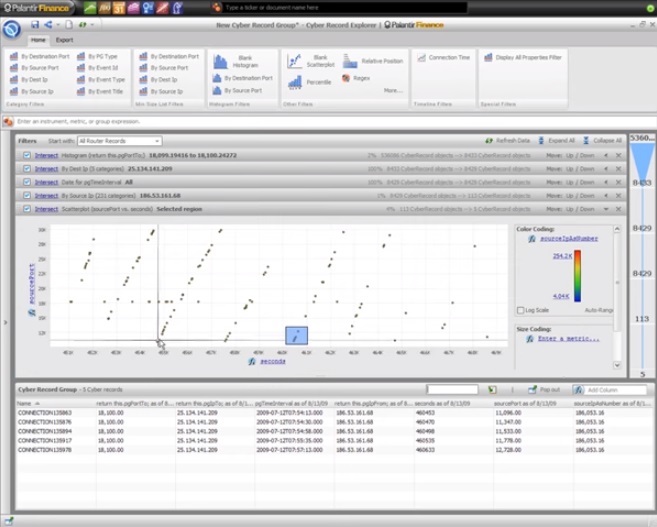
2:56 To get a better idea of the data, let's explore the sources of these connections. Especially, we want to see such connection characteristics as the IP address and source port by connection time.
3:07 We can investigate this with the scatterplot filter.
3:12 For the X axis, we take time; for the Y axis, the port of the connection source.
3:20 We can use colors as the third axis, the value is the IP address of the source of the connection.
3:31 This means that the same source IP addresses will be the same color.
3:37 We can see something interesting here: some ports were targeted only for a small number of IP addresses, which we can see at points of similar color and located only horizontally.
3:47 A number of other ports seem to be the target for all the multiple IP addresses.
3:52 We can also see several diagonal orange stripes, let's examine them in more detail.
4:00 The fact that the lanes are diagonal means that the port number of the connection source has increased steadily.

4:06 The fact that the bands are close in color means that the connection came from similar IP addresses.
4:09 Let's see if we can concentrate on them.
4:13 To begin, pick a strip. Once we have selected several numbers from the band, we can add a filter by IP address of the connection source.

4:23 And we see that all these connections came from the same IP, which I expected in color.
4:29 We can isolate this IP and put this filter on top of another to refine the scatterplot results.
4:35 We can minimize the filter by category and see the scatter diagram only at this IP address.
4:41 We see that this IP address is undoubtedly being redirected to different sending ports, over time. This is a classic port scanning behavior.
4:50 This work revealed suspicious activity: many different IPs cyclically and through many ports were aimed at connecting to one IP and one port in a short period of time.
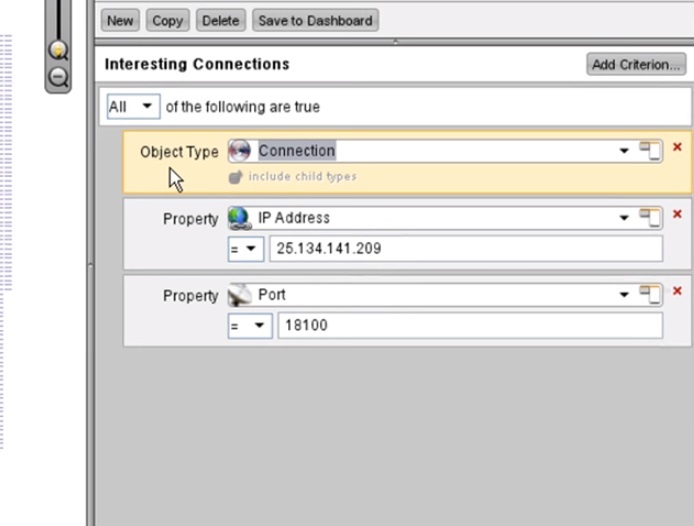
5:02 Now we use the Palantir Goverment to analyze this data over time and by geography.
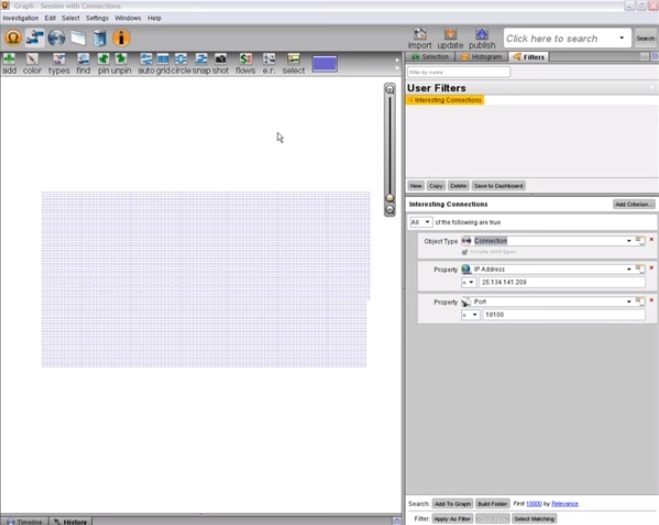
5:06 We created a filter to compact a subset of the data that we found interesting with Palantir Finance. The filter parameters are objects “connection”, aimed at the IP address 25.134.141.209 and port 18100.
5:20 Filter results appeared on the graph.
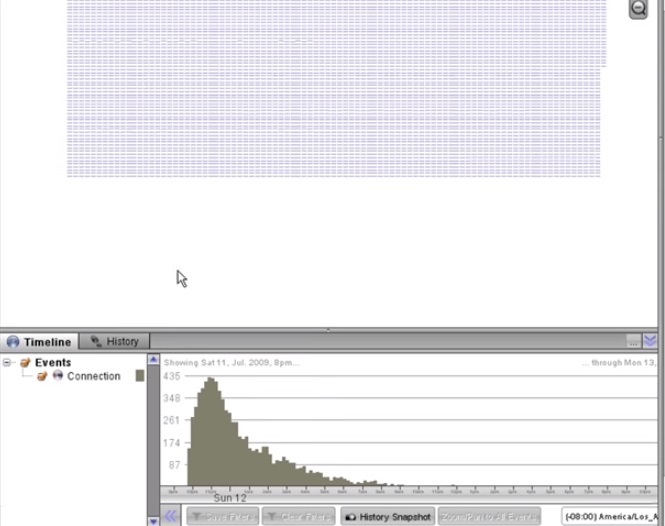
5:25 We can open the timeline and see that it is similar to the one we saw in Palantir Finance.
5:30 Now we drag these objects onto the map to see the location of the IP addresses of these connections.
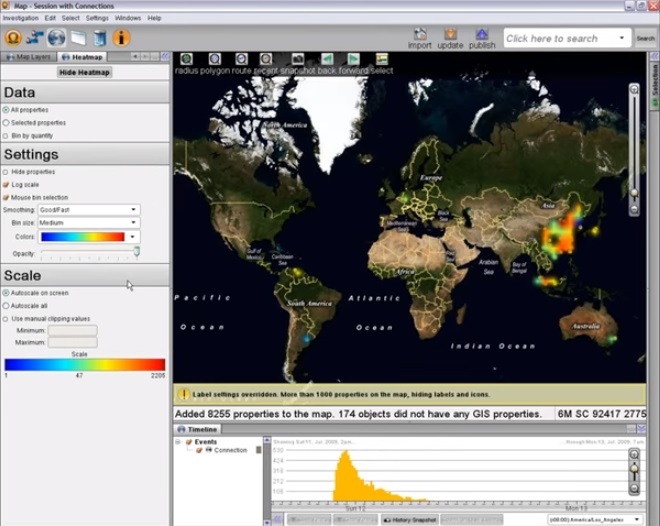
5:37 A heat map using color helps to see the density of connections.
5:42 We see the highest density in China.
5:47 With the help of the time line, we can see how events have developed.
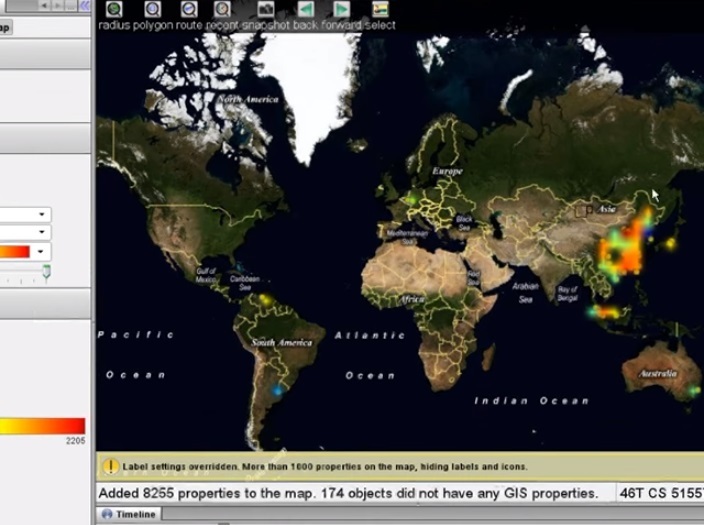
5:51 We create a time window and move it to see how the heat map reacts.

5:57 We see connections started in China, then spread to Japan and Indonesia, then we see areas in South America, Europe, and Australia.
6:11 Finally, when the connection speed is over, they are concentrated again in China and Indonesia.
6:23 This timeline and activation scheme clearly indicates a botnet attack. When an attack begins, and an increasing number of computers are drawn into it, the number of connections rises to a peak, then gradually decreases as each computer tries to make a different number of connections or connects at a different speed.
6:40 During this work session, we used Palantir Finance to explore a large amount of data, and successfully reduced it to a subset of data using filters.
6:49 We were able to see several characteristics of the data and found suspicious activity.
6:56 The results of our work at Palantir Finance were opened in Palantir Goverment, which made it possible to carry out a geographical and temporal analysis, which made it possible to visualize how events developed.
7:05 Ultimately, our analysis ended with the disclosure of activity, which is most likely a botnet attack.
7:11 The same techniques that we used in disclosing characteristic features of a botnet attack from a large amount of connection data can be used to detect other malicious activity on the network, including narrow-non-disassemble-what, data extraction, attacks using methods social engineering, and more.
7:26 All of this: Palantir Cyber combined offer, is a turnkey solution for dealing with the most burdensome network tasks faced by government and commercial institutions.

More about Palantir:
Together with the company Edison we continue the spring marathon of publications.
I will try to get to the primary sources of IT-technologies, to understand how they thought and what concepts were in the minds of the pioneers, what they dreamed about, how they saw the world of the future. Why did you think “computer”, “network”, “hypertext”, “intelligence amplifiers”, “collective problem solving system”, what meaning did they put into these concepts, what tools they wanted to achieve a result.
I hope that these materials will serve as an inspiration for those who are wondering how to go “from Zero to Unit” (to create something that had never happened before). I would like IT and “programming” to stop being just “coding for the sake of dough”, and recall that they were conceived as a lever to change themethods of warfare, education, a way of working together, thinking and communication, as an attempt to solve world problems and answer facing humanity. Something like this.
0 March. Seymour papert
March 1. Xerox alto
March 2, "Call Jake." NIC and RFC history
March 3, Grace "Grandma COBOL" Hopper
March 4 Margaret Hamilton: "Guys, I'll send you to the moon"
March 5, Hedy Lamarr. And in the movie naked to play and torpedo the bullet into the enemy
March 7 Gorgeous Six: girls who had a thermonuclear explosion calculated
March 8, "Video Games, I'm your father!"
March 9th Happy Birthday to Jeff Raskin
March 14 Joseph "Lick" Liclider: "Intergalactic computer network" and "Symbiosis of man and computer"
March 15 Vanivar Bush: “How We Can Think” (As We May Think)
March 16th Happy birthday, Richard Stallman
March 21 Douglas Engelbart: "The Mother of All Demos". Part 1
Together with Edison, we continue to investigate the capabilities of the Palantir system.
“I hope there are not many years left before the human brain and computers will be closely connected, and the resulting partnership will think like the human brain can never, and process the data in ways that are not available to the machines we know.” Said Joseph Liklider 56 years ago , he started the department of information technology in leading universities in America and began to build ARPANET. “People will set goals, formulate hypotheses, define criteria, and carry out assessment. Computers will do routine work to clear the way for technical and scientific discoveries. ”
')
“The complementarity of a person and a computer is not only a global fact. It is also the way to build a successful business. I realized this from my own experience with PayPal. In the mid-2000s, our company, having survived the collapse of the dot-com bubble, quickly grew, but we were disturbed by one serious problem: due to credit card fraud, we lost more than $ 10 million monthly. Performing hundreds and even thousands of translations per minute, we could not physically track each of them - no team of controllers could work at this speed. We did what any team of engineers would do in our place: we tried to find an automated solution. ”
Peter Thiel said and founded Palantir.
Under the kat case about how using a tool for financial analytics, you can open a botnet.
The case is “fictional,” but the screenshots show 2009 data.
(For help with the translation, thanks to Vorsin Alexey)
0:00 This video will show how using Palantir for financial analytics, we can explore non-financial data structured over time.
0:09 To be precise, we’ll show a revelation of a possible botnet attack made on the basis of analyzing a certain number of cyberdata using Palantir Finance and Palantir Goverment.
0:16 All information about connections rejected by a router in four days will be given.
0:22 We’ll see how the analyst will examine the data and investigate what looks suspicious.
0:28 We will start at a very general level, over the entire set of objects and we will add filters one by one, thus going down, step by step.
0:35 The field below will show the filtered objects.
0:41 To get started, we will distribute the data on rejected connections to the ports to which they are directed. We do this using a filter.
0:48 There are many types of filters for researching data.
0:51 We can filter by data properties, and for this we use filters on the left, at the top of the screen.
0:54 By numeric values using a histogram and other filters.
0:58 By time-based properties using timeline filters.
1:01 We want to find out how many connections were rejected on all ports of destination, so we will add a filter “by port destination”.
1:10 The histogram filter shows us the distribution of destination ports.
1:14 Along the X axis there are different groups of ports, along the Y axis we see how many connections are fixed in the port bucket.
1:21 The histogram shows us several different things: first, we see that almost all the ports were involved.
1:27 The highest concentration of activity is noticeable in ports up to 5000, which makes sense, since this segment includes the most frequently used ports, for example, the AD port for HTTP or port 23 for Telnet.
1:37 Let's look at the largest column.
1:41 Looking at the field below, we see that this column refers to port 1434, which is significant, as this port is used for MS SQL, and it is often the target of a SQL slammer worm.
1:51 Ports with higher numbering are less commonly used for legitimate purposes, so we examine one of these port segments.
1:56 We can click on the port segment to filter the results by objects from this segment.
2:00 This segment may contain several ports, but we are only interested in one, the most frequently involved.
2:07 We can use “zoom” (Zoom) - one of the selection functions in the histogram.
2:09 Increasing, we see that port 18100 is responsible for almost all connections.
2:15 We will allocate this port to investigate connections addressed to it.
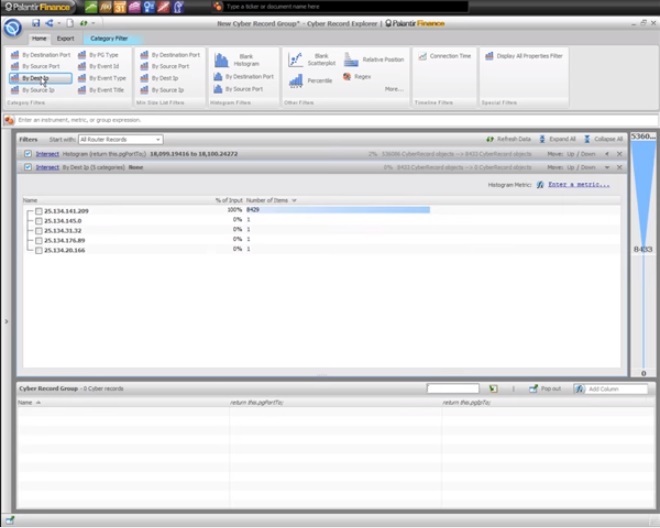
2:20 Let's see how these connections are distributed by IP address.
2:25 We can add a category filter to see all the IP addresses that are targeted for this segment (ports).
2:30 We see that almost all connections are addressed to the same IP.
2:33 We’ll highlight this address to see only connections connected to it.
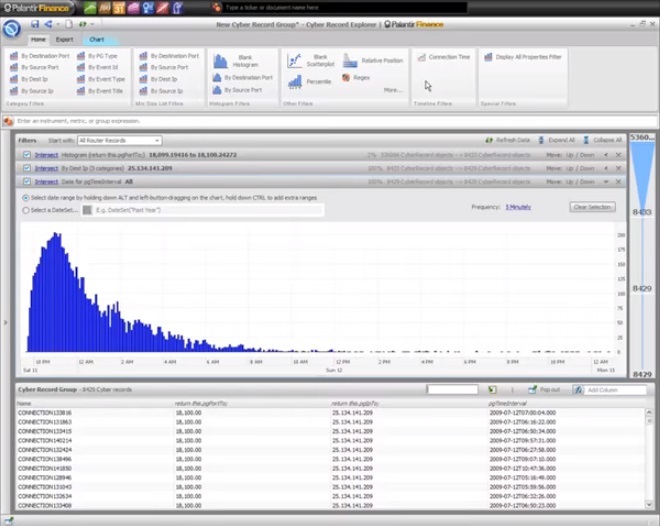
2:37 Now we examine these connections by the time they appear.
2:41 We’ll do this by adding a “connection time” filter.
2:45 We can see that the entire mass of connections occurred within ten hours, and the number of connections grew, reached a peak, and eventually disappeared.
2:53 This is an interesting example, we will come back to it later.
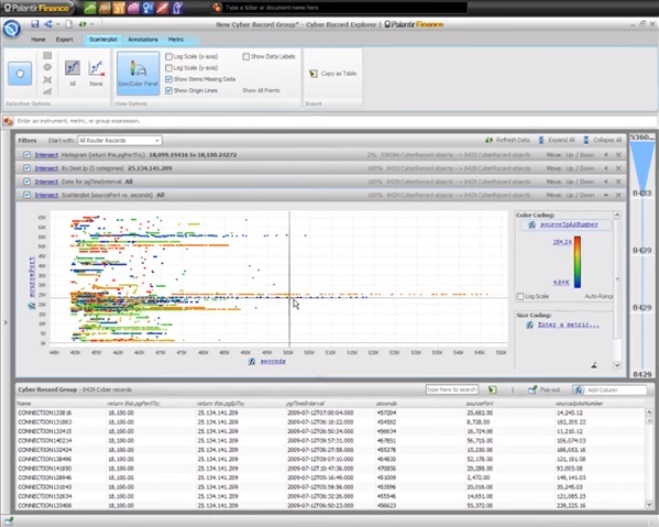
2:56 To get a better idea of the data, let's explore the sources of these connections. Especially, we want to see such connection characteristics as the IP address and source port by connection time.
3:07 We can investigate this with the scatterplot filter.
3:12 For the X axis, we take time; for the Y axis, the port of the connection source.
3:20 We can use colors as the third axis, the value is the IP address of the source of the connection.
3:31 This means that the same source IP addresses will be the same color.
3:37 We can see something interesting here: some ports were targeted only for a small number of IP addresses, which we can see at points of similar color and located only horizontally.
3:47 A number of other ports seem to be the target for all the multiple IP addresses.
3:52 We can also see several diagonal orange stripes, let's examine them in more detail.
4:00 The fact that the lanes are diagonal means that the port number of the connection source has increased steadily.
4:06 The fact that the bands are close in color means that the connection came from similar IP addresses.
4:09 Let's see if we can concentrate on them.
4:13 To begin, pick a strip. Once we have selected several numbers from the band, we can add a filter by IP address of the connection source.
4:23 And we see that all these connections came from the same IP, which I expected in color.
4:29 We can isolate this IP and put this filter on top of another to refine the scatterplot results.
4:35 We can minimize the filter by category and see the scatter diagram only at this IP address.
4:41 We see that this IP address is undoubtedly being redirected to different sending ports, over time. This is a classic port scanning behavior.
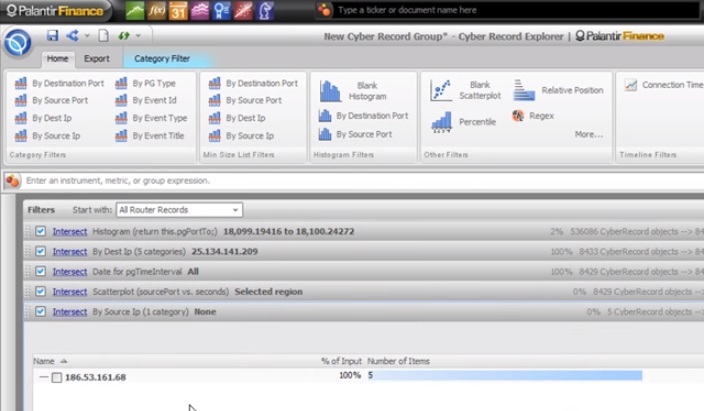
4:50 This work revealed suspicious activity: many different IPs cyclically and through many ports were aimed at connecting to one IP and one port in a short period of time.
5:02 Now we use the Palantir Goverment to analyze this data over time and by geography.
5:06 We created a filter to compact a subset of the data that we found interesting with Palantir Finance. The filter parameters are objects “connection”, aimed at the IP address 25.134.141.209 and port 18100.
5:20 Filter results appeared on the graph.
5:25 We can open the timeline and see that it is similar to the one we saw in Palantir Finance.
5:30 Now we drag these objects onto the map to see the location of the IP addresses of these connections.
5:37 A heat map using color helps to see the density of connections.
5:42 We see the highest density in China.
5:47 With the help of the time line, we can see how events have developed.
5:51 We create a time window and move it to see how the heat map reacts.
5:57 We see connections started in China, then spread to Japan and Indonesia, then we see areas in South America, Europe, and Australia.
6:11 Finally, when the connection speed is over, they are concentrated again in China and Indonesia.
6:23 This timeline and activation scheme clearly indicates a botnet attack. When an attack begins, and an increasing number of computers are drawn into it, the number of connections rises to a peak, then gradually decreases as each computer tries to make a different number of connections or connects at a different speed.
6:40 During this work session, we used Palantir Finance to explore a large amount of data, and successfully reduced it to a subset of data using filters.
6:49 We were able to see several characteristics of the data and found suspicious activity.
6:56 The results of our work at Palantir Finance were opened in Palantir Goverment, which made it possible to carry out a geographical and temporal analysis, which made it possible to visualize how events developed.
7:05 Ultimately, our analysis ended with the disclosure of activity, which is most likely a botnet attack.
7:11 The same techniques that we used in disclosing characteristic features of a botnet attack from a large amount of connection data can be used to detect other malicious activity on the network, including narrow-non-disassemble-what, data extraction, attacks using methods social engineering, and more.
7:26 All of this: Palantir Cyber combined offer, is a turnkey solution for dealing with the most burdensome network tasks faced by government and commercial institutions.
More about Palantir:
- Palantir and money laundering
- Palantir: arms trade and the spread of the pandemic
- Palantir, PayPal Mafia, special services, world government
- Palantir 101. What is allowed to ordinary mortals to know about the second most abrupt private company in Silicon Valley
Together with the company Edison we continue the spring marathon of publications.
I will try to get to the primary sources of IT-technologies, to understand how they thought and what concepts were in the minds of the pioneers, what they dreamed about, how they saw the world of the future. Why did you think “computer”, “network”, “hypertext”, “intelligence amplifiers”, “collective problem solving system”, what meaning did they put into these concepts, what tools they wanted to achieve a result.
I hope that these materials will serve as an inspiration for those who are wondering how to go “from Zero to Unit” (to create something that had never happened before). I would like IT and “programming” to stop being just “coding for the sake of dough”, and recall that they were conceived as a lever to change the
0 March. Seymour papert
March 1. Xerox alto
March 2, "Call Jake." NIC and RFC history
March 3, Grace "Grandma COBOL" Hopper
March 4 Margaret Hamilton: "Guys, I'll send you to the moon"
March 5, Hedy Lamarr. And in the movie naked to play and torpedo the bullet into the enemy
March 7 Gorgeous Six: girls who had a thermonuclear explosion calculated
March 8, "Video Games, I'm your father!"
March 9th Happy Birthday to Jeff Raskin
March 14 Joseph "Lick" Liclider: "Intergalactic computer network" and "Symbiosis of man and computer"
March 15 Vanivar Bush: “How We Can Think” (As We May Think)
March 16th Happy birthday, Richard Stallman
March 21 Douglas Engelbart: "The Mother of All Demos". Part 1
Source: https://habr.com/ru/post/280930/
All Articles