Mythbusters: Automatic Google Recaptcha Solution
 Hello! I embody interesting ideas in python and talk about what came of it. Last time I tried to find anomalies on the property price map. Just. This time the idea was to build a system that would be able to solve the very popular Google Recaptcha 2.0 now, based on some algorithms and a large base of training examples.
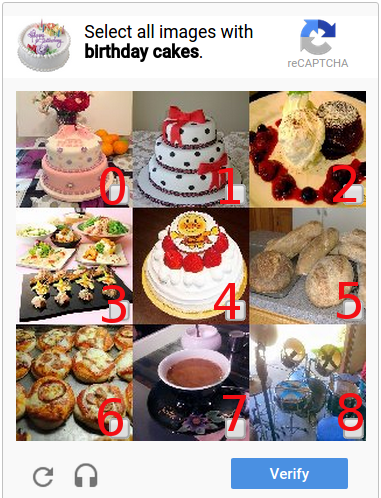
Google Recaptcha 2.0 is a set of images (9 or 16 square pictures under one instruction), among which the user, in order to confirm his rationality, needs to select all images of one category. This is NOT about building a machine learning system - we’ll recognize the captcha!
 If the reader does not want to go into the details of the technical plan and the romance of research, then the conclusion of the whole article will be concentrated near the BCG at the end.
The training samples of the captcha for this study were kindly provided by the anti- captcha service RuCaptcha.com, which developed an API for accessing the samples of the resolved captchas specifically for my research.
It is worth noting that Google does not have a very large set of instructions for captchas (example: Select all images with recreational vehicle) in all major languages of the world, and some instructions are much more common. Further in the article under the type will be meant exactly the instructions for the captcha.
Thousands of images
After uploading and sorting a trial batch of images, I began to manually disassemble different types of captchas. First of all, I built md5 sums from all captcha of one type in the hope of finding a match. The easiest way did not work - there was simply no coincidence. Why? - I have the right!
Strolling through the eyes of the image icons, we found something interesting. Here, for example, 4 identical limousine:

Identical, but not quite - this is noticeable in the size of the wheels in the lower left corners. Why were limousines chosen for comparison? It was easiest to look through their eyes - the pictures of road signs or street names merge into one, and it was easy to search for similar limousines or pickups. Having appreciated images of different types in my eyes, in many I saw recurring captchas with different deformations - stretching, compression or displacement. Having found a suitable function of image similarity and having collected a sufficient base, one could hope for some success.
Perceptive hash
Almost all search queries lead to it. On Habré, you can find quite a lot of articles on perceptual hash ( 1 , 2 , 3 , 4 ). The python library ImageHash , which uses the NumPy and SciPy packages, was also quickly found.')
How does Perceptive Hash work? In short:
dct = scipy.fftpack.dct(scipy.fftpack.dct(pixels, axis=0), axis=1) dctlowfreq = dct[:hash_size, :hash_size] med = numpy.median(dctlowfreq) diff = dctlowfreq > med - The image is compressed to the size of hash_size.
- From the value of the resulting pixel is taken discrete Fourier transform.
- From the Fourier transform is considered the median.
- The Fourier transform matrix is compared with the median and as a result we get the matrix of zeros and ones.
Thus, we can distinguish from the image some invariant that will not change with minor changes in the original image. Standard hash_size is equal to 8 and it showed itself well on trial comparisons. One of the remarkable properties of this hash is that they can be compared and their difference looks like a natural number.
Now I will explain. The image hash is a matrix of zeros or ones (zero is below the median, and one is above). To find the difference, the matrices are compared element by element and the difference value equals the number of different elements in the same positions. A sort of XOR on the matrix.
Tens of thousands of images
Perceptual hash well defined the similarity between the same limousine, but with different deformations, and the difference between completely different images. However, the hash is more suitable for describing the forms depicted in the picture: with an increase in the number of caps, matches in the shape of objects are inevitable, but not in the content of the picture (with a certain trigger threshold, of course).
So it happened. With the increase in the captcha base, there was a growing need to add another comparative value for images.
The objective color characteristic of the image can be described by a histogram of the intensity of colors. The distance function for two histograms (also known as the difference function) is the sum of the standard deviations of the histogram elements. Pretty good bunch is obtained.
The paragraph about the selection of the boundaries of the operation and the mechanism for finding similar images
The maximum allowable differences for the hashes were set manually:
In paragraph 1, I mentioned that the group has a “chapter”: When searching for similar images, the captcha is compared not with the entire base, but only with the heads of groups of similar images. In each group it is guaranteed that all the images are similar with the head, but their similarity with each other is not guaranteed. This way some winnings in speed.
A little later, I learned about greedy search algorithms, but it was too late. In theory, such a knee-length algorithm searches for the first, rather than the most appropriate image, as in the greedy search algorithm. However, this only hinders when searching for all types of instructions at once.
- We have trigger thresholds for perceptual hash and histrogram differences: max phash distance and max histogram distance
- For all images of the same type, we build groups similar, where each captcha corresponds to a pair of numbers — the distance to the “head” of the phash distance and histogram distance groups
- Open the entire group of images and visually check for errors
- In the case of false positives, adjust one of the thresholds.
In paragraph 1, I mentioned that the group has a “chapter”: When searching for similar images, the captcha is compared not with the entire base, but only with the heads of groups of similar images. In each group it is guaranteed that all the images are similar with the head, but their similarity with each other is not guaranteed. This way some winnings in speed.
A little later, I learned about greedy search algorithms, but it was too late. In theory, such a knee-length algorithm searches for the first, rather than the most appropriate image, as in the greedy search algorithm. However, this only hinders when searching for all types of instructions at once.
On the one hand, considering the fact that the difference between phash and images that are very close in shape will be zero, and imagining that the percentage of false positives will be low enough, you might think that using only a perceptual hash will be faster than using two hashes. But what does practice say?
For comparison, I used two samples of captcha of different types of 4000 images. One type has a good "similarity", and the other - on the contrary. By similarity (she's compressibility) I mean the probability that 2 random images of the same type with given thresholds will be the same in terms of hashes. The evaluation results are as follows:
instructions : phash only : both hashes ( !) : 0.001% : 0.002% : 52.97% : 60.12% More than half of the images of limousines are similar to each other, wow! When using both hashes, the result is still better, but what about the performance?
instructions : phash only : both hashes ( !) : 31.37s : 31.06s : 17.85s : 17.23s Surprisingly, using both hashes was faster than using only perceptual hash with zero maximum deviation. Of course, this is due to the difference in the number of image comparison operations, and this, moreover, that comparing a histogram of 300 values is slower than comparing perceptual hashes of 8 bytes in size by 28.7%!
Hundreds of thousands of images
Performance problems made themselves felt on a really large sample size. For the most popular types, the search time for similar images on my laptop was already seconds. Required search optimization with minimal loss of accuracy.
Changing the accuracy of phash didn't seem like a good idea to me. Therefore, we will look closely at the histogram of the intensity of colors of a captcha:

If I were asked to briefly describe this histogram, then I would say this: “A sharp peak at the abscissa value of 55, then a gradual reduction in the graph and two local minima at 170 and 220”. If we take more graphs of histograms from similar caps, then we note that these graphs repeat in form with each other with small errors in the position of maxima and minima (extremes). So why not use these values in order to deliberately cut off the unlike?
Okay Google, how to find extremes in the graph on python?
import numpy as np from scipy.signal import argrelextrema mins = argrelextrema(histogram, np.less)[0] maxs = argrelextrema(histogram, np.greater)[0] The argrelextrema function description says it all: Calculate the relative extrema of data.
However, our histogram is too jagged and there are much more local extremums than necessary. It is necessary to smooth the function:
s = numpy.r_[x[window_len-1:0:-1],x,x[-1:-window_len:-1]] We average the graph by the sliding window algorithm. The window size was chosen experimentally so that the number of minima or maxima was on average 2, and stopped at a value of 100 pixels. The result of this algorithm is a beautiful, smooth and ... extended schedule. Extended even on window size.

The positions of extrema shift accordingly:
mins = array([ 50, 214, 305]) maxs = array([116, 246]) Extremum distribution statistics
For all the available images with two local minima (or maxima) I summed up the statistics of their positions. On the graphs there were huge peaks (up to 100x), which, for clarity, had to be shortened.
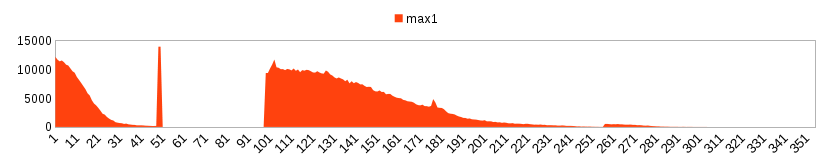

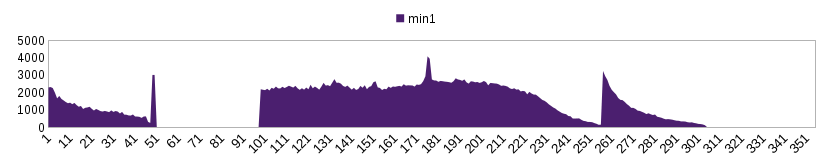


 Extreme graphs can be visually divided into two parts at 101. Why does this happen? After filtering, it turned out that these are two completely different and almost non-intersecting groups of images, with about 200k images of different types located to the left of the mark. Such a tricky distribution gives the dark captcha like those on the right. A similar situation, but with images much lighter, can be observed at the minima.
Extreme graphs can be visually divided into two parts at 101. Why does this happen? After filtering, it turned out that these are two completely different and almost non-intersecting groups of images, with about 200k images of different types located to the left of the mark. Such a tricky distribution gives the dark captcha like those on the right. A similar situation, but with images much lighter, can be observed at the minima.Comparing many graphs of similar captchas, I found that the allowable deviation from the positions of local extremes would be 3-4 pixels. By adjusting this value downwards, greater filtering and acceleration of the algorithm can be achieved by decreasing compressibility.
Of course, there could be recognition errors in the captcha from RuCaptcha. To combat them, a captcha rating system was introduced. If the md5 of the new captcha is already contained in the database, but with a different type of instruction, then the old captcha increases the failure counter, and if the type of the old captcha coincides with the new one, then the popularity counter increases. Thus, a natural adjustment of wrong decisions is introduced - when looking for similar ones, only captchas with popularity> failure are taken into account.
My first million
For all the time of research work, more than a million solved caps were collected. For data storage, the PostgreSQL database was used, in which it was convenient to store hashes and histogram value arrays. Speaking of histogram storage - to calculate the distance between two histograms, it is not necessary to store all 255 + window_size values. When using half or even a third of the array values, the accuracy of the distance drops slightly, but it saves disk space.
For this sample captcha statistics will be very accurate.
Below are data on the most “compressible” and most popular captcha (3 lines each):
(%) 15274 5508 64 2453 928 62 5261 2067 61 ( !) 201872 189473 6 137893 134695 2 94569 92824 2 Pareto's law in its pure form: 11% of instructions give ~ 80% of all captcha (and 20% of instructions give 91% of all captcha). And statistics is not in favor of the most compressible types.
Google itself says so:
CAPTCHA reCAPTCHA
Every time our CAPTCHAs are solved, that human effort helps to digitize the text, annotate images, and build it up. Maps, and solve hard AI problems.
Hinting that through the decision of captchas by people he ensures their automatic rotation. Google made a bid for a small set of instructions with a good level of image rotation, such as road signs or street names.
 The task did not include an item about checking for a real Google reCaptcha, so as an alternative, I will use the following algorithm for all new training images:
- The input is captcha 3x3 or 4x4 and is divided into 9 or 16 images, respectively.
- According to the algorithms described above, for all 9 or 16 images, a similar one is selected for ALL types in the database
- Image indices of the found solution are compared with the indices of the reference solution.
- If the difference (the number of different indices) between solutions is 50% or more, then the captcha is considered unsolved.
In the example to the left, if the data from the database (automatic solution) says that the correct indices are 0, 1, 3, and the reference solution is 0, 1, 4, then the indices differ by indices 3 and 4. In this example, 2 matching and 2 different index, i.e. captcha is not solved.
Since in most caps 3x3 3 (+ -1) indexes are correct, such an algorithm will give similar results as on natural reCaptcha .
In paragraph 2, the solution could be selected in different ways:
- For each image, do a search on ALL image types in the database and then select only those that correspond to the type of instruction. This approach will allow you to find out the statistics of the decisions and on the non-target images too, and also check the effect of false positives on the accuracy of the decisions.
- For each image search only one type of instruction. Such a search is much faster and does not give false positives from the first method in principle.
Below is collected the dynamics of the results of solving for several days:
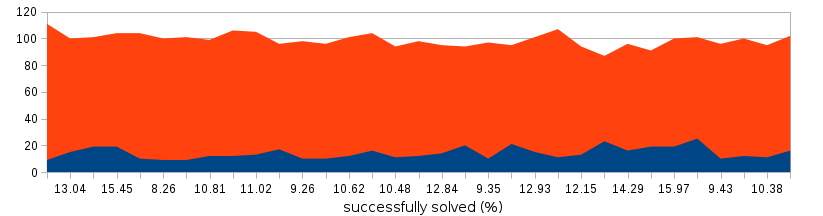
On average, the assembled system guessed google captchas with a probability of 12.5%, thereby leading a weighty argument in favor of Google solutions.
To my surprise, the leader in the number of solutions was one of the most poorly compressed captcha (statistics for several samples):
(%) (%) 142 14.03 2 ( !) 80 7.91 6 68 6.72 40 ( ) 58 5.73 43 ( ) 58 5.73 43 57 5.63 43 And there were slightly more non-targeted caps (55%) than target (45%). Target captchas are those whose images when searching among the entire database (and not just for one type of instruction) are successfully found and their type corresponds to the type of captcha instruction. In other words - there are 3 images with limousines and 3.66 images with any other types in the average 3x3 captcha for limousines.
The study showed that, based on the perceptual hash and color histograms, it is impossible to build a captcha solution system, even using huge training samples. This reCapthca result is achieved due to the proper rotation of the most popular types of caps.
I am grateful to RuCaptcha for the pleasant communication and, with their permission, spread the training sample into the open access to the yandex disk (hurry to download, the disc is paid for a month):
Yandex disk does not know how to download files larger than 10 gigabytes, therefore, researchers are faced with the task of gluing a tar archive of 3 parts.
My thoughts on machine learning don't leave me on the same sample :) In the meantime, I am sharing the source code of the system in python.
Source: https://habr.com/ru/post/280812/
All Articles