Microservice Architecture, Spring Cloud and Docker
Hi, Habr. In this article, I will briefly discuss the details of the implementation of the microservice architecture using the tools provided by Spring Cloud using the simple concept concept of the application as an example.
The code is available for review on githaba . Images are published on dokhekhabe, the entire zoo starts as a team.
I took the old forgotten project as a basis, the backend of which was a monolith. The application allows you to organize personal finances: make regular incomes and expenses, keep track of savings, read statistics and forecasts.
')
Functional Services
Let's try to decompose the monolith into several basic microservices, each of which will be responsible for a specific business task.
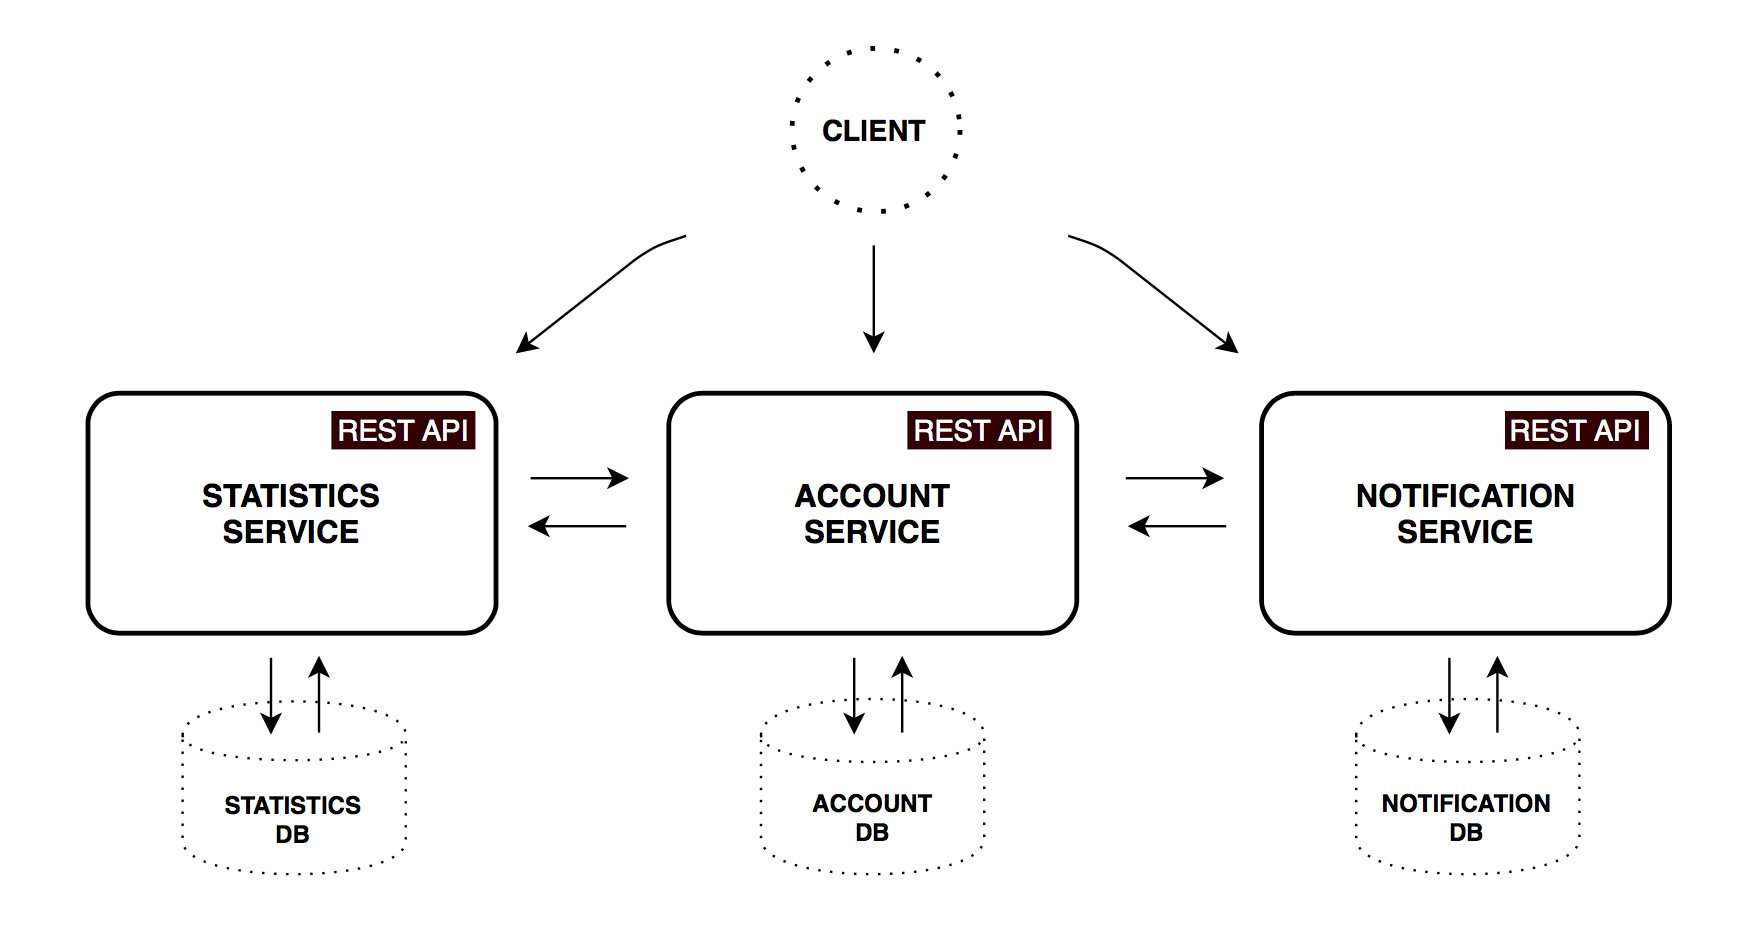
Account service
Implements logic and validation to preserve income, expenses, savings and account settings.
| Method | Way | Description | User is authorized | Available from UI |
|---|---|---|---|---|
| Get | / accounts / {account} | Get account details | ||
| Get | / accounts / current | Get current account details | × | × |
| Get | / accounts / demo | Get demo account details | × | |
| PUT | / accounts / current | Save current account details | × | × |
| POST | / accounts / | Register a new account | × |
Statistics service
Calculates the basic statistical parameters of the account, brings their values to the base currency and period, saves the data in a form convenient for subsequent analysis. The obtained time series will be used to display statistics and indicators for the past time and extrapolation to the user for the simplest predictions for the future.
| Method | Way | Description | User is authorized | Available from UI |
|---|---|---|---|---|
| Get | / statistics / {account} | Get statistics for the specified account | ||
| Get | / statistics / current | Get current account statistics | × | × |
| Get | / statistics / demo | Get demo account statistics | × | |
| PUT | / statistics / {account} | Create / update date point for specified account |
Notification service
Stores notification settings (frequency of reminders, frequency of backups). According to the schedule, it sends out e-mail messages, pre-collecting and aggregating the necessary data from the first two services, if required.
| Method | Way | Description | User is authorized | Available from UI |
|---|---|---|---|---|
| Get | / notifications / settings / current | Get notification settings for current account | × | × |
| PUT | / notifications / settings / current | Save notification settings for current account | × | × |
Notes
- All microservices have their own database, respectively, any data access can be obtained only through the application API.
- In this project, for simplicity, I used only MongoDB as the main database for each of the services. In practice, it may be useful to use an approach called Polyglot persistence — choosing the storage that is most suitable for the tasks of a particular service.
- Communication between services is also significantly simplified: only synchronous rest-requests are used. A common practice is to combine different modes of interaction. For example, synchronous GET requests for information and asynchronous requests using a queue server for create / update operations. Which, by the way, brings us into the world of eventual consistency - one of the important aspects of distributed systems that we have to live with.
Infrastructure services
To ensure collaboration of the services described above, we will use a set of basic patterns and practices of Microservice architecture. Many of them are implemented in Spring Cloud (in particular, through integration with Netflix OSS products) —in fact, these are dependencies that extend Spring Boot capabilities in one direction or another. Below is a brief overview of each of the components.
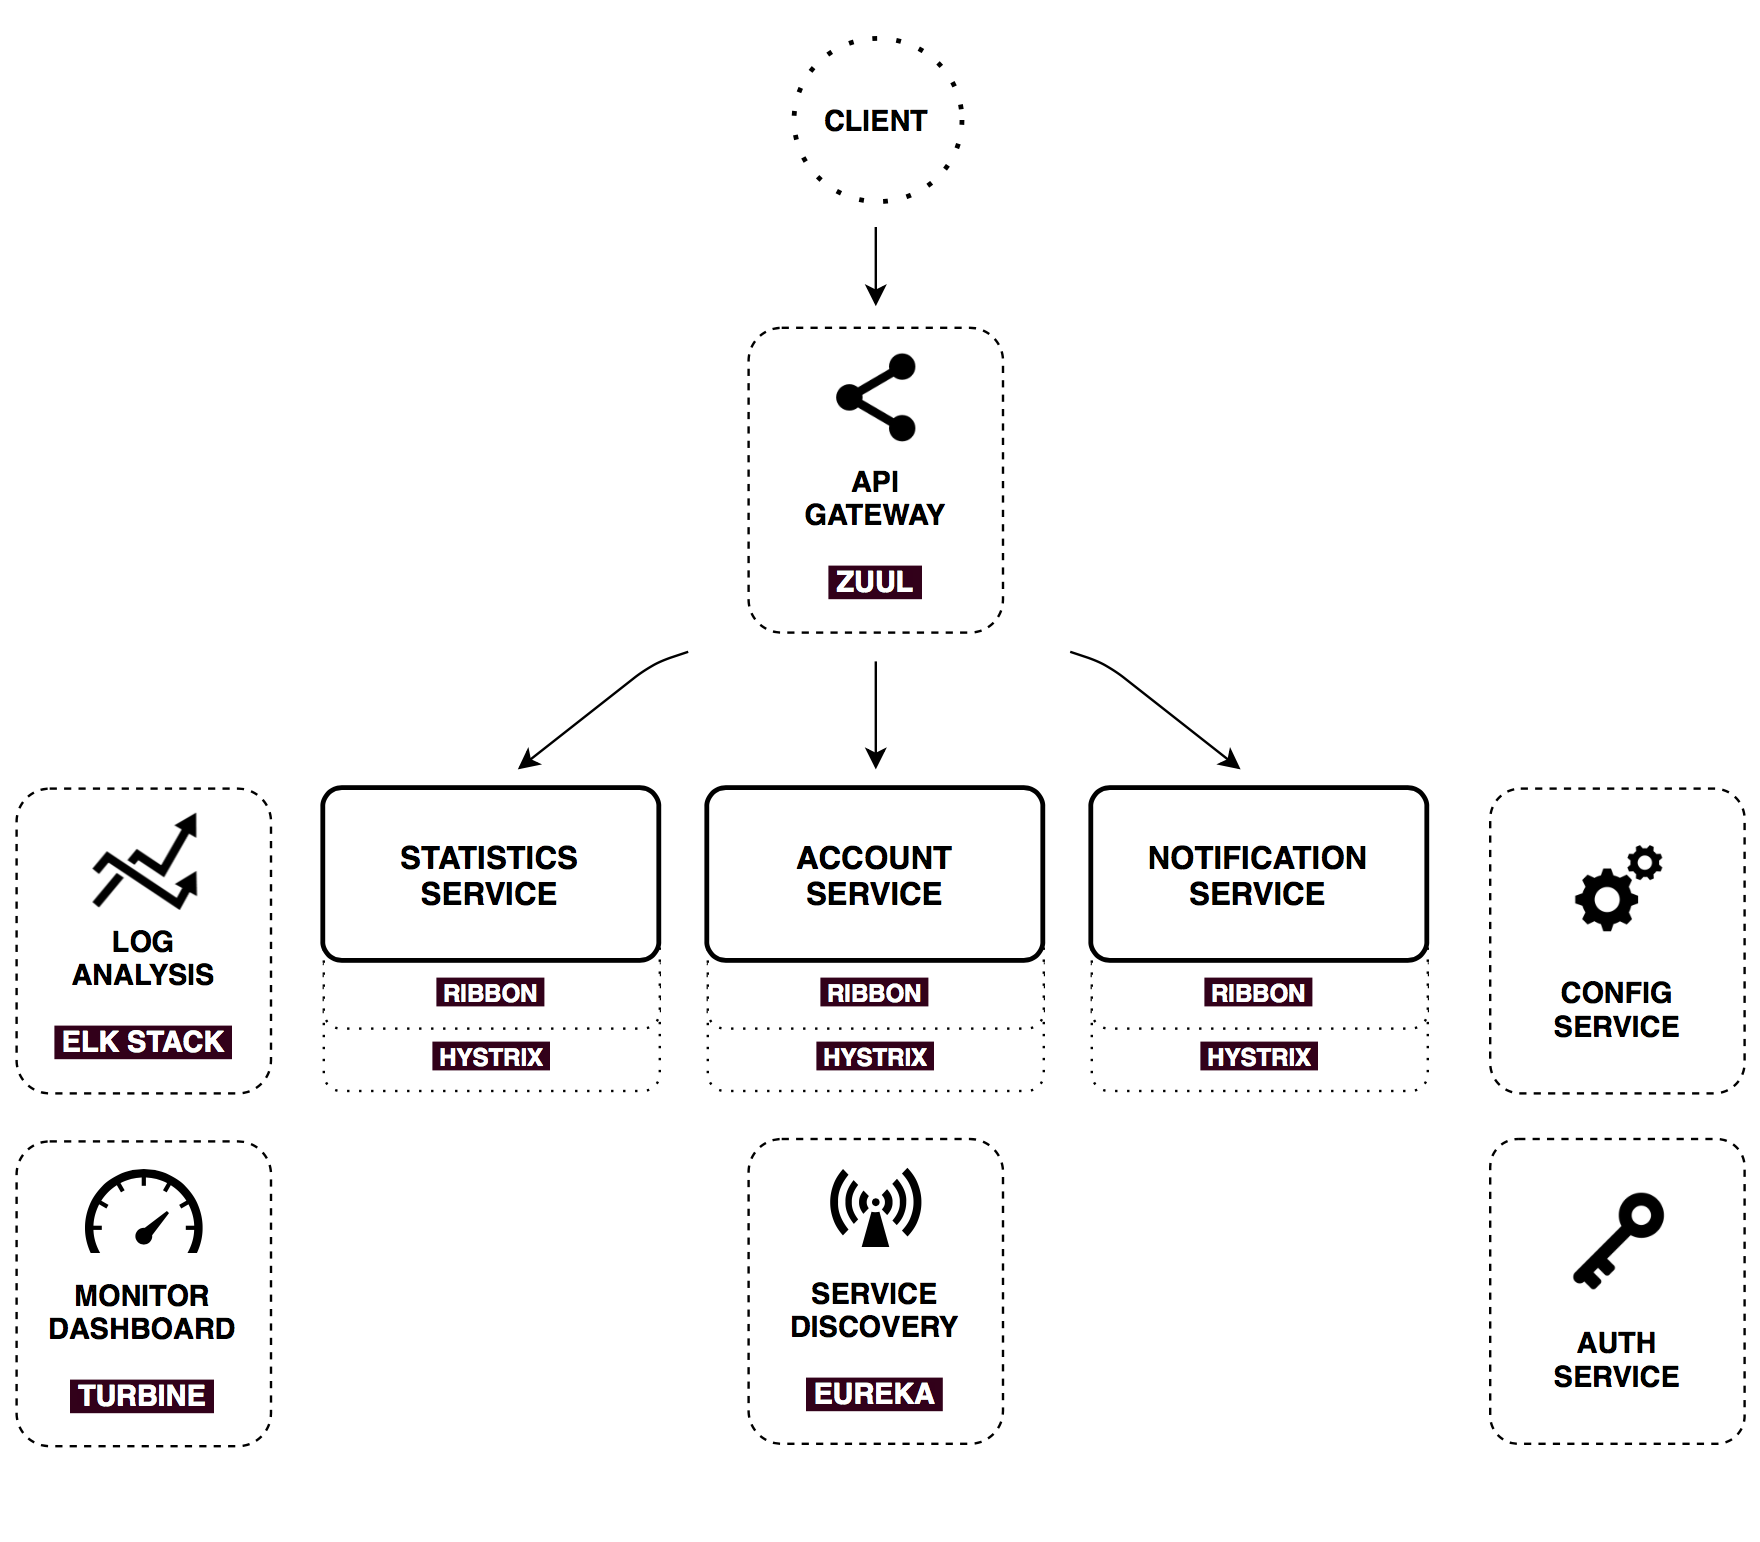
Config server
Spring Cloud Config is a horizontally scalable configuration storage for a distributed system. As a data source, Git, Subversion, and simple files stored locally are currently supported. By default, Spring Cloud Config gives files that match the name of the application requesting Spring (but you can pick up properties for a specific Spring profile and from a specific branch of the version control system).
In practice, loading configurations from version control systems is of most interest, but here for simplicity we will use local files. Place the shared directory in the application class, which will store the configuration files for all applications in the cluster. For example, if the Notification service requests a configuration, the Config server will respond to it with the contents of the file shared/notification-service.yml , combined with shared/application.yml (which is common to all).
On the client side, no configuration files are now required, except for bootstrap.yml with the application name and the Config server address:
spring: application: name: notification-service cloud: config: uri: http://config:8888 fail-fast: true Spring Cloud Config allows you to change your configuration dynamically. For example, the EmailService bean , annotated with @RefreshScope , can start sending out the modified text of an e-mail message without reassembly.
To do this, edit the Config server configuration file, and then execute the following request to the Notification service :
`curl -H "Authorization: Bearer #token#" -XPOST http://127.0.0.1:8000/notifications/refresh` This process can be automated by using configuration downloads from version control systems by setting up a webbook from Github, Gitlub, or Bitbucket.
Notes
- Unfortunately, there are significant limitations on dynamic configuration updates.
@RefreshScopedoes not work for@Configurationclasses and methods annotated with@Scheduled - The
fail-fastproperty, mentioned inbootstrap.ymlmeans that the application will stop downloading immediately if there is no connection to the Config Server. This is useful to us while simultaneously starting the entire infrastructure. - Advanced security settings are beyond the scope of this concept proof application. Spring Security provides ample opportunities for the implementation of security mechanisms. Using the JCE keystore to encrypt microservice passwords and information in configuration files is described in detail in the documentation .
Auth server
Responsibilities for authorization are completely taken out in a separate application that issues OAuth2 tokens for access to backend resources. Auth server is used both for user authorization and for secure communication service within the perimeter.
In fact, only one of the possible approaches is described here. Spring Cloud and Spring Security allow you to quite flexibly configure the configuration for your needs (for example, it makes sense to authorize on the API Gateway side, and send a request with user data already filled in to the infrastructure).
In this project, I use the Password credential grant type for user authorization and the Client credentials grant type for authorization between services.
Spring Cloud Security provides convenient annotations and autoconfiguration, which makes it quite easy to implement the described functionality from both the client and the authorization server.
On the client side, this is no different from traditional authorization using sessions. From the request, you can get the Principal object, check roles and other parameters using the @PreAuthorize annotation.
In addition, each OAuth2 application has a scope : server for backend services, ui for browser. So we can restrict access to some endpoints from the outside:
@PreAuthorize("#oauth2.hasScope('server')") @RequestMapping(value = "accounts/{name}", method = RequestMethod.GET) public List<DataPoint> getStatisticsByAccountName(@PathVariable String name) { return statisticsService.findByAccountName(name); } API Gateway
All three main services that we discussed above provide some API for the external user. In industrial systems built on the Microservice architecture, the number of components is growing rapidly - it is said that about 150 services are involved in the rendering of the page in Amazon.
Hypothetically, the client application could request each of the services independently. But this approach immediately comes across a lot of restrictions - the need to know the address of each endpoint, to make a request for each piece of information separately and independently merge the result. In addition, not all non-backend applications can support web-friendly protocols, and so forth.
To solve this kind of problem, use API Gateway - a single entry point. It is used to receive external requests and route to the necessary internal infrastructure services, the return of static content, authentication, stress testing, canary deployment, service migration, dynamic traffic management. In Netflix, if a blog post is about optimizing its API due to asynchronous aggregation of content from different microservices.
Netflix has implemented its API Gateway - Zuul implementation . Spring Cloud is natively integrated with it and is enabled by adding one dependency and annotation @EnableZuulProxy to the Spring Boot application. In this project, Zuul is used for the most basic tasks - returning statics (web application) and routing requests.
An example of prefix routing for the Notification service:
zuul: routes: notification-service: path: /notifications/** serviceId: notification-service stripPrefix: false Now every request whose uri starts with /notifications will be sent to the corresponding service.
Service discovery
Another widely known pattern for distributed systems. Service discovery allows you to automatically determine network addresses for available application instances, which can be dynamically changed for reasons of scaling, crashes and updates.
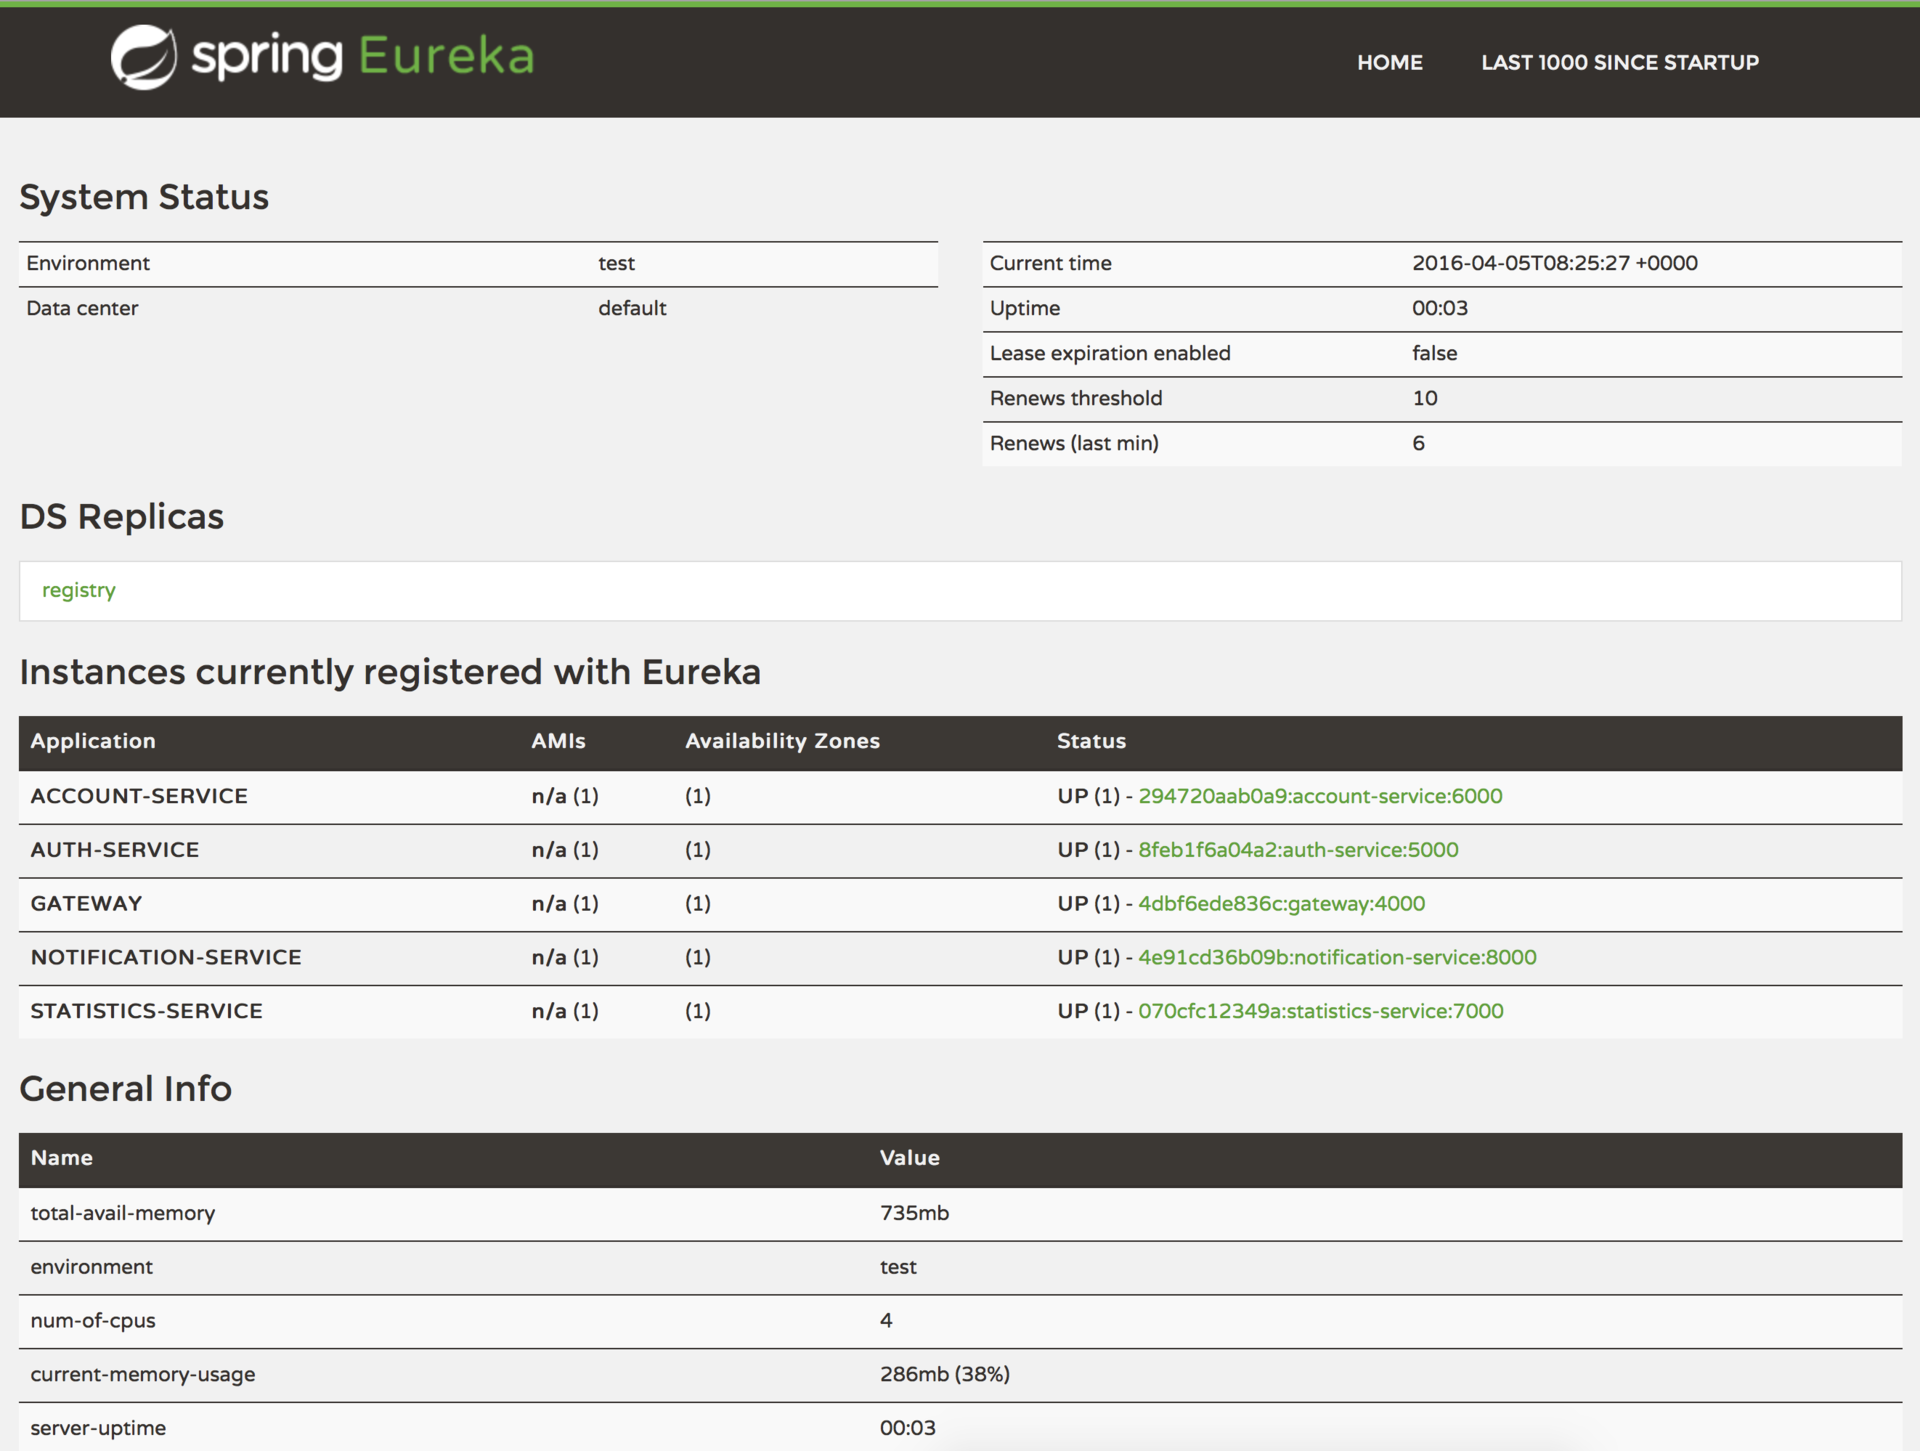
The key link here is the registry service. In this project I use Netflix Eureka (but there is also Consul, Zookeeper, Etcd and others). Eureka is an example of client-side discovery of a pattern, which means the client must request the addresses of the available instances and balance between them independently.
To turn the Spring Boot application into the Registry server, just add a dependency on the spring-cloud-starter-eureka-server and the @EnableEurekaServer annotation. On the client side, the spring-cloud-starter-eureka , the @EnableDiscoveryClient annotation and the application name (serviceId) in bootstrap.yml :
spring: application: name: notification-service Now the application instance will be registered at Eureka at startup, providing meta-data (such as host, port, etc.). Eureka will receive HARTBIT messages, and if they are not present during the configured time, the instance will be deleted from the registry. In addition, Eureka provides dashboards on which registered applications with the number of instances and other technical information are visible: http://localhost:8761
Client balancer, Fuse and Http client
The following set of tools was also developed in Netflix and natively integrated into Spring Cloud. All of them work together and are used in microservices that need to communicate with the outside world or the internal infrastructure.
Ribbon
Ribbon is a client-side balancer. Compared to the traditional one, requests here go directly to the right address, which eliminates the extra node when calling. Out of the box, it is integrated with the Service Discovery mechanism, which provides a dynamic list of available instances for balancing between them.
Hystrix
Hystrix is the implementation of the Circuit Breaker pattern - a fuse that gives control over delays and errors when making calls over the network. The basic idea is to stop the cascade failure in a distributed system consisting of a large number of components. This allows you to give an error as quickly as possible, without delaying the request to the hung service (letting it recover).
In addition to controlling the opening of the circuit, Hystrix allows you to determine the fallback method that will be called when an unsuccessful call. Thus, it is possible to give a default response, an error message, etc.
For each request, Hystrix generates a set of metrics (such as execution speed, result), which allows analyzing the overall state of the system. Below will be considered monitoring based on these metrics.
Feign
Feign is a simple and flexible http client that is natively integrated with Ribbon and Hystrix. Simply put, having a spring-cloud-starter-feign and activating a client with the @EnableFeignClients annotation, you get a complete set of balancer, fuse and client, ready for battle with a reasonable default configuration.
Here is an example from the Account Service:
@FeignClient(name = "statistics-service") public interface StatisticsServiceClient { @RequestMapping(method = RequestMethod.PUT, value = "/statistics/{accountName}", consumes = MediaType.APPLICATION_JSON_UTF8_VALUE) void updateStatistics(@PathVariable("accountName") String accountName, Account account); } - All you need is to declare the interface.
- As usual, we simply specify the name of the service (thanks to the Service Discovery mechanism), but of course you can also refer to an arbitrary url.
@RequestMappingalong with the contents can be left unified for@FeignClientand@Controllerin Spring MVC
Dashboard
The metrics that Hystrix generates can be given out by including the spring-boot-starter-actuator dependency in the classspace. Among other interesting things , a special endpoint - /hystrix.stream will be set. This stream can be visualized using the Hystrix dashboard, which we will discuss in detail below. To enable Hystrix Dashboard, you need the spring-cloud-starter-hystrix-dashboard @EnableHystrixDashboard and the @EnableHystrixDashboard annotation. Hystrix Dashboard can be set on a stream of any microservice to see a lively picture of what is happening in this particular service.
However, in our case there are several services, and it would be great to see all their metrics in one place. For this there is a special solution. Each of our services will push its streams to AMQP broker (RabbitMQ), from where the stream aggregator, Turbine, will convert them, exposing a single endpoint for Hystrix Dashboard.
Consider the behavior of the system under load: The Account service calls Statistics Service, and it responds with a varying simulation delay. The request time threshold is set to 1 second.

 |  |  |  |
|---|---|---|---|
0 | 500 | 800 | 1100 |
| The system works without errors. Capacity about 22 s / s. A small number of active threads in the Statistics service. Average response time - 50 ms | The number of active threads increases. The purple digit shows the number of rejected requests, respectively, of the order of 30-40% of errors, but the chain is still closed. | Half-open state: the percentage of errors is more than 50%, the fuse opens the circuit. After a certain timeout, the circuit closes, but not for long again. | 100% of requests with errors. The circuit is constantly open, attempts to skip the request after a timeout change nothing - each individual request is too slow. |
Log Analysis
In an infrastructure consisting of a large number of moving parts (each of which can have several copies), it is very important to use a system of centralized collection, processing and analysis of logs. Elasticsearch, Logstash and Kibana make up a stack, with which you can effectively solve this problem.
The ELK Docker configuration ready for launch with a Curator and shipper templates is available on the github . It is this configuration, with a little customization and scaling, that works successfully in production on my current project for analyzing logs, network activity and monitoring server performance.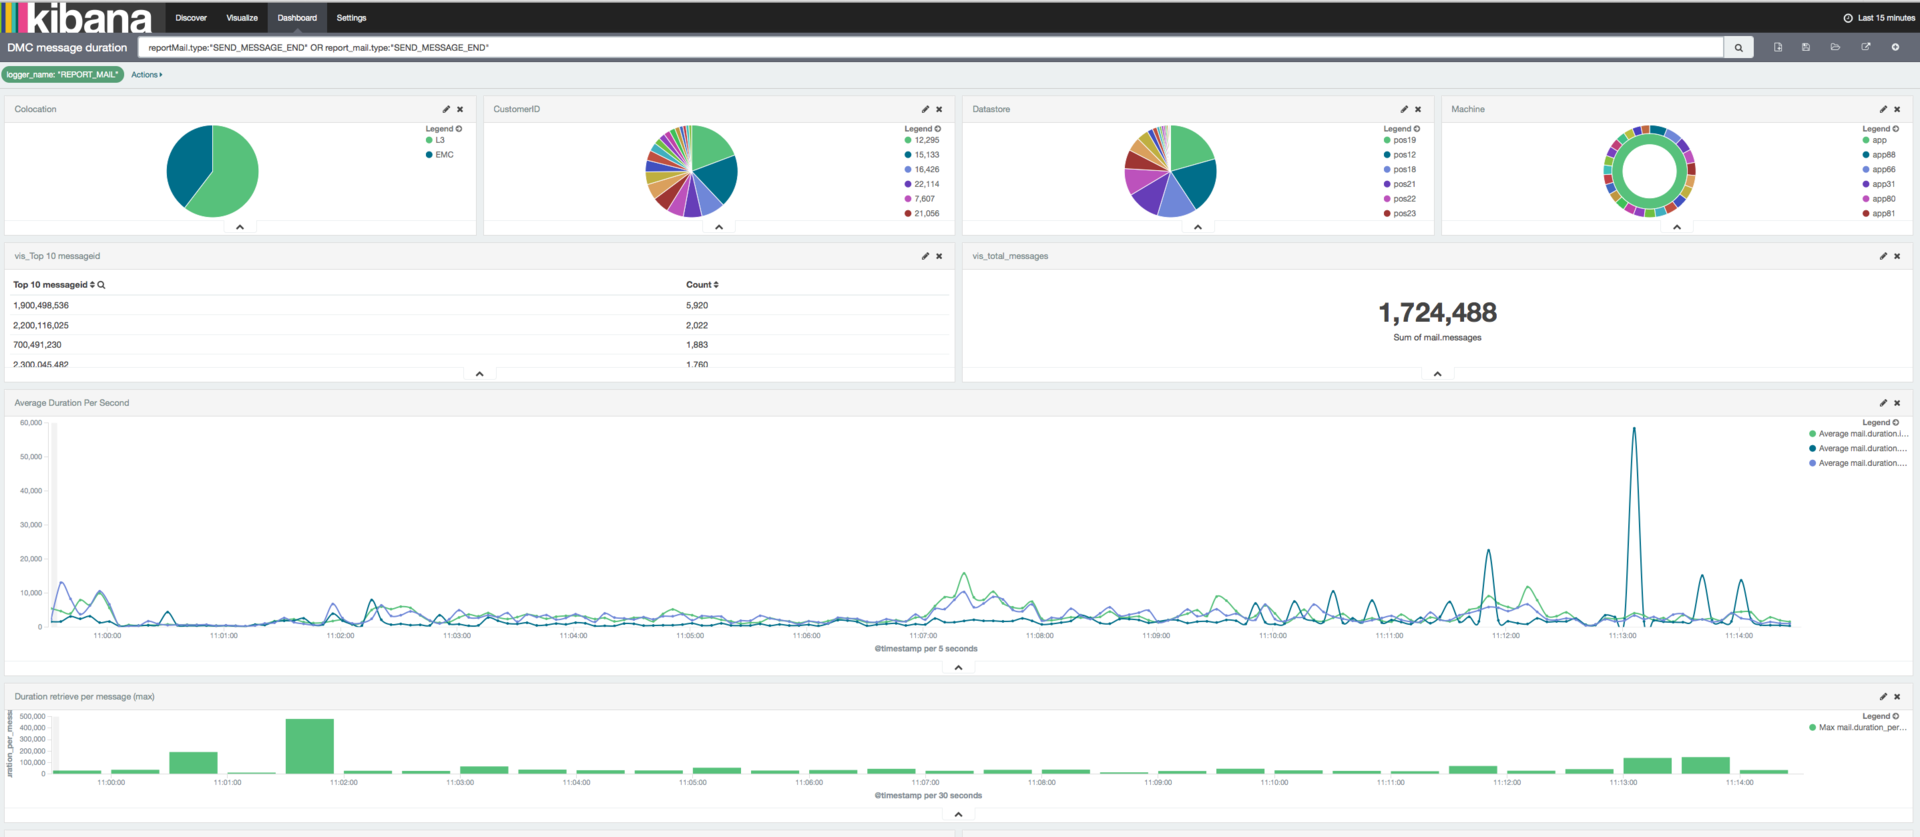
Picture from the official Elastic website, just for example
Infrastructure Automation
Deploying a microservice system with a large number of moving parts and interconnectedness is obviously a more complex task than deploying a monolithic application. Without an automated infrastructure, the whole story will turn into endless pain and waste of time. This is a topic for a completely separate conversation, I will only show the simplest continuous delivery work implemented in this project on free versions of services:
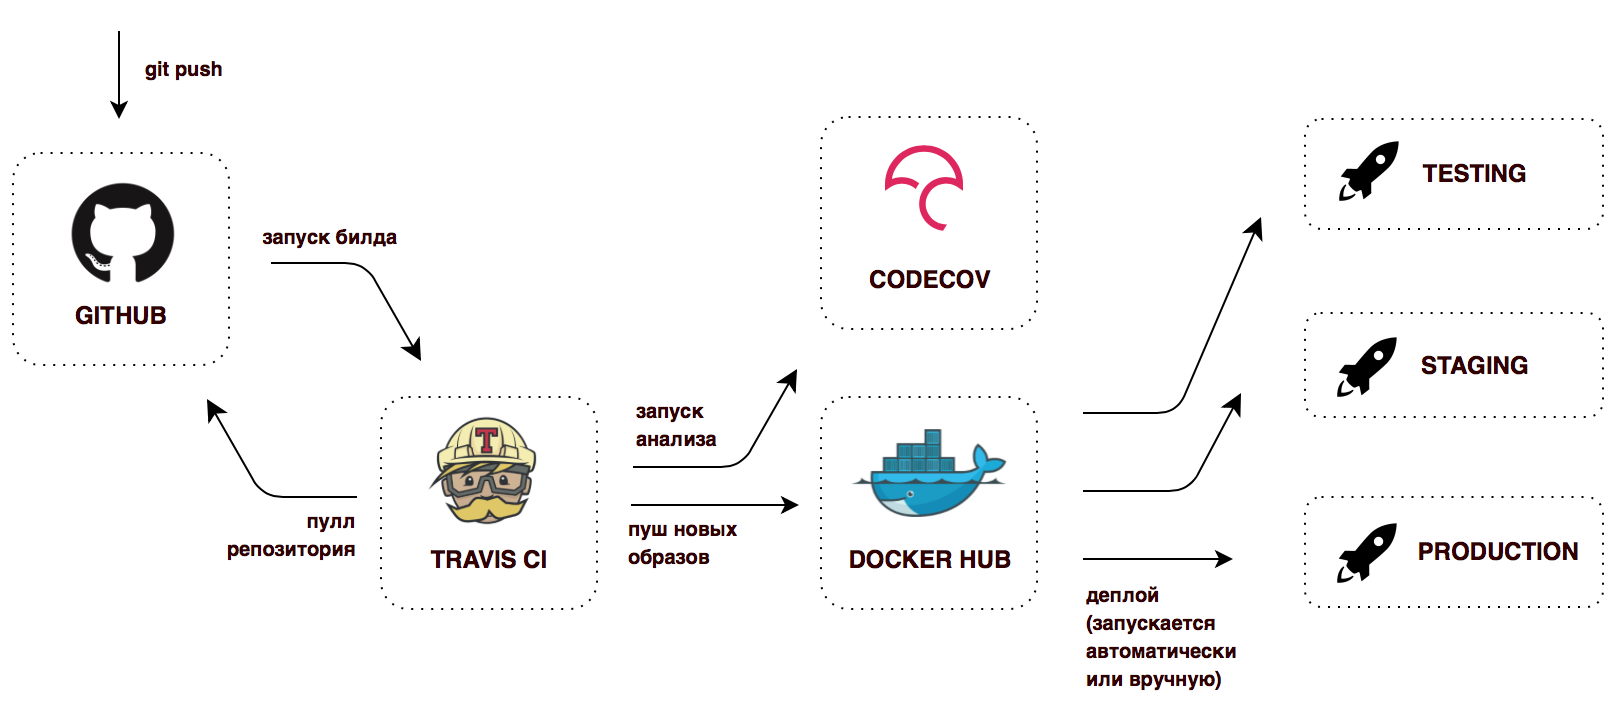
The last stage is figuratively, there is no project for the project.
To the root of the repository there is a .travis.yml file with instructions for the CI server - what to do after a successful build. In this configuration, for every successful push in Github, Travis CI will collect docker images, tag them and launch them in the Docker Hub. Now it turns out that we always have ready-to-deploy containers marked with the latest tag, as well as containers with old versions, versions from any branches.
Launch
If you've read this far, it may be interesting for you to do it yourself. I want to note that the infrastructure consists of 8 Spring Boot applications, 4 MongoDB instances and one RabbitMQ. Make sure that 3-4 GB of memory is available in the system. You can always start to restrict yourself with the most necessary functionality - to abandon the Statistics service, Notification Service and Monitoring.
Before you start
- Install Docker and Docker Compose
- Export environment variables:
CONFIG_SERVICE_PASSWORD,NOTIFICATION_SERVICE_PASSWORD,STATISTICS_SERVICE_PASSWORD,ACCOUNT_SERVICE_PASSWORD,MONGODB_PASSWORD
Production mode
In this mode, all pre-compiled images are downloaded from the central repository (in this case, Docker Hub), ports are forwarded outside the docker only for API Gateway, Service Discovery, Monitoring and RabbitMQ management. All you need is the docker-compose file and the docker-compose up -d .
version: '2' services: rabbitmq: image: rabbitmq:3-management restart: always ports: - 15672:15672 logging: options: max-size: "10m" max-file: "10" config: environment: CONFIG_SERVICE_PASSWORD: $CONFIG_SERVICE_PASSWORD image: sqshq/piggymetrics-config restart: always logging: options: max-size: "10m" max-file: "10" registry: environment: CONFIG_SERVICE_PASSWORD: $CONFIG_SERVICE_PASSWORD image: sqshq/piggymetrics-registry restart: always ports: - 8761:8761 logging: options: max-size: "10m" max-file: "10" gateway: environment: CONFIG_SERVICE_PASSWORD: $CONFIG_SERVICE_PASSWORD image: sqshq/piggymetrics-gateway restart: always ports: - 80:4000 logging: options: max-size: "10m" max-file: "10" auth-service: environment: CONFIG_SERVICE_PASSWORD: $CONFIG_SERVICE_PASSWORD NOTIFICATION_SERVICE_PASSWORD: $NOTIFICATION_SERVICE_PASSWORD STATISTICS_SERVICE_PASSWORD: $STATISTICS_SERVICE_PASSWORD ACCOUNT_SERVICE_PASSWORD: $ACCOUNT_SERVICE_PASSWORD MONGODB_PASSWORD: $MONGODB_PASSWORD image: sqshq/piggymetrics-auth-service restart: always logging: options: max-size: "10m" max-file: "10" auth-mongodb: environment: MONGODB_PASSWORD: $MONGODB_PASSWORD image: sqshq/piggymetrics-mongodb restart: always logging: options: max-size: "10m" max-file: "10" account-service: environment: CONFIG_SERVICE_PASSWORD: $CONFIG_SERVICE_PASSWORD ACCOUNT_SERVICE_PASSWORD: $ACCOUNT_SERVICE_PASSWORD MONGODB_PASSWORD: $MONGODB_PASSWORD image: sqshq/piggymetrics-account-service restart: always logging: options: max-size: "10m" max-file: "10" account-mongodb: environment: INIT_DUMP: account-service-dump.js MONGODB_PASSWORD: $MONGODB_PASSWORD image: sqshq/piggymetrics-mongodb restart: always logging: options: max-size: "10m" max-file: "10" statistics-service: environment: CONFIG_SERVICE_PASSWORD: $CONFIG_SERVICE_PASSWORD MONGODB_PASSWORD: $MONGODB_PASSWORD STATISTICS_SERVICE_PASSWORD: $STATISTICS_SERVICE_PASSWORD image: sqshq/piggymetrics-statistics-service restart: always logging: options: max-size: "10m" max-file: "10" statistics-mongodb: environment: MONGODB_PASSWORD: $MONGODB_PASSWORD image: sqshq/piggymetrics-mongodb restart: always logging: options: max-size: "10m" max-file: "10" notification-service: environment: CONFIG_SERVICE_PASSWORD: $CONFIG_SERVICE_PASSWORD MONGODB_PASSWORD: $MONGODB_PASSWORD NOTIFICATION_SERVICE_PASSWORD: $NOTIFICATION_SERVICE_PASSWORD image: sqshq/piggymetrics-notification-service restart: always logging: options: max-size: "10m" max-file: "10" notification-mongodb: image: sqshq/piggymetrics-mongodb restart: always environment: MONGODB_PASSWORD: $MONGODB_PASSWORD logging: options: max-size: "10m" max-file: "10" monitoring: environment: CONFIG_SERVICE_PASSWORD: $CONFIG_SERVICE_PASSWORD image: sqshq/piggymetrics-monitoring restart: always ports: - 9000:8080 - 8989:8989 logging: options: max-size: "10m" max-file: "10" Development mode
In the development mode it is supposed to build images, and not to take them from the repository. All containers are exposed outside for easy debug. This configuration is inherited from the above, overwriting and extending the indicated points. Run by docker-compose -f docker-compose.yml -f docker-compose.dev.yml up -d
version: '2' services: rabbitmq: ports: - 5672:5672 config: build: config ports: - 8888:8888 registry: build: registry gateway: build: gateway auth-service: build: auth-service ports: - 5000:5000 auth-mongodb: build: mongodb ports: - 25000:27017 account-service: build: account-service ports: - 6000:6000 account-mongodb: build: mongodb ports: - 26000:27017 statistics-service: build: statistics-service ports: - 7000:7000 statistics-mongodb: build: mongodb ports: - 27000:27017 notification-service: build: notification-service ports: - 8000:8000 notification-mongodb: build: mongodb ports: - 28000:27017 monitoring: build: monitoring Notes
All Spring Boot applications in this project need an available Config Server to start. Thanks to the fail-fast option in the bootstrap.yml each application and the restart option: always in the docker, the containers can be started simultaneously (they will automatically continue their attempts to start until the Config Server rises).
The Service Discovery mechanism also takes some time to start full-fledged work. The service is not available for a call, as long as he himself, Eureka and the client do not have the same meta-information locally - this requires 3 heartbeats. By default, the time interval between Hartbits is 30 seconds.
Related Links
- Articles on Martin Fowler microservices
- Sam Neuman Building Microservices - a book covering in detail all the basic concepts of microservice architecture
- A whole brochure describing the differences between Microservices and SOA
- A series of articles on microservices on the NGINX blog by Chris Richardson, founder of CloudFoundry
- Very cool and detailed report by Kirill Tolkachev tolkkv and Alexander Tarasov aatarasoff from the Alpha Laboratory, in two parts . On microservices, Spring Boot, Spring Cloud, tools Netflix OSS, Apache Thrift and much more.
Source: https://habr.com/ru/post/280786/
All Articles