NFS traffic visualization using elasticsearch + kibana
On duty, I often have to analyze NFS traffic. Wireshark is my main tool and for it I even created an extension to lua. But something was missing. And two weeks ago, I came across a new Packetbeat tool for me. Unfortunately, paketbeat
Packetbeat
')
Paketbeat is one of the beats tools from the creators of elasticsearch, logstash and kibana. This is the sender (shipper) of data in elasticsearch, which listens to network traffic, converts it into json records and sends it to elasticsearch. If you use Kibana4, then there are standard panels for visualizing the collected traffic. At the moment, packetbeat recognizes TCP, UDP, DNS, ICMP, HTTP, memcache, MongoDB, redis, PostgreSQL, MySQL, thrift and, now, NFS. Somewhere inside, packetbeat uses libpcap.
How to add your protocol
Packetbeat is written in go. The code is on the githab and contains a file with instructions how to add a new protocol. What is missing is the 'desired' format of the json object being created.
Handling NFS traffic
Processing of NFS (as well as probably all the rest) traffic occurs as follows:
- we collect tcp packets until the message is completely received
- parse rpc header
- if this is a request, create a new record and put it in a special cache.
the key in the cache is used xid (rpc transaction identifier) - if this is the answer, we take the corresponding entry from the cache, we add
information from the response, add the time it took the server
to process the request and sends an entry to elasticsearch.
The created entry looks like this:
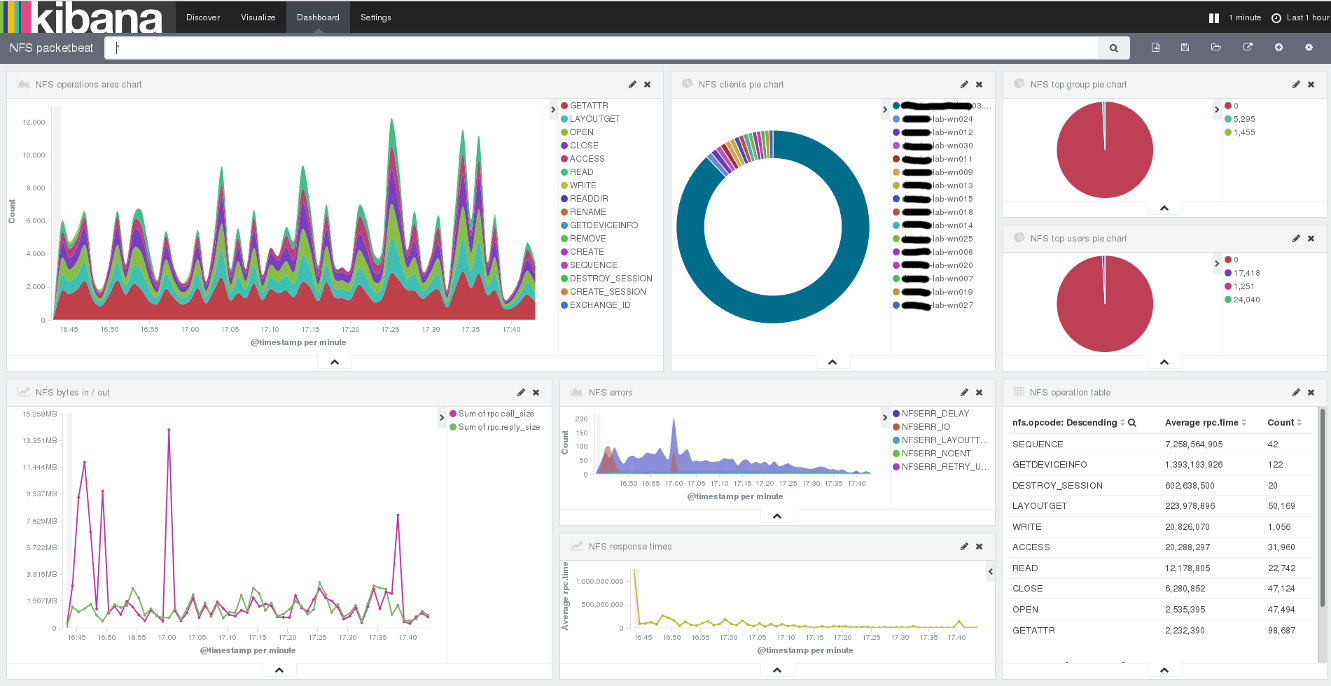
{ "@timestamp": "2016-03-28T06:18:18.431Z", "beat": { "hostname": "localhost", "name": "localhost" }, "count": 1, "dst": "127.0.0.1", "dst_port": 2049, "nfs": { "minor_version": 1, "opcode": "GETATTR", "status": "NFSERR_NOENT", "tag": "", "version": 4 }, "rpc": { "auth_flavor": "unix", "call_size": 200, "cred": { "gid": 500, "gids": [ 491, 499, 500 ], "machinename": "localhost", "stamp": 4597002, "uid": 500 }, "reply_size": 96, "status": "success", "time": 25631000, "time_str": "25.631ms", "xid": "2cf0c876" }, "src": "127.0.0.1", "src_port": 975, "type": "nfs" } Having this data you can get the following information:
- number of different requests
- number and type of errors
- Top N customers
- top n users and groups
- server response time
(your options)
Traffic listening
The easiest option would be to run a packetbeat on an NFS server. If this feature is not available, then you can use port mirroring on the switch. Details about this can be found here .
Packetbeat has a configuration file where we need to say what it should do:
interfaces: device: any protocols: nfs: ports: [2049] logging: level: info output: elasticsearch: hosts: ["elasticsearch.node.name:9200"] Specified configuration file with the key '-c'.
Instead of conclusion
I hope to finish reading this place, you have learned something new.
Source: https://habr.com/ru/post/280756/
All Articles