Collection and analysis of the logs of demons in Badoo
Introduction
In Badoo, a few dozen "samopisnyh" demons. Most of them are written in C, left alone in C ++ and five or six in Go. They work on about a hundred servers in four data centers.
In Badoo, health checks and detection of problems with demons are on the shoulders of the monitoring department. Colleagues using Zabbix and scripts check if the service is running, if it responds to requests, and also keep track of versions. In addition, the department analyzes the statistics of demons and scripts working with them for anomalies, sharp jumps, etc.
')
However, until recently we didn’t have a very important part - collecting and analyzing logs that each daemon writes locally to files on the server. Often, it is this information that helps to catch the problem at a very early stage or after the fact to understand the reasons for the refusal.
We built such a system and we hasten to share the details. Surely some of you will have a similar task, and reading this article will save you from the mistakes that we managed to make.
Selection of tools
From the very beginning we shored cloud systems, because in Badoo, it is customary not to give your data to the outside, if possible. After analyzing the popular tools, we came to the conclusion that, most likely, one of the three systems will suit us:
Splunk
First of all, we tried Splunk. Splunk is a turnkey system, a closed and paid solution, the cost of which directly depends on the traffic coming into the system. We already use it for data in the billing department. Colleagues are very satisfied.
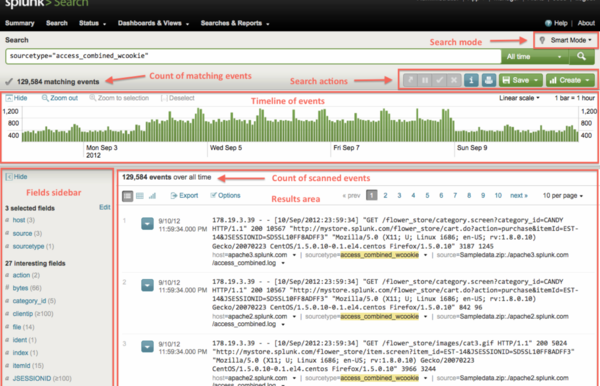
We took advantage of their installation for tests and almost immediately faced with the fact that our traffic exceeded the existing and paid limits.
Another nuance was that during testing, some employees complained about the complexity and "unintuitiveness" of the user interface. Colleagues from the billing for this time already got the hand in communicating with Splunk and they had no problems, but still this fact is worth noting, because A pleasant interface will be of great importance if we want our system to be actively used.
On the technical part of Splunk, apparently, we are completely satisfied. But its cost, closeness and inconvenient interface made us look further.
ELK: Elastic Search + Logstash + Kibana
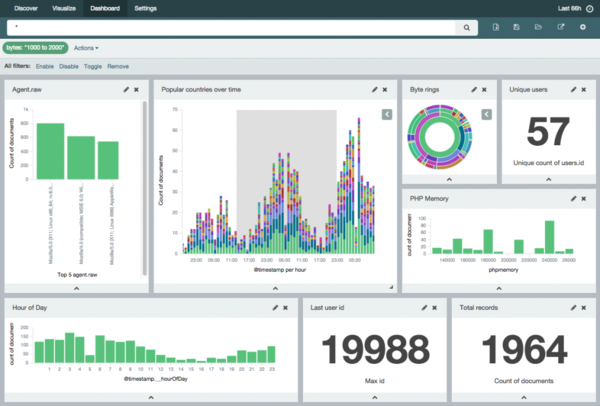
ELK was next on the list. ELK is probably the most popular to date system for collecting and analyzing logs. And I want to say that this is not surprising, since It is free, simple, flexible and powerful.
ELK consists of three components:
- Elastic Search. Data storage and retrieval system based on the Lucene “engine”;
- Logstash. "Pipe" with a bunch of features through which data (possibly processed) get into Elastic Search;
- Kibana. Web interface for searching and visualizing data from Elastic Search.
Getting started with ELK is very simple: just download three archives from the official website, unzip and run several binaries. This simplicity allowed in a few days to test the system and understand how it suits us.
And in general, she came up. Technically, we could implement everything we needed, if necessary, write our own solutions and integrate them into the overall infrastructure.
Despite the fact that ELK completely suited us, there was a third applicant.
Graylog 2
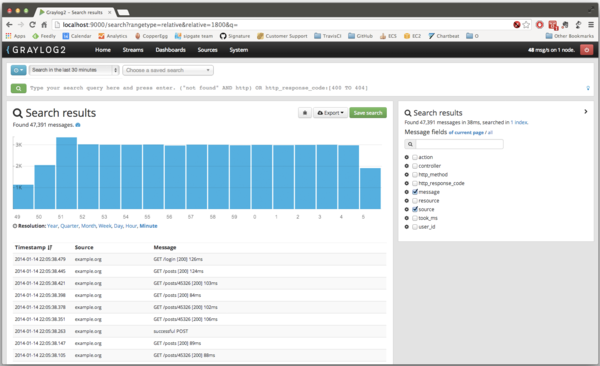
In general, Graylog 2 is very similar to ELK: open source, easy to install, Elastic Search is also used and Logstash can be used. The main difference is that Graylog 2 is a ready-to-use and “sharpened” system specifically for collecting logs. With its readiness for the end user, it is very similar to Splunk. There is a user-friendly graphical interface with the ability to customize line parsing directly in the browser, and access restriction, and notifications.
But we came to the conclusion that ELK will allow us to make a much more flexible system, customized for our needs; will allow to expand, change components. As a designer. Did not like one part - replaced by another. Did not want to pay for the watcher - made their system. If in ELK all parts can be easily removed and replaced, in Graylog 2 there was a feeling that some parts would have to be torn out by the root, and some simply could not be implemented.
Solved. We will do on ELK.
Log shipping
At the earliest stage, we made a mandatory requirement that the logs should get into our collector and remain on the disk. The system of collecting and analyzing logs is good, but any system gives some delay, can fail and nothing replaces the features that standard unix utilities like grep, AWK, sort, etc. give. The programmer should have the opportunity to go to the server and see with their own eyes what is happening there.
We could deliver logs to Logstash as follows:
- use the available utilities from the ELK kit (logstash-forwarder, and now beats). They are a separate daemon that monitors the file on disk and uploads it to Logstash;
- use your own development under the name LSD, which we deliver PHP logs. In fact, it is also a separate daemon that monitors files with logs in the file system and floods them somewhere. On the one hand, LSD took into account and solved all the problems that can occur when uploading a huge amount of logs from a huge number of servers, but the system is too "sharpened" to PHP scripts. We would have to finish it;
- in parallel with writing to disk, write logs to the standard for UNIX syslog world.
Despite the shortcomings of the latter, this approach was very simple, and we decided to try it.
Architecture
Servers and rsyslogd
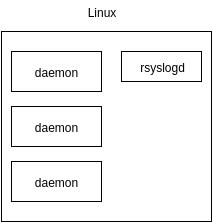
Together with the system administrators, we sketched the architecture that seemed reasonable to us: we put one rsyslogd daemon on each server, one main rsyslogd daemon per platform, one Logstash per platform and one Elastic Search cluster closer to us, to Moscow, ie . in Prague data center.
In the pictures one of the servers looked like this:
Since in Badoo, docker is used here and there, then we planned to push the / dev / log socket inside the container with built-in tools.
The final scheme was something like this:
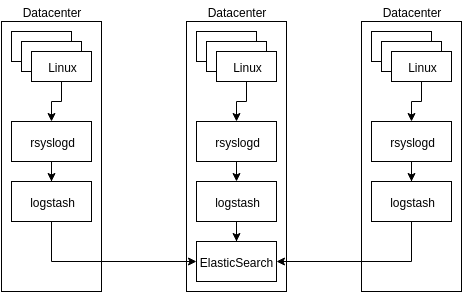
The scheme invented above looked quite resistant to data loss to begin with: each of the rsyslogd daemons, if it is impossible to transmit messages further, will save them to disk and send them when it “goes on” to work.
The only data loss was possible if the very first rsyslog daemon did not work. But at that moment we did not pay too much attention to this problem. Still, logs are not so important information to spend a lot of time on it from the very beginning.
Log line format and Logstash

Logstash is a pipe for data to which lines are sent. Inside they parse and go to Elastic Search in the form of ready-to-index fields and tags.
Almost all of our services are built using our own library, libangel, which means that their log format is the same and looks like this:
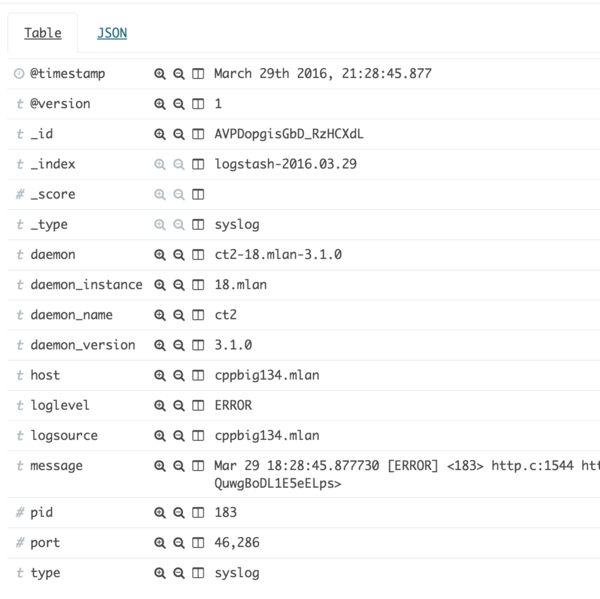
Mar 04 04:00:14.609331 [NOTICE] <shard6> <16367> storage_file.c:1212 storage___update_dump_data(): starting dump (threaded, update) The format consists of a common part, which is unchanged, and a part that the programmer sets himself when calling one of the functions for logging.
In the general part, we see the date, time with microseconds, log level, label, PID, file name and line number in source, function name. The most ordinary things.
Syslog adds information from itself to this message: time, PID, server hostname, and so-called ident. Usually, this is just the name of the program, but anything can be transferred there.
We have standardized this ident and transfer the name, secondary name and version of the daemon there. For example, meetmaker-ru.mlan-1.0.0 . Thus, we can distinguish logs from different demons, from different types of one demon (for example, country, replica) and have information about the running version of the daemon.
Analysis of such a message is quite straightforward. I will not cite the pieces from the configuration file in the article, but it all comes down to gradual biting and parsing of parts of the line using regular regular expressions.
If some stage of parsing was unsuccessful, we add a special tag to the message, which further allows you to find such messages and monitor their number.
I will mention about the analysis of time. We have tried to take into account various options, and the default message time will be the time from the libangel message, i.e. essentially the time when this message was generated. If for some reason this time was not found, we will take the time from the syslog, i.e. the time when the message went to the first local syslog daemon. If for some reason this time is also unavailable, the message time will be the time that this message was received in Logstash.
The resulting fields go to Elastic Search for indexing.
Elasticsearch
Elastic Search supports clustering mode when several nodes are combined into one network and work together. Due to the fact that it is possible for each of the indexes to configure replication to another node, the cluster remains operable in case of failure of some nodes.
The minimum number of nodes in a failover cluster is three, the first odd number that is greater than one. This is due to the fact that for the internal algorithms to work, it is necessary that when the cluster is divided into parts, it is possible to select the majority. An even number of nodes is not suitable for this.
We allocated three servers for the Elastic Search cluster and set it up so that each index had one replica, as in the diagram.
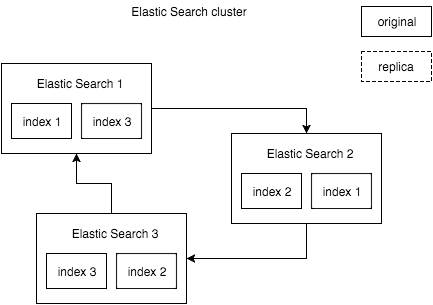
In this architecture, the failure of any of the cluster nodes is not fatal and does not lead to the inaccessibility of the cluster.
In addition to the fault tolerance itself, with such a scheme it is convenient to do an update of the Elastic Search itself: we stop one of the nodes, update it, start it, update the other one.
The fact that we store logs in Elastic Search allows us to easily divide all data into indices by day. This partitioning has several advantages:
- if the servers run out of disk space, it is very easy to delete old data. This is a quick operation, and moreover, there is a ready-made Curator tool for deleting old data;
- during the search in the interval of more than one day, the search can be conducted in parallel. Moreover, it can be conducted in parallel on one server or on several.
As already mentioned, we set up Curator to automatically remove old indexes when there is not enough disk space.
In setting up Elastic Search, there are many subtleties associated with both Java and simply the fact that Lucene is used internally. But all these subtleties are described both in official documentation and in numerous articles, so I will not go deep. I’ll only briefly mention that on the Elastic Search server you need to remember to allocate memory both for Java Heap and outside Heap (it will be used by Lucene), as well as to prescribe “mappings” specifically for your fields in indexes in order to speed up work and reduce space consumption on disk.
Kibana
There’s nothing to talk about at all :-) They set up and work. Fortunately, in the latest version, developers have added the ability to change the time zone in the settings. Previously, the local time zone of the user was taken as default, which is very inconvenient, since we have on servers everywhere and always UTC, and we are used to communicate on it.
Notification system
A very important part of the logging system and one of the main requirements was the availability of a notification system. A system that, on the basis of rules or filters, would send out letters notifying on the rule triggering with a link to a page where you can see the details.
There are two similar finished products in the ELK world:
- Watcher from the company Elastic;
- Elastalert from Yelp .
Watcher is a closed product from Elastic that requires an active subscription. Elastalert is an open source product written in Python. Watcher we shallow almost immediately for the same reason as before - the closeness and complexity of expansion and adaptation for us. Elastalert also showed itself to be a great product, but there were several drawbacks in it (though not very critical):
- It is written in Python. We love Python as a language for writing fast “knee-length” scripts, but we don’t really want to see it as a final product in production;
- The ability to build letters that the system sends in response to an event is completely rudimentary. And the beauty and convenience of writing is very important if we want others to have a desire to use the system.
Having played with Elastalert and having studied its source code, we decided to write a product in PHP by the platform department. As a result, Denis Karasik Battlecat in 2 weeks wrote a product “sharpened” for us: it is integrated into the backoffice and has only the necessary functionality.
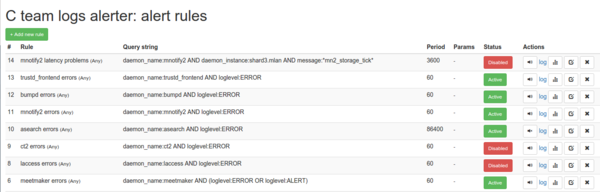
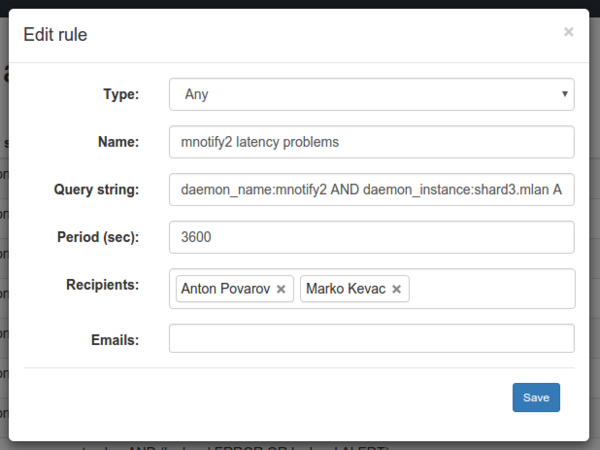
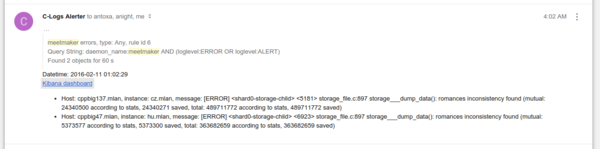
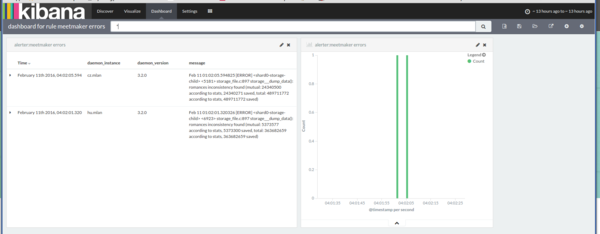
For each rule, the system automatically creates a basic dashboard in Kibana, the link to which will be in the letter. When you click on the link, you will see messages and a schedule for exactly the time period specified in the notification.
"Rake"
At this stage, the first release of the system was ready, worked and could be used. But, as we promised, the “rake” was not long in coming.
Problem 1 (syslog + docker)
The standard way to communicate between the syslog daemon and the program is unix socket / dev / log. As mentioned above, we forwarded it inside the container using standard docker tools . This bundle worked fine until we needed to reboot the syslog daemon.
Apparently, if a specific file is transferred, and not a directory, then when a file is deleted or re-created on the host system, it will no longer be available inside the container. It turns out that any reboot of the syslog daemon leads to the termination of filling the logs from the docker containers.
If you flip the entire directory, there can be a unix-socket inside without problems, and restarting the daemon will not break anything. But then the configuration of all this wealth becomes complicated, as libc expects the socket to be in / dev / log.
The second option we considered was to use UDP or TCP to send logs to the outside. But here is the same problem as in the previous case: libc can only write in / dev / log. We would have to write our syslog client, but at this stage we did not want to do this.
In the end, we decided to start one syslog daemon in each container and continue writing to / dev / log with standard libc functions openlog () / syslog ().
This was not a big problem, because our system administrators still use the init system in each container, and do not start only one daemon.
Problem 2 (blocking syslog)
On the devel cluster, we noticed that one of the daemons periodically freezes. Turning on the internal watchdog daemon, we got a few backtrace, which showed that the daemon hangs in syslog () -> write ().
==== WATCHDOG ==== tag: IPC_SNAPSHOT_SYNC_STATE start: 3991952 sec 50629335 nsec now: 3991953 sec 50661797 nsec Backtrace: /lib64/libc.so.6(__send+0x79)[0x7f3163516069] /lib64/libc.so.6(__vsyslog_chk+0x3ba)[0x7f3163510b8a] /lib64/libc.so.6(syslog+0x8f)[0x7f3163510d8f] /local/meetmaker/bin/meetmaker-3.1.0_2782 | shard1: running(zlog1+0x225)[0x519bc5] /local/meetmaker/bin/meetmaker-3.1.0_2782 | shard1: running[0x47bf7f] /local/meetmaker/bin/meetmaker-3.1.0_2782 | shard1: running(storage_save_sync_done+0x68)[0x47dce8] /local/meetmaker/bin/meetmaker-3.1.0_2782 | shard1: running(ipc_game_loop+0x7f9)[0x4ee159] /local/meetmaker/bin/meetmaker-3.1.0_2782 | shard1: running(game+0x25b)[0x4efeab] /local/meetmaker/bin/meetmaker-3.1.0_2782 | shard1: running(service_late_init+0x193)[0x48f8f3] /local/meetmaker/bin/meetmaker-3.1.0_2782 | shard1: running(main+0x40a)[0x4743ea] /lib64/libc.so.6(__libc_start_main+0xf5)[0x7f3163451b05] /local/meetmaker/bin/meetmaker-3.1.0_2782 | shard1: running[0x4751e1] ==== WATCHDOG ==== Quickly downloading the libc sources and looking at the syslog client implementation, we realized that the syslog () function is synchronous and any delays on the rsyslog side will affect demons.
Something with this had to be done, and the sooner the better. But we did not have time ...
After a couple of days, we stepped on the most unpleasant rake of modern architectures - cascading failure.

Rsyslog is configured by default so that if the internal queue for some reason is filled, it begins to "throttle" (eng. Throttle), i.e. slow down the "record in yourself" new messages.
It turned out that due to a programmer's oversight, one of the test servers began to send a huge number of messages to the log. Logstash did not cope with such a stream, the main rsyslog queue overflowed and he very slowly read messages from other rsyslog. Because of this, the queues of other rsyslog also overflowed and they very slowly read messages from demons.
And the demons, as I said above, write to / dev / log synchronously and without any timeout.
The result is predictable: because of one flooding test daemon, all the demons that write to the syslog with at least some significant frequency began to slow down.
Another mistake was that we did not tell the system administrators about a potential problem, and it took more than an hour to figure out the reason and disable rsyslog.
Not we alone attacked this rake, it turns out. And not even with rsyslog . Synchronous calls in the demon's event loop are a luxury that is not allowed.
Before us were several options:
- walk away from syslog. Go back to one of the other options that suggest that the demon is writing to disk, and already some other demon is completely independent reading from disk;
- continue to write to syslog synchronously, but in a separate thread;
- write your syslog client and send data to the syslog via UDP.
The best option, perhaps, is the first. But we did not want to waste time on it and quickly did the third, i.e. started writing syslog over UDP.
As for Logstash, all the problems were solved by two launch parameters: an increase in the number of handlers and the number of simultaneously processed rows ( -w 24 -b 1250 ).
Future plans
In the near future we plan to make a dashboard for our demons. Such a dashboard, which will combine the existing and some new features:
- viewing the daemon operability (“traffic light”), its basic statistics;
- graphs of the number of lines ERROR and WARNING in the logs, their viewing;
- failed alert system rules;
- SLA monitoring (monitoring latency responses) with the display of problematic services or requests;
- extraction from the logs of the demon of various stages. For example, a note about at what stage of loading it is located, the loading time, the duration of some periodic processes, etc.
The presence of such a dashboard, in my opinion, will appeal to managers, programmers, administrators, and programmers.
Conclusion
We have built a simple system that collects the logs of all our demons, allows them to conveniently search for, build graphs and visualizations, notify us of problems by mail.
The success of the system is evidenced by the fact that during its existence, we promptly discovered those problems that we would never have discovered or found after a long time, as well as the fact that other teams are beginning to use the infrastructure.
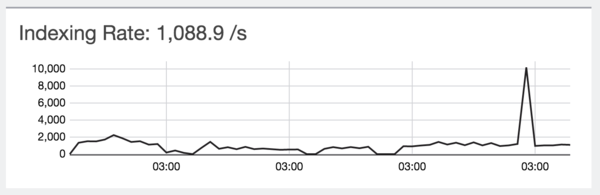
If we talk about the load, then at the moment during the day comes from 600 to 2000 lines with logs per second, with periodic bursts of up to 10 thousand lines. The system digests this load without any problems.
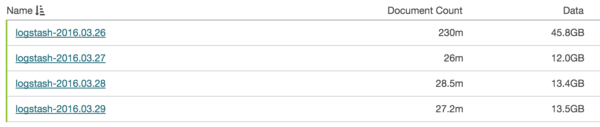
The size of the daily index varies from ten to hundreds of gigabytes.
Some might say that there are flaws in this system and that some “rakes” could be circumvented by doing something different. It's true. But we program not for the sake of programming. Our goal was achieved in a reasonably minimal time and the system is so flexible that the parts that do not distract us in the future can be improved or changed quite easily.
Marco Kevac, programmer in the C / C ++ development department
Source: https://habr.com/ru/post/280606/
All Articles