More than 60 tools for monitoring Windows
In the previous article, a list of 80 tools for monitoring the Linux system was compiled. It also made sense to make a selection of tools for the Windows system. Below is a list that is just a starting point, there is no rating.

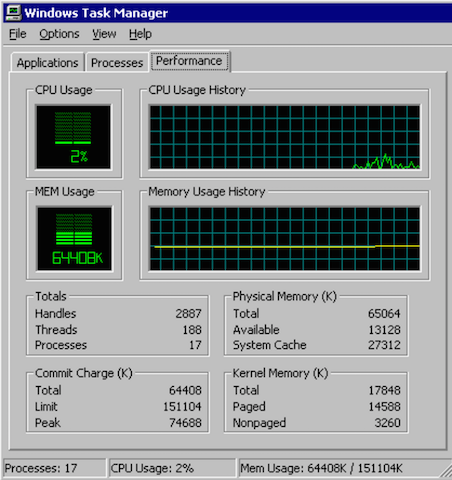
1. Task Manager
')
The well-known Windows Task Manager is a utility for displaying a list of running processes and the resources they consume. But do you know how to use its full potential? As a rule, with its help control the state of the processor and memory, but you can also go much further. This application is tentatively on all Microsoft operating systems.
Task manager
2. Resource Monitor
A great tool to evaluate CPU, RAM, network, and disk usage in Windows. It allows you to quickly get all the necessary information about the status of critical servers.
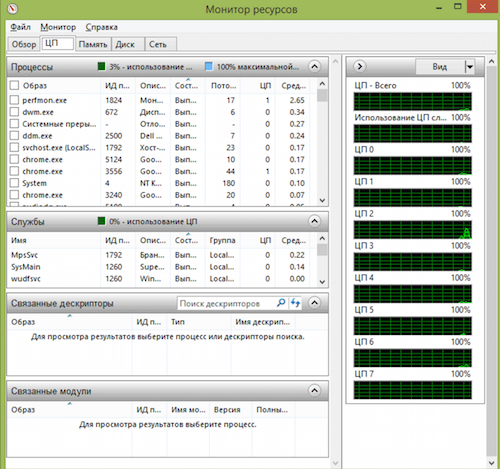
Resource Monitor
3. Performance Monitor
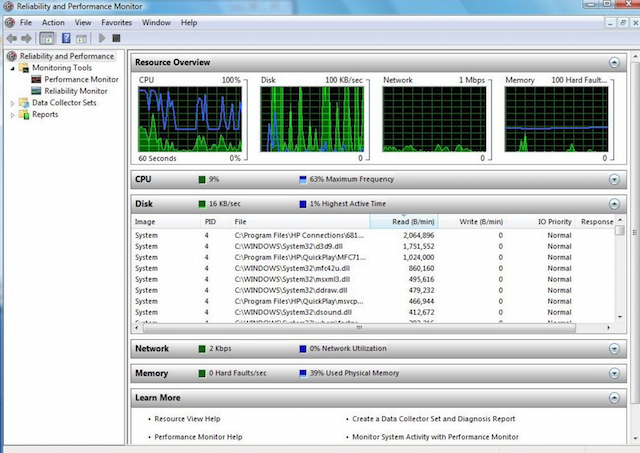
The main tool for managing performance counters in Windows. Performance Monitor, in earlier versions of Windows, is known to us as System Monitor. The utility has several display modes, displays the performance counters in real time, saves data in log files for further study.
Performance monitor
4.Reliability Monitor
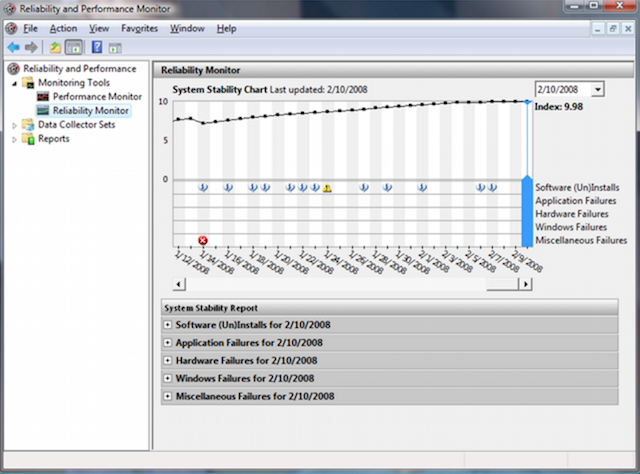
Reliability Monitor - System stability monitor, allows you to monitor any changes in computer performance, you can find a stability monitor in Windows 7, in Windows 8: Control Panel> System and Security> Action Center. Using Reliability Monitor, you can keep track of changes and failures on your computer, the data will be displayed in a convenient graphical form that will allow you to track which application and when it caused an error or freeze, track the appearance of the blue screen of Windows death, the reason for its appearance (another Windows update or program installation).
Reliability Monitor
5. Microsoft SysInternals
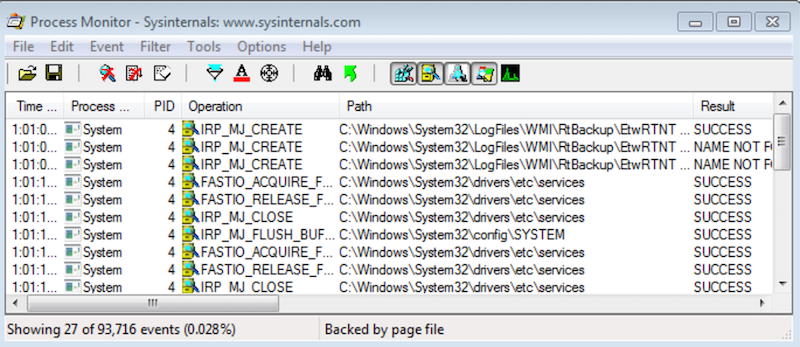
SysInternals is a complete set of programs for administering and monitoring computers running Windows. You can download them for free on the Microsoft website. Sysinternals service programs help manage, troubleshoot, troubleshoot, and diagnose Windows applications and operating systems.
SysInternals
6. SCOM (part of Microsoft System Center)
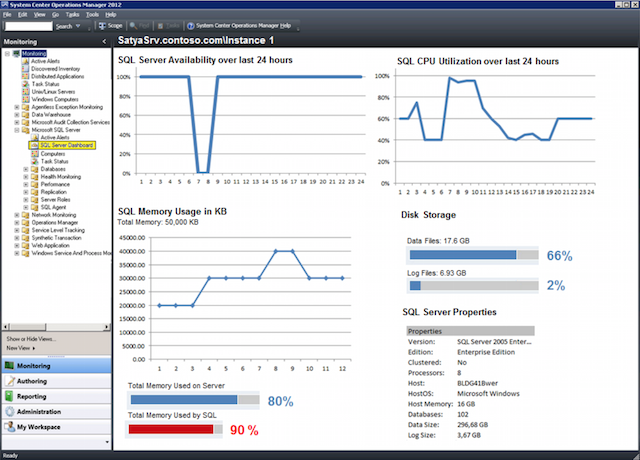
System Center - is a complete set of tools for managing IT-infrastructure, with which you can manage, deploy, monitor, tune Microsoft software (Windows, IIS, SQLServer, Exchange, and so on). Alas, MSC is not free. SCOM is used for proactive monitoring of key IT facilities.
Scom
7. Nagios
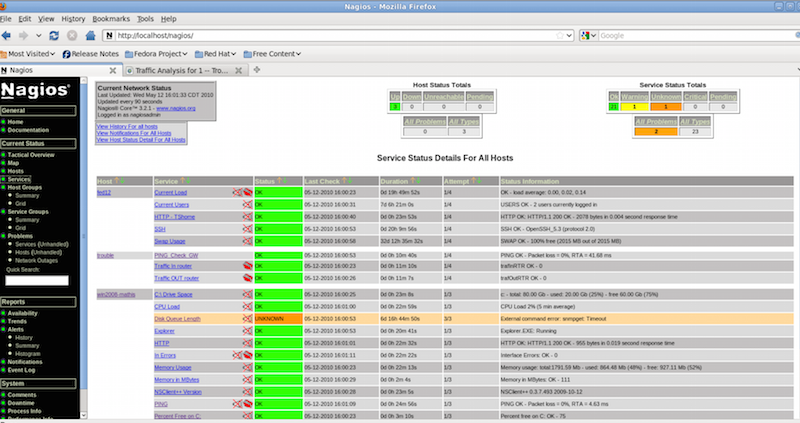
Nagios is the most popular infrastructure monitoring tool for several years (for Linux and Windows). If you are viewing Nagios for Windows, then install and configure the NSClient ++ agent on the Windows server. NSClient ++ monitors the system in real time and provides outputs from a remote monitoring server and not only.
Nagios
8. Cacti
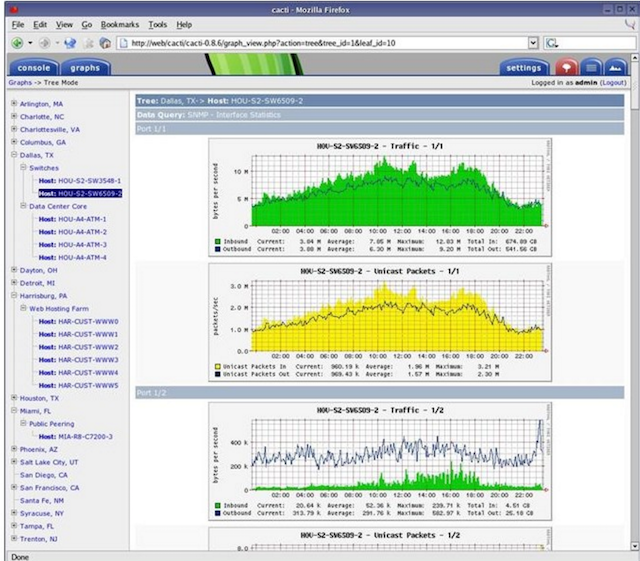
Usually used in conjunction with Nagios, it provides the user with a convenient web interface to the RRDTool utility designed for working with circular databases (Round Robin Database), which are used to store information about changes in one or several quantities over a certain period of time. Statistics in network devices, presented in the form of a tree, the structure of which is set by the user, you can build a graph of the use of the channel, the use of HDD partitions, display the latency of resources, etc.
Cacti
9. Shinken
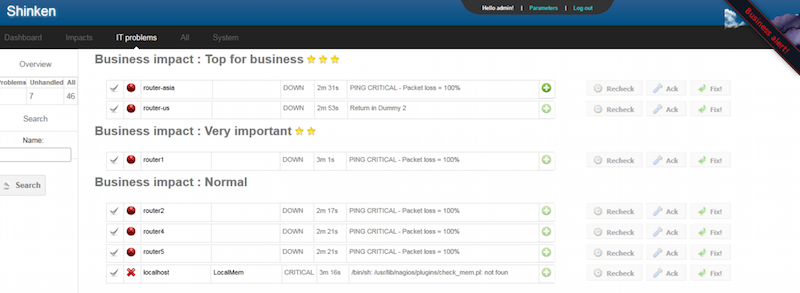
A flexible, scalable, open source monitoring system based on the Nagios kernel written in Python. She is 5 times faster than Nagios. Shinken is compatible with Nagios, it is possible to use its plug-ins and configurations without making adjustments or additional settings.
Shinken
10. Icinga
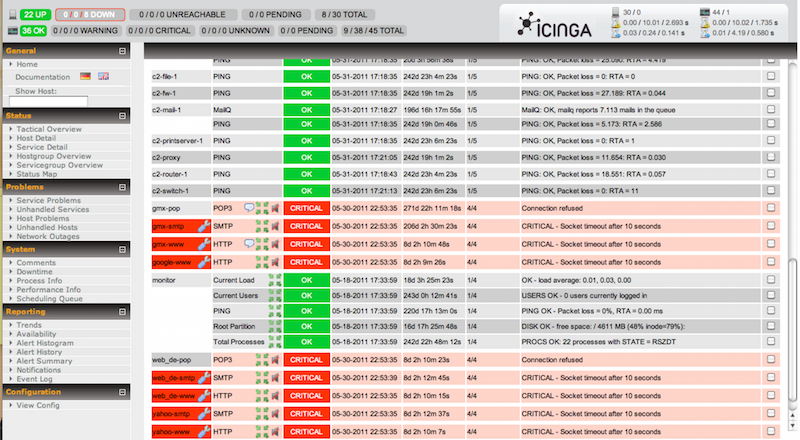
Another popular open source monitoring system that checks hosts and services and informs the administrator about their status. Being a branch of Nagios, Icinga is compatible with it and they have a lot in common.
11. OpsView

OpsView was originally free. Now, alas, users of this monitoring system have to fork out.
Opsview
12. Op5
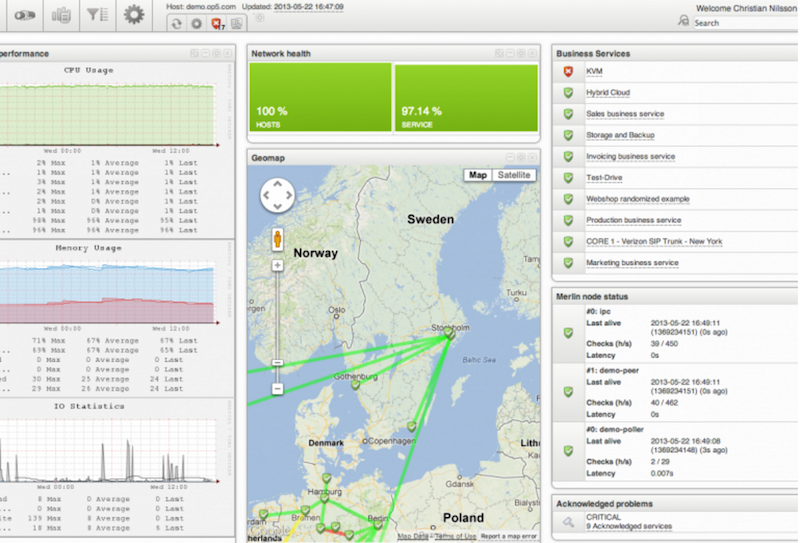
Op5 is another open source monitoring system. Plotting, storage and data collection.
Op5
13. Zabbix
Open source software for monitoring and tracking the status of various computer network services, servers and network equipment, is used to obtain data on processor load, network utilization, disk space, and the like.
Zabbix
14. Munin
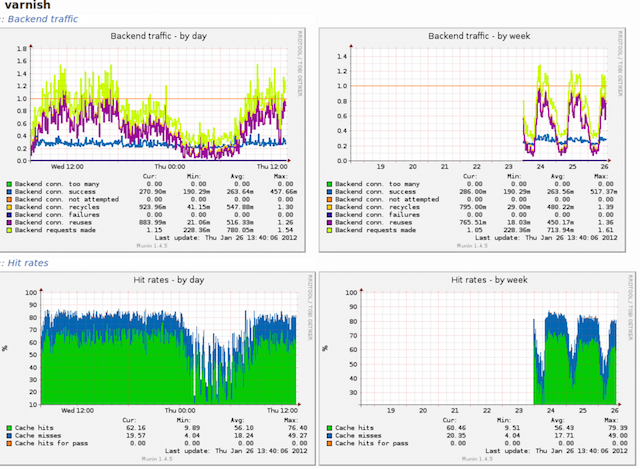
A good monitoring system that collects data from several servers at the same time and displays everything in the form of graphs with which you can monitor all past events on the server.
Munin
15. Zenoss
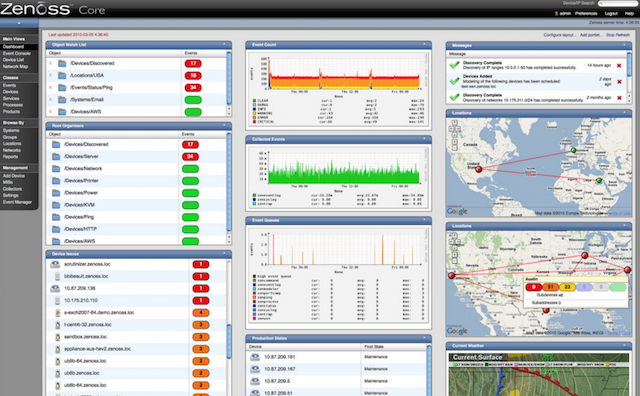
Written in Python using the Zope application server, data is stored in MySQL. With Zenoss you can
monitor network services, system resources, device performance, Zenoss core analyzes the environment. This makes it possible to quickly deal with a large number of specific devices.
Zenoss
16. Observium
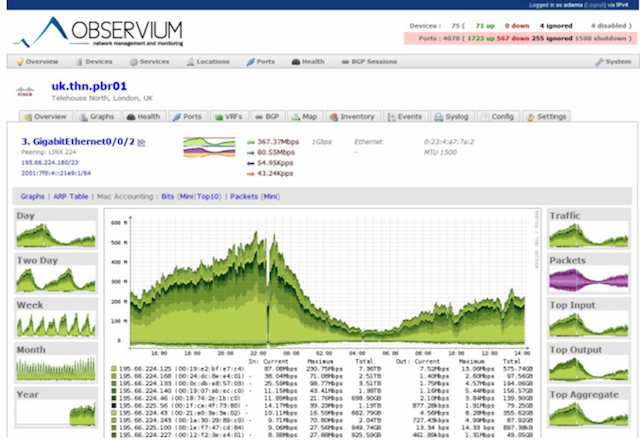
The system of monitoring and monitoring of network devices and servers, although the list of supported devices is huge and is not limited to only network devices, the device must support the operation of SNMP.
Observium
17. Centreon
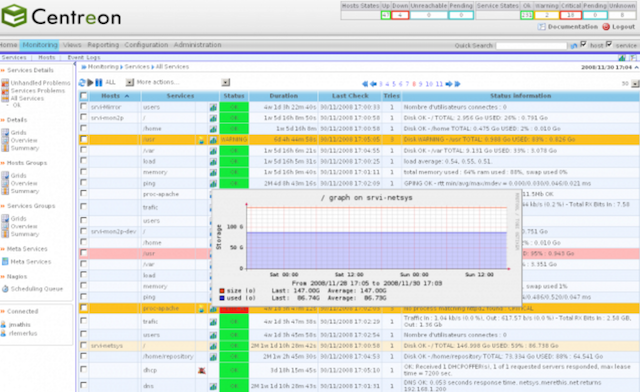
A comprehensive monitoring system allows you to monitor all the infrastructure and applications containing system information. Free alternative to Nagios.
Centreon
18. Ganglia
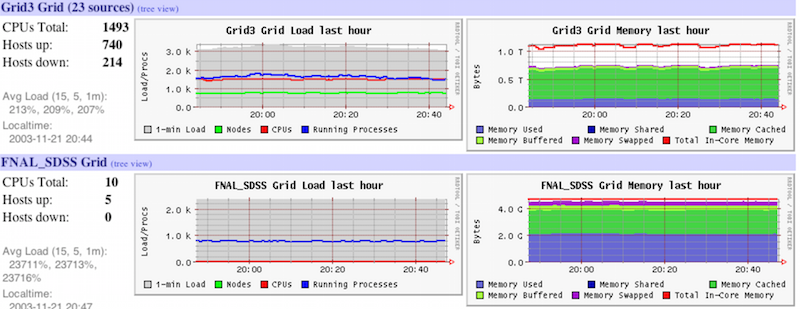
Ganglia is a scalable distributed monitoring system used in high-performance computing systems such as clusters and grids. Tracks statistics and history of calculations in real time for each of the observed nodes.
Ganglia
19. Pandora FMS
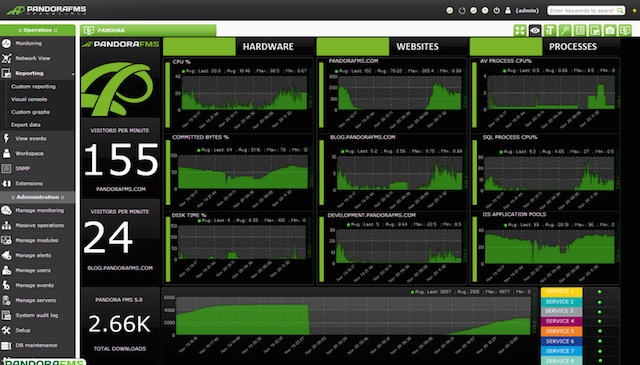
Monitoring system, good productivity and scalability, one monitoring server can monitor the work of several thousand hosts.
Pandora fms
20. NetXMS
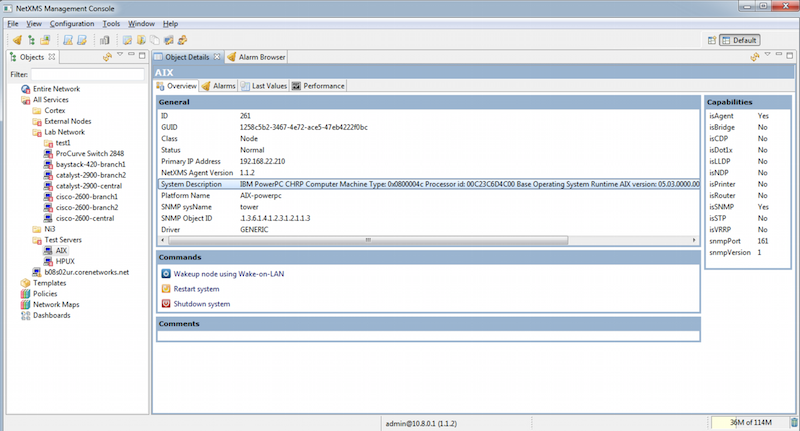
Open source software for monitoring computer systems and networks.
Netxms
21. OpenNMS
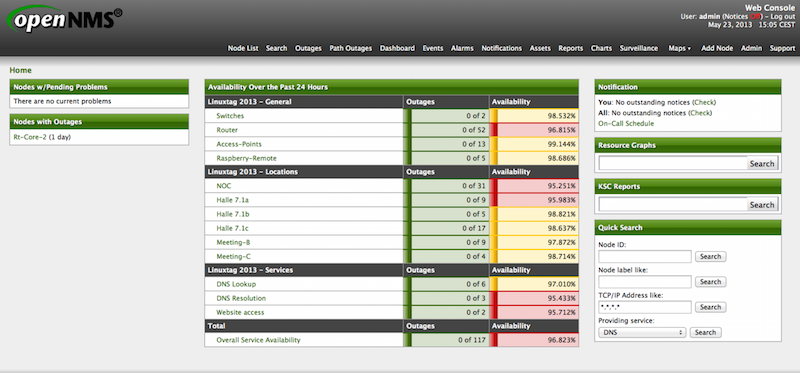
OpenNMS monitoring platform. Unlike Nagios, it supports SNMP, WMI and JMX.
OpenNMS
22. HypericHQ

The VMware vRealize Operations package component is used to monitor OS, middleware and applications in physical, virtual and cloud environments. Displays availability, performance, usage, events, log entries and changes at each level of the virtualization stack (from the vSphere hypervisor to the guest OS).
Hyperichq
23. Bosun
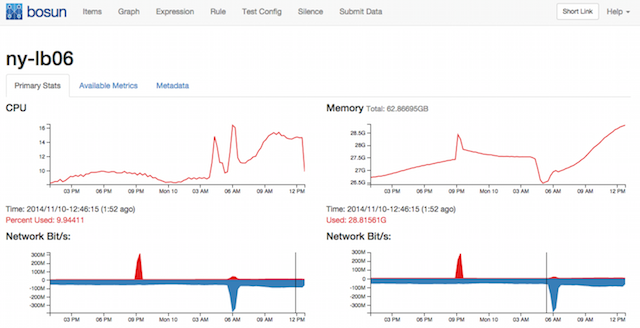
An open source monitoring and alert system from StackExchange. Bosun has a well-designed data schema and powerful processing language.
Bosun
24. Sensu
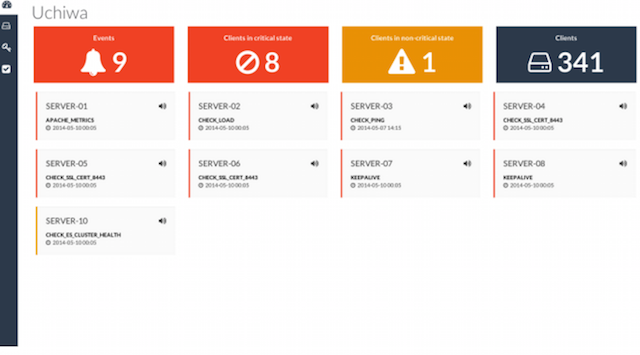
Sensu is an open source alert system, similar to Nagios. There is a simple dashboard, you can see a list of clients, checks and triggered alerts. The framework provides the mechanisms that are needed to collect and accumulate server statistics. Each server runs the Sensu agent (client), which uses a set of scripts to check the health of the services, their status and collect any other information.
Sensu
25. CollectM
CollectM collects statistics on the use of system resources every 10 seconds. It can collect statistics for several hosts and send it to the server, the information is displayed using graphs.
CollectM
26. PerfTrap
PerfTrap collects metrics from servers, and the graphical data is visualized using Graphite.
27. WMIagent
If you are a Python fan, WMIagent is for you.
28. Performance Analysis of Logs (PAL) Tool
PAL is a powerful tool that monitors performance and analyzes it.
29. PolyMon
PolyMon is an open source system monitoring tool for the .NET Framework 2.0 and SQL Server 2005.
30. Cloud Ninja Metering Block
Cloud Ninja Metering Block performs performance analysis and automatic scaling of multi-tenant applications in Windows Azure. Such analysis includes not only the identification or verification of accounts for the use of resources from Windows Azure, but also the optimization of resources.
31. Enigma
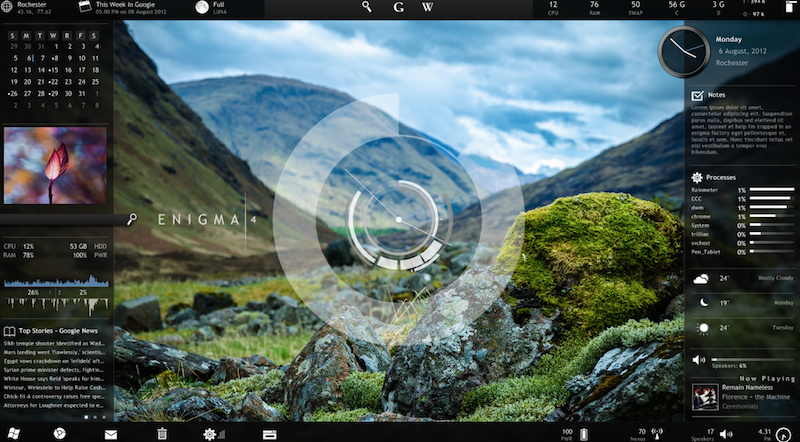
Enigma is a beautiful application that will help you keep track of all the important indicators right from the desktop.
32. SSC Serv
SSC Serv is a paid monitoring tool.
33. KS-HostMonitor
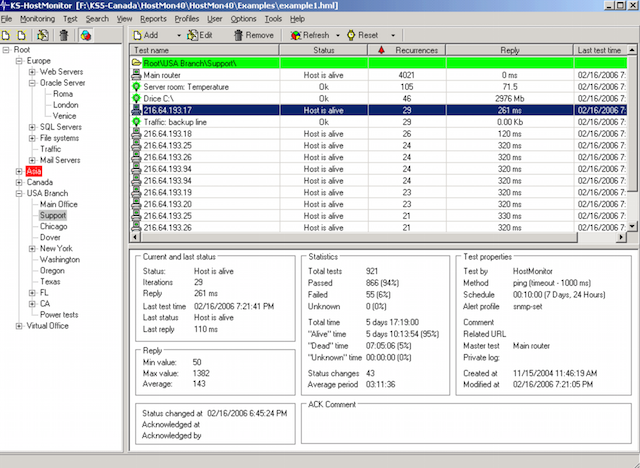
Tools for monitoring network resources, allows you to check any server settings, flexible action profiles allow you to act depending on the test results.
KS-HostMonitor
34. Total Network Monitor
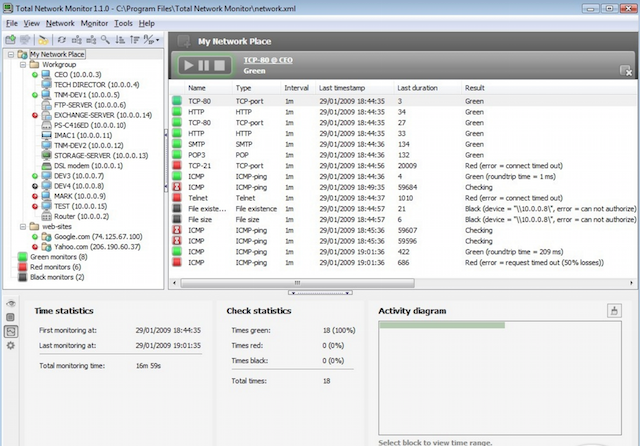
This is a program for continuous monitoring of the local network of individual computers, network and system services. Total Network Monitor generates a report and notifies you of errors that occurred. You can check any aspect of the service, server or file system: FTP, POP / SMTP, HTTP, IMAP, Registry, Event Log, Service State and others.
Total Network Monitor
35. PRTG
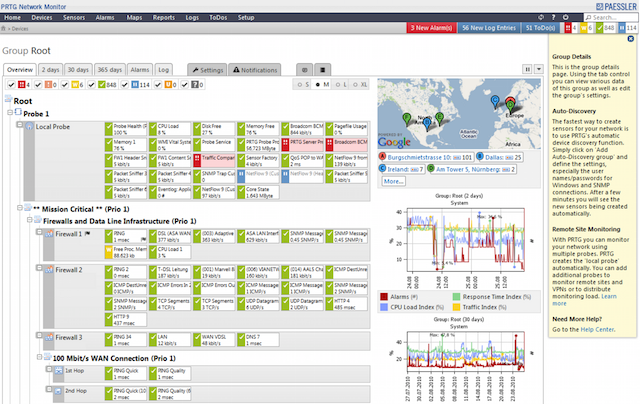
PRTG , an easy-to-use, shareware monitoring program for the network, collects various statistics from computers, programs, and devices that you specify, supports many protocols for collecting specified information, such as SNMP and WMI.
36. GroundWork
GroundWork , compared to Nagios or Cacti, does not require much time to configure. For managing and displaying information, an intuitive web interface is used, which is based on Monarch (MONitor ARCHitecture) and Fruity. If a problem occurs, a message or SMS will be sent to the specified email address. The provided reporting system allows you to analyze all processes in time.
37. WhatsUpGold
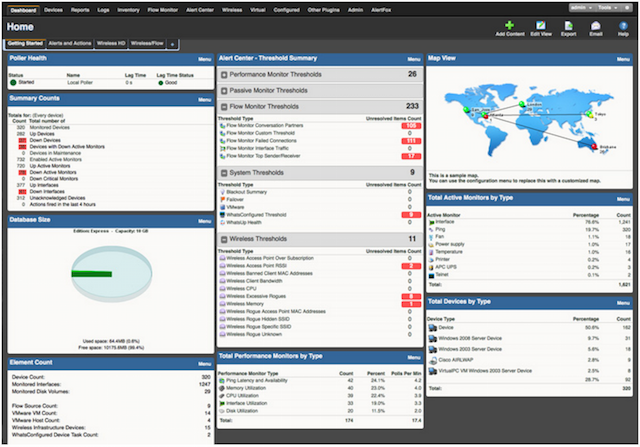
This is a powerful, easy-to-use software tool for comprehensive monitoring of applications, networks and systems. Allows you to troubleshoot problems before they affect user experience.
Whatsupgold
38. Idera
Supports multiple operating systems and virtualization technologies. There are many free tools with which you can monitor the system.
Windows Health Check
Windows Capacity Check
Windows Process Heat Map
Idera
39. PowerAdmin
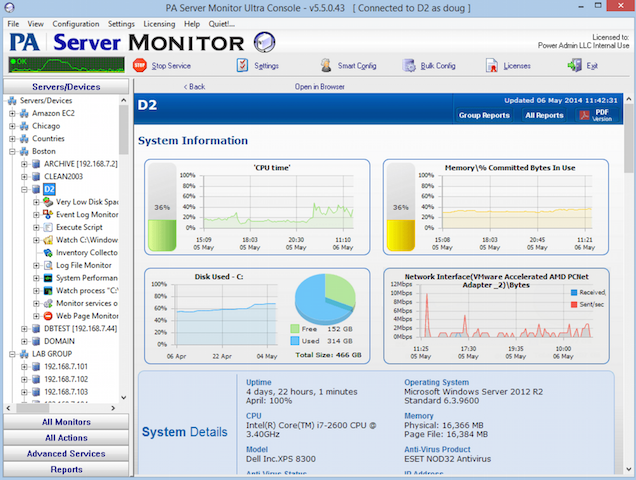
PowerAdmin is a commercial monitoring solution.
Poweradmin
40. ELM Enterprise Manager
ELM Enterprise Manager - complete monitoring from “what happened” to “what is happening” in real time. Monitoring tools in ELM include - Event Collector, Performance Monitor, Service Monitor, Process Monitor, File Monitor, PING Monitor.
ELM Enterprise Manager
41. EventsEntry

EventsEntry
42. Veeam ONE
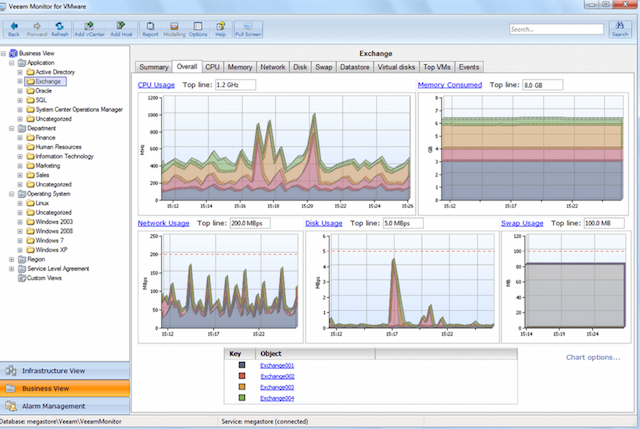
An effective solution for monitoring, creating reports and scheduling resources in a VMware, Hyper-V and Veeam Backup & Replication infrastructure, monitors the state of the IT infrastructure and diagnoses problems before they interfere with users.
Veeam ONE
43. CA Unified Infrastructure Management (formerly CA Nimsoft Monitor, Unicenter)
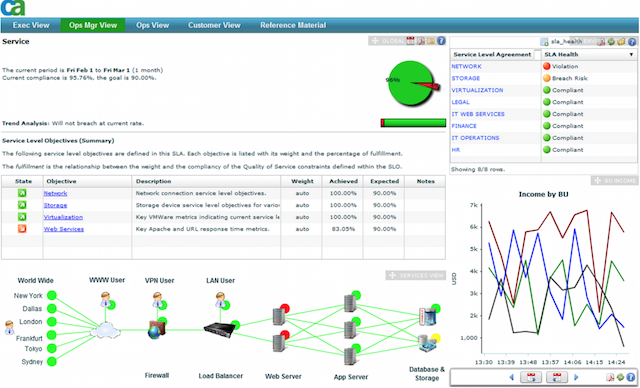
Monitors the performance and availability of Windows server resources.
CA
44. HP Operations Manager
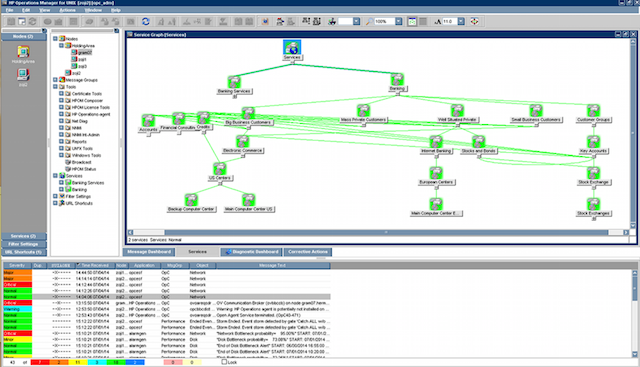
This infrastructure monitoring software, performs proactive root cause analysis, reduces recovery time and operations management costs. The solution is ideal for automated monitoring.
HP Operations Manager
45. Dell OpenManage
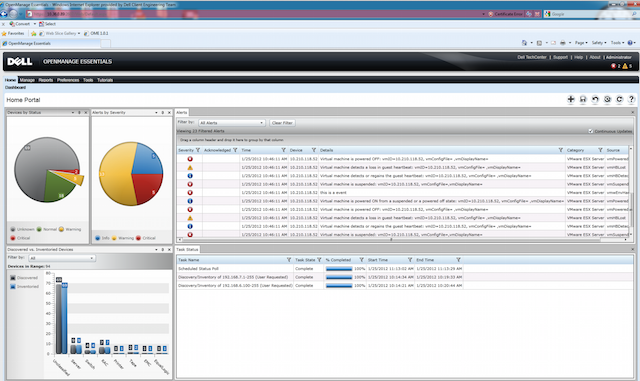
OpenManage (now Dell Enterprise Systems Management) is an all-in-one product for monitoring.
46. Halcyon Windows Server Manager
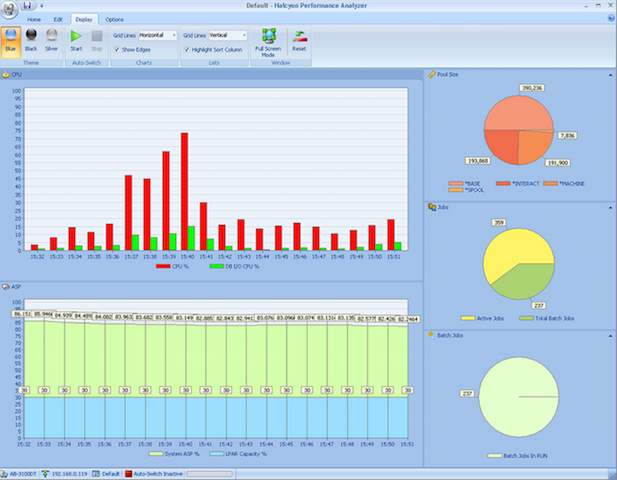
Halcyon Windows Server Manager
47. Topper Perfmon
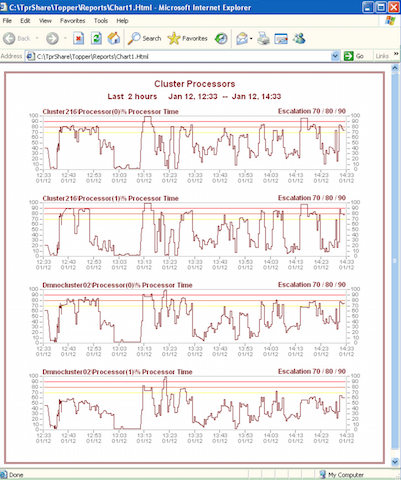
Used for monitoring servers, monitors processes, their performance.
Topper perfmon
48. BMC Patrol
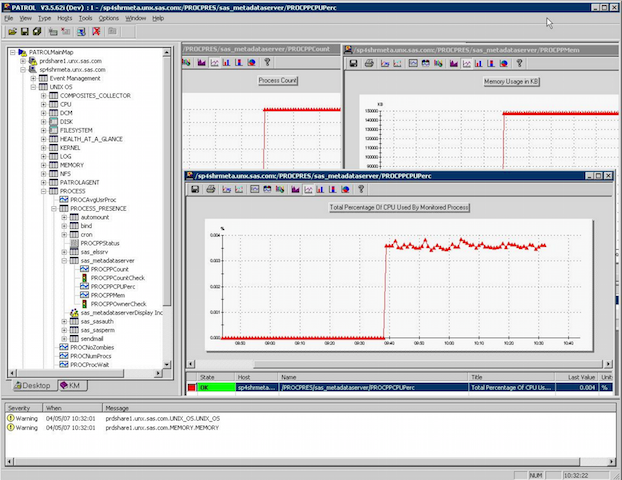
Monitoring system and management of IT infrastructure.
Patrol
49. Max Management
Max Management
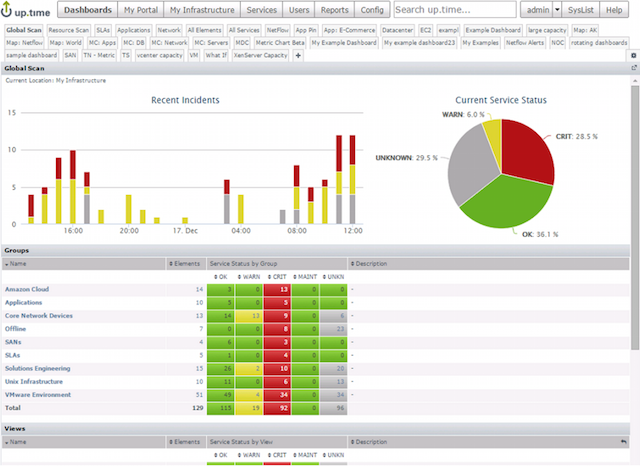
50. ScienceLogic
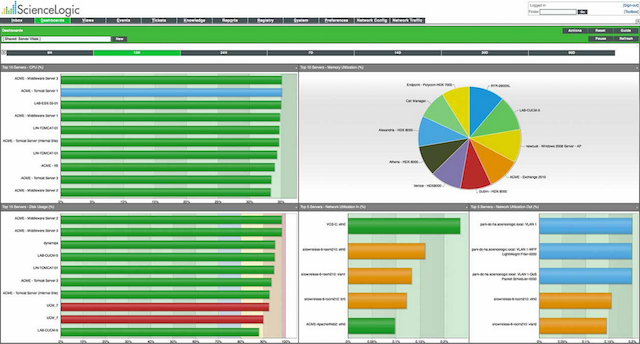
ScienceLogic is another monitoring system.
51. VeraX
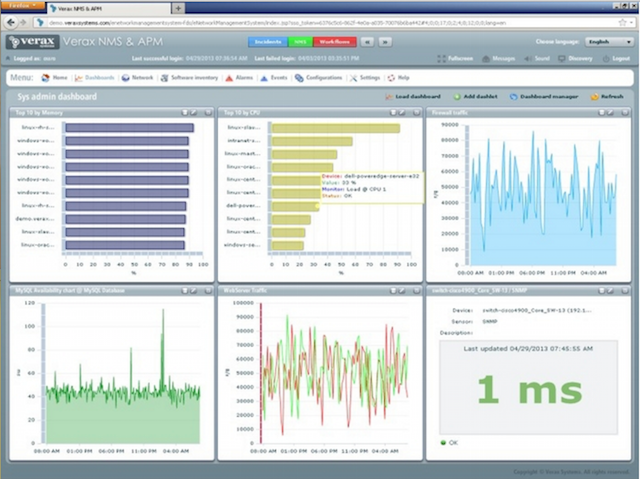
Management and monitoring of networks, applications and infrastructure.
Verax
54. Ntop
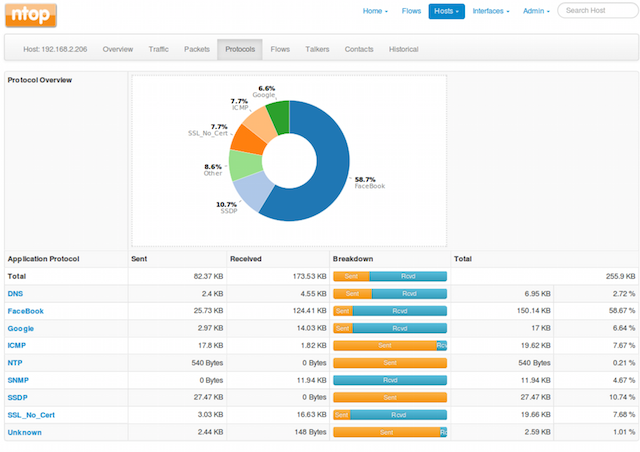
Ntop
55. NeDi
Nedi is an open source network monitoring tool.
Nedi
54. The Dude
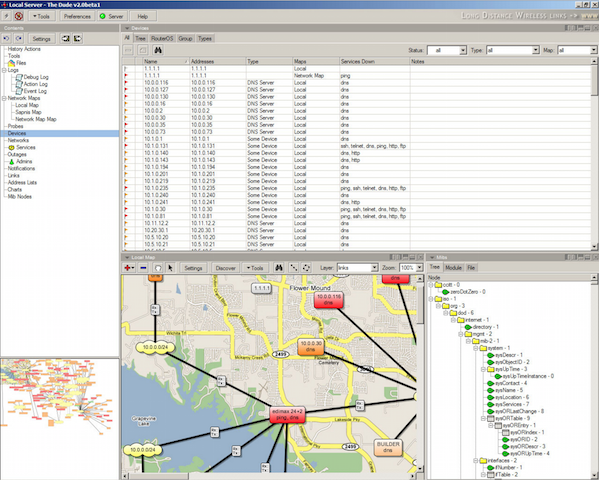
The Dude monitoring system, although free of charge, but according to experts, is in no way inferior to commercial products, it monitors individual servers, networks and network services.
The dude
55. BandwidthD
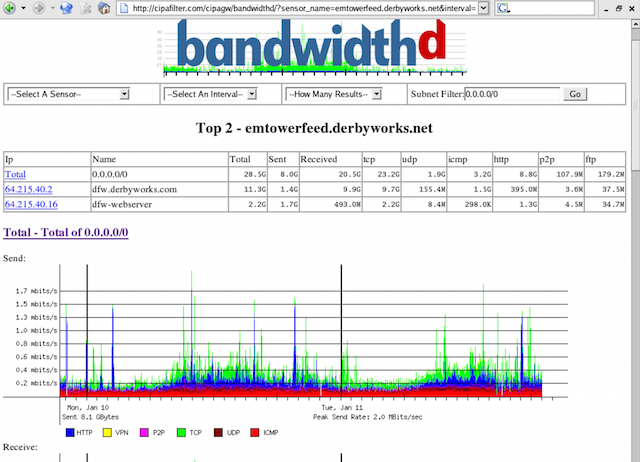
An open source program.
BandwidthD
56. NagVis
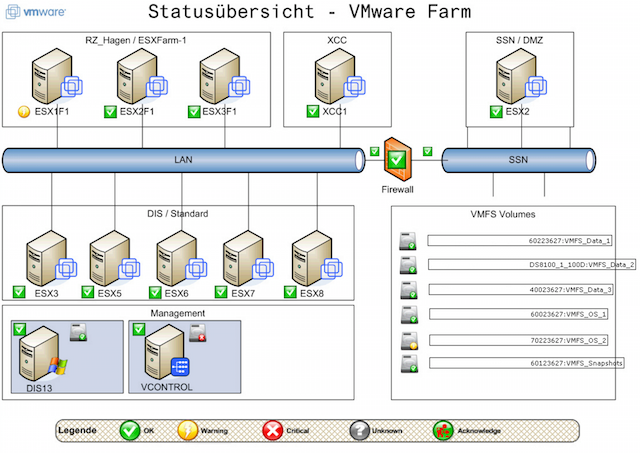
An extension for Nagios, allows you to create infrastructure maps and display their status. NagVis supports a large number of different widgets, sets of icons.
NagVis
57. Proc Net Monitor
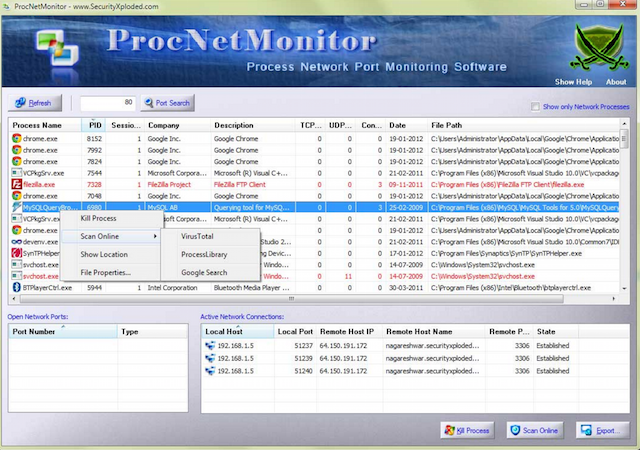
A free monitoring application allows you to track all active processes and, if necessary, quickly stop them in order to reduce the load on the processor.
Proc Net Monitor
58. PingPlotter
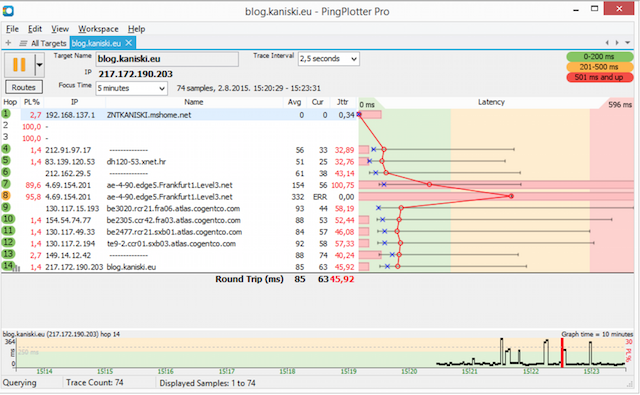
Used to diagnose IP networks, allows you to determine where losses and delays of network packets occur.
Pingplotter
The list would not be complete without mentioning several options for hardware monitoring.
59. IPMIutil
IPMIutil
60. Glint Computer Activity Monitor
Glint Computer Activity Monitor
61. RealTemp
The utility for monitoring the temperatures of Intel processors, it does not require installation, monitors the current, minimum and maximum temperatures for each core and the start of throttling.
Realtemp
62. SpeedFan
The utility, which allows you to control the temperature and speed of rotation of the fans in the system, monitors the performance of the sensors on the motherboard, video card and hard drives.
Speedfan
63. OpenHardwareMonitor
Openhardwaremonitor
A source
1. Task Manager
')
The well-known Windows Task Manager is a utility for displaying a list of running processes and the resources they consume. But do you know how to use its full potential? As a rule, with its help control the state of the processor and memory, but you can also go much further. This application is tentatively on all Microsoft operating systems.
Task manager
2. Resource Monitor
A great tool to evaluate CPU, RAM, network, and disk usage in Windows. It allows you to quickly get all the necessary information about the status of critical servers.
Resource Monitor
3. Performance Monitor
The main tool for managing performance counters in Windows. Performance Monitor, in earlier versions of Windows, is known to us as System Monitor. The utility has several display modes, displays the performance counters in real time, saves data in log files for further study.
Performance monitor
4.Reliability Monitor
Reliability Monitor - System stability monitor, allows you to monitor any changes in computer performance, you can find a stability monitor in Windows 7, in Windows 8: Control Panel> System and Security> Action Center. Using Reliability Monitor, you can keep track of changes and failures on your computer, the data will be displayed in a convenient graphical form that will allow you to track which application and when it caused an error or freeze, track the appearance of the blue screen of Windows death, the reason for its appearance (another Windows update or program installation).
Reliability Monitor
5. Microsoft SysInternals
SysInternals is a complete set of programs for administering and monitoring computers running Windows. You can download them for free on the Microsoft website. Sysinternals service programs help manage, troubleshoot, troubleshoot, and diagnose Windows applications and operating systems.
SysInternals
6. SCOM (part of Microsoft System Center)
System Center - is a complete set of tools for managing IT-infrastructure, with which you can manage, deploy, monitor, tune Microsoft software (Windows, IIS, SQLServer, Exchange, and so on). Alas, MSC is not free. SCOM is used for proactive monitoring of key IT facilities.
Scom
Monitoring Windows Servers Using the Nagios Family
7. Nagios
Nagios is the most popular infrastructure monitoring tool for several years (for Linux and Windows). If you are viewing Nagios for Windows, then install and configure the NSClient ++ agent on the Windows server. NSClient ++ monitors the system in real time and provides outputs from a remote monitoring server and not only.
Nagios
8. Cacti
Usually used in conjunction with Nagios, it provides the user with a convenient web interface to the RRDTool utility designed for working with circular databases (Round Robin Database), which are used to store information about changes in one or several quantities over a certain period of time. Statistics in network devices, presented in the form of a tree, the structure of which is set by the user, you can build a graph of the use of the channel, the use of HDD partitions, display the latency of resources, etc.
Cacti
9. Shinken
A flexible, scalable, open source monitoring system based on the Nagios kernel written in Python. She is 5 times faster than Nagios. Shinken is compatible with Nagios, it is possible to use its plug-ins and configurations without making adjustments or additional settings.
Shinken
10. Icinga
Another popular open source monitoring system that checks hosts and services and informs the administrator about their status. Being a branch of Nagios, Icinga is compatible with it and they have a lot in common.
11. OpsView
OpsView was originally free. Now, alas, users of this monitoring system have to fork out.
Opsview
12. Op5
Op5 is another open source monitoring system. Plotting, storage and data collection.
Op5
Alternatives to Nagios
13. Zabbix
Open source software for monitoring and tracking the status of various computer network services, servers and network equipment, is used to obtain data on processor load, network utilization, disk space, and the like.
Zabbix
14. Munin
A good monitoring system that collects data from several servers at the same time and displays everything in the form of graphs with which you can monitor all past events on the server.
Munin
15. Zenoss
Written in Python using the Zope application server, data is stored in MySQL. With Zenoss you can
monitor network services, system resources, device performance, Zenoss core analyzes the environment. This makes it possible to quickly deal with a large number of specific devices.
Zenoss
16. Observium
The system of monitoring and monitoring of network devices and servers, although the list of supported devices is huge and is not limited to only network devices, the device must support the operation of SNMP.
Observium
17. Centreon
A comprehensive monitoring system allows you to monitor all the infrastructure and applications containing system information. Free alternative to Nagios.
Centreon
18. Ganglia
Ganglia is a scalable distributed monitoring system used in high-performance computing systems such as clusters and grids. Tracks statistics and history of calculations in real time for each of the observed nodes.
Ganglia
19. Pandora FMS
Monitoring system, good productivity and scalability, one monitoring server can monitor the work of several thousand hosts.
Pandora fms
20. NetXMS
Open source software for monitoring computer systems and networks.
Netxms
21. OpenNMS
OpenNMS monitoring platform. Unlike Nagios, it supports SNMP, WMI and JMX.
OpenNMS
22. HypericHQ
The VMware vRealize Operations package component is used to monitor OS, middleware and applications in physical, virtual and cloud environments. Displays availability, performance, usage, events, log entries and changes at each level of the virtualization stack (from the vSphere hypervisor to the guest OS).
Hyperichq
23. Bosun
An open source monitoring and alert system from StackExchange. Bosun has a well-designed data schema and powerful processing language.
Bosun
24. Sensu
Sensu is an open source alert system, similar to Nagios. There is a simple dashboard, you can see a list of clients, checks and triggered alerts. The framework provides the mechanisms that are needed to collect and accumulate server statistics. Each server runs the Sensu agent (client), which uses a set of scripts to check the health of the services, their status and collect any other information.
Sensu
25. CollectM
CollectM collects statistics on the use of system resources every 10 seconds. It can collect statistics for several hosts and send it to the server, the information is displayed using graphs.
CollectM
26. PerfTrap
PerfTrap collects metrics from servers, and the graphical data is visualized using Graphite.
27. WMIagent
If you are a Python fan, WMIagent is for you.
28. Performance Analysis of Logs (PAL) Tool
PAL is a powerful tool that monitors performance and analyzes it.
29. PolyMon
PolyMon is an open source system monitoring tool for the .NET Framework 2.0 and SQL Server 2005.
30. Cloud Ninja Metering Block
Cloud Ninja Metering Block performs performance analysis and automatic scaling of multi-tenant applications in Windows Azure. Such analysis includes not only the identification or verification of accounts for the use of resources from Windows Azure, but also the optimization of resources.
31. Enigma
Enigma is a beautiful application that will help you keep track of all the important indicators right from the desktop.
Paid solutions
32. SSC Serv
SSC Serv is a paid monitoring tool.
33. KS-HostMonitor
Tools for monitoring network resources, allows you to check any server settings, flexible action profiles allow you to act depending on the test results.
KS-HostMonitor
34. Total Network Monitor
This is a program for continuous monitoring of the local network of individual computers, network and system services. Total Network Monitor generates a report and notifies you of errors that occurred. You can check any aspect of the service, server or file system: FTP, POP / SMTP, HTTP, IMAP, Registry, Event Log, Service State and others.
Total Network Monitor
35. PRTG
PRTG , an easy-to-use, shareware monitoring program for the network, collects various statistics from computers, programs, and devices that you specify, supports many protocols for collecting specified information, such as SNMP and WMI.
36. GroundWork
GroundWork , compared to Nagios or Cacti, does not require much time to configure. For managing and displaying information, an intuitive web interface is used, which is based on Monarch (MONitor ARCHitecture) and Fruity. If a problem occurs, a message or SMS will be sent to the specified email address. The provided reporting system allows you to analyze all processes in time.
37. WhatsUpGold
This is a powerful, easy-to-use software tool for comprehensive monitoring of applications, networks and systems. Allows you to troubleshoot problems before they affect user experience.
Whatsupgold
38. Idera
Supports multiple operating systems and virtualization technologies. There are many free tools with which you can monitor the system.
Windows Health Check
Windows Capacity Check
Windows Process Heat Map
Idera
39. PowerAdmin
PowerAdmin is a commercial monitoring solution.
Poweradmin
40. ELM Enterprise Manager
ELM Enterprise Manager - complete monitoring from “what happened” to “what is happening” in real time. Monitoring tools in ELM include - Event Collector, Performance Monitor, Service Monitor, Process Monitor, File Monitor, PING Monitor.
ELM Enterprise Manager
41. EventsEntry
EventsEntry
42. Veeam ONE
An effective solution for monitoring, creating reports and scheduling resources in a VMware, Hyper-V and Veeam Backup & Replication infrastructure, monitors the state of the IT infrastructure and diagnoses problems before they interfere with users.
Veeam ONE
43. CA Unified Infrastructure Management (formerly CA Nimsoft Monitor, Unicenter)
Monitors the performance and availability of Windows server resources.
CA
44. HP Operations Manager
This infrastructure monitoring software, performs proactive root cause analysis, reduces recovery time and operations management costs. The solution is ideal for automated monitoring.
HP Operations Manager
45. Dell OpenManage
OpenManage (now Dell Enterprise Systems Management) is an all-in-one product for monitoring.
46. Halcyon Windows Server Manager
Halcyon Windows Server Manager
47. Topper Perfmon
Used for monitoring servers, monitors processes, their performance.
Topper perfmon
48. BMC Patrol
Monitoring system and management of IT infrastructure.
Patrol
49. Max Management
Max Management
50. ScienceLogic
ScienceLogic is another monitoring system.
51. VeraX
Management and monitoring of networks, applications and infrastructure.
Verax
Below is a list of (most popular) network monitoring tools.
54. Ntop
Ntop
55. NeDi
Nedi is an open source network monitoring tool.
Nedi
54. The Dude
The Dude monitoring system, although free of charge, but according to experts, is in no way inferior to commercial products, it monitors individual servers, networks and network services.
The dude
55. BandwidthD
An open source program.
BandwidthD
56. NagVis
An extension for Nagios, allows you to create infrastructure maps and display their status. NagVis supports a large number of different widgets, sets of icons.
NagVis
57. Proc Net Monitor
A free monitoring application allows you to track all active processes and, if necessary, quickly stop them in order to reduce the load on the processor.
Proc Net Monitor
58. PingPlotter
Used to diagnose IP networks, allows you to determine where losses and delays of network packets occur.
Pingplotter
Small but useful tools
The list would not be complete without mentioning several options for hardware monitoring.
59. IPMIutil
IPMIutil
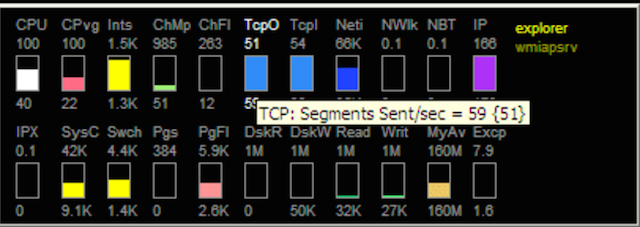
60. Glint Computer Activity Monitor
Glint Computer Activity Monitor
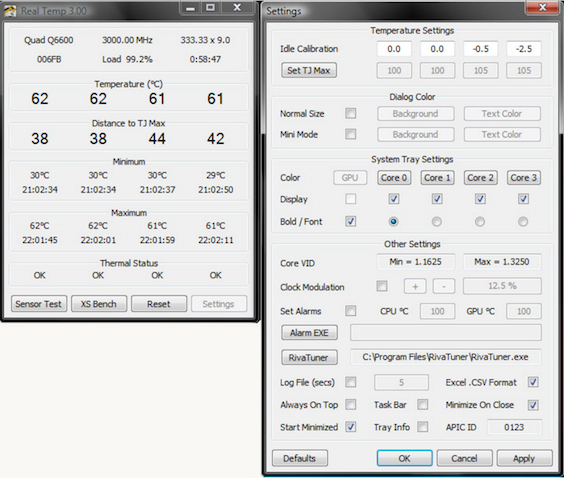
61. RealTemp
The utility for monitoring the temperatures of Intel processors, it does not require installation, monitors the current, minimum and maximum temperatures for each core and the start of throttling.
Realtemp
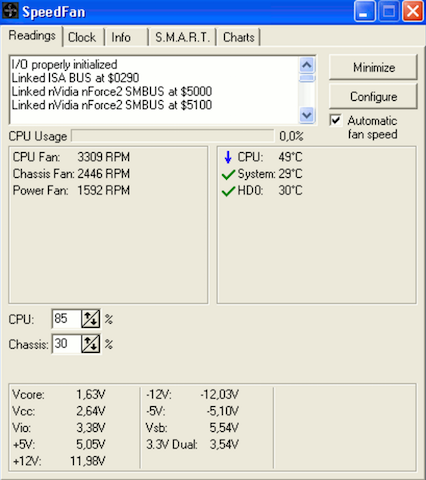
62. SpeedFan
The utility, which allows you to control the temperature and speed of rotation of the fans in the system, monitors the performance of the sensors on the motherboard, video card and hard drives.
Speedfan
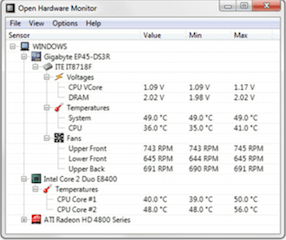
63. OpenHardwareMonitor
Openhardwaremonitor
A source
Source: https://habr.com/ru/post/280578/
All Articles