Again about IDS or ELK for suricata
Hi Hi!
Today I want to share with you the experience of setting up ELK and IDS Suricata. There are many manuals on the Internet, but none of them will allow to “import” a bundle of these products in current versions.
There is also a ready-made SELKS distribution kit - www.stamus-networks.com/open-source/#selks or, alternatively, a bunch of snort, snorby and barnyard2 in SecOnion - blog.securityonion.net .
For the rest I ask under the cat.
So, what we need:
A system that will visually display events from IDS, and that this is not ArcSight, OSSIM, QRadar, etc.
To begin, find something from RHEL7 or CentOS7. Ubuntu LTS is also possible, which you prefer for production.
As well as the components themselves ELK and IDS.
Suricata - suricata-ids.org
ElasticSearch - www.elastic.co/products/elasticsearch
Logstash - www.elastic.co/products/logstash
Kibana - www.elastic.co/products/kibana
Well, to blow to make a miracle ... I mean, think!
First, install the necessary components (java, json):
Download and install ids suricata:
Further
Or the following commands for automatic configuration: make install-conf; make install-rules
make install-full –If you do not need to fine-tune something, I recommend using this command. Variables will be automatically created, folders and rules will be rendered correspondingly to the / rules directory.
During automatic installation, the directory with logs we need will be located in:
Here are the files: eve.json fast.log http.log stats.log. But not all files are equally useful. We need the one whose json tail
Now you need to configure IDS. We will only focus on the fact that alerts fall into the json file. Go to /etc/suricata/suricata.yaml and find there a block for logging or alerts. For output in json you need this config:
The rest of the config is at your discretion. Fortunately there is something to think about.
Next elsasticsearch:
Checking what's up with java:
If everything is ok, we continue (otherwise, to the beginning of the note).
Download and install elasticsearch:
Status –OK? Let's go for Logstash
Tver needs to configure it, go to /etc/logstash/conf.d/
This is how the working logstash config for current versions of software components looks like:
Save, check the configuration:
Finally, we install the web face of our IDS system - Kibana4.
Unpack it into a folder, like this: / opt / kibana4 / or / var / www / html /. In the / opt / kibana4 / bin / directory, start the web interface. You can make the service as - described here discuss.elastic.co/t/run-kibana-as-service-on-centos/23971/2 . I did not do it.
It happens that when starting kibana, the error “kibana is still indexing” appears, this can be seen in the console or on the web dashboard in the “Status” dashboard. To eliminate the error, we make the following commands with success checks:
Now we need indexes. Come here github.com/StamusNetworks/KTS . Here we will find already prepared indexes and dashboards.
To launch the IDS engine, enter:
Pay attention to the name of the interface and its mode of operation. For passive analysis, it is necessary to transfer the interface to promisc mode, and a SPAN session is also better to acquire:
After running IDS, the size of the log files should increase significantly.
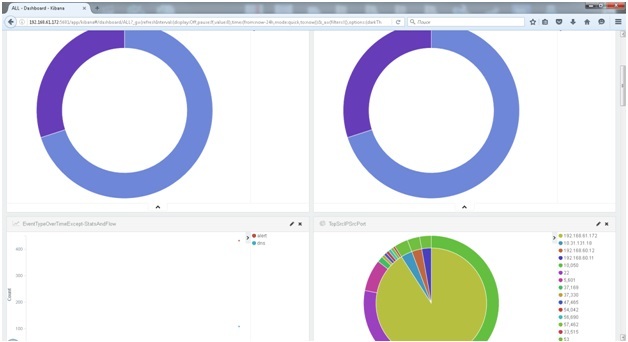
If there were no critical errors at startup, go to port 5601. We select logstash- * indexes, go to Dashboards and create a display interface for ourselves. There may be something like this:
Or to this (the screen is not mine):
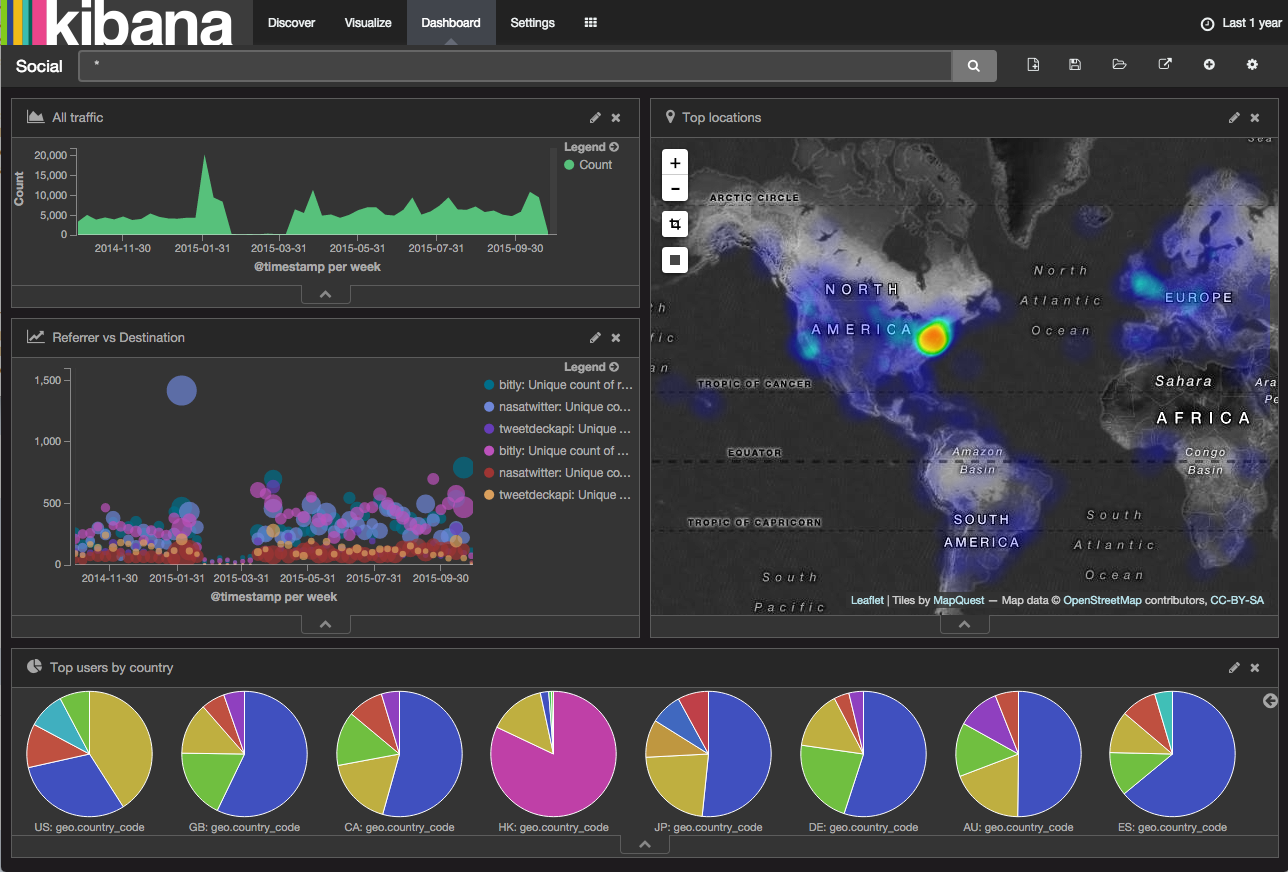
In order to look at the map, you need to uncomment this line in the logstash config: #database => "/opt/logstash/vendor/geoip/GeoLiteCity.dat" and download the actual or similar file with geolocation by IP.
Yes, do not forget about the Log rotation.
In /etc/logrotate.d/ create a file suricata with the following content:
I will be glad to your comments.
If you try and not get ELK or suricata, write, maybe that will come out =)
Today I want to share with you the experience of setting up ELK and IDS Suricata. There are many manuals on the Internet, but none of them will allow to “import” a bundle of these products in current versions.
There is also a ready-made SELKS distribution kit - www.stamus-networks.com/open-source/#selks or, alternatively, a bunch of snort, snorby and barnyard2 in SecOnion - blog.securityonion.net .
For the rest I ask under the cat.
So, what we need:
A system that will visually display events from IDS, and that this is not ArcSight, OSSIM, QRadar, etc.
To begin, find something from RHEL7 or CentOS7. Ubuntu LTS is also possible, which you prefer for production.
As well as the components themselves ELK and IDS.
Suricata - suricata-ids.org
ElasticSearch - www.elastic.co/products/elasticsearch
Logstash - www.elastic.co/products/logstash
Kibana - www.elastic.co/products/kibana
Well, to blow to make a miracle ... I mean, think!
IDS
First, install the necessary components (java, json):
yum -y install java-1.8.0-openjdk-devel.x86_64 yum -y install gcc libpcap-devel pcre-devel libyaml-devel file-devel zlib-devel jansson-devel nss-devel libcap-ng-devel libnet-devel tar make libnetfilter_queue-devel lua-devel Download and install ids suricata:
wget http://www.openinfosecfoundation.org/download/suricata-3.0.tar.gz tar -xvzf suricata-3.0.tar.gz cd suricata-3.0 ./configure --prefix=/usr --sysconfdir=/etc --localstatedir=/var --enable-nfqueue --enable-lua Further
make; sudo make install; sudo ldconfig Or the following commands for automatic configuration: make install-conf; make install-rules
make install-full –If you do not need to fine-tune something, I recommend using this command. Variables will be automatically created, folders and rules will be rendered correspondingly to the / rules directory.
During automatic installation, the directory with logs we need will be located in:
@srv-ids ~]# cd /var/log/suricata/ Here are the files: eve.json fast.log http.log stats.log. But not all files are equally useful. We need the one whose json tail
Now you need to configure IDS. We will only focus on the fact that alerts fall into the json file. Go to /etc/suricata/suricata.yaml and find there a block for logging or alerts. For output in json you need this config:
- eve-log: enabled: yes filetype: regular #regular|syslog|unix_dgram|unix_stream|redis filename: eve.json The rest of the config is at your discretion. Fortunately there is something to think about.
ELK
Next elsasticsearch:
Checking what's up with java:
java –version echo $JAVA_HOME If everything is ok, we continue (otherwise, to the beginning of the note).
Download and install elasticsearch:
wget https://download.elasticsearch.org/elasticsearch/release/org/elasticsearch/distribution/rpm/elasticsearch/2.2.1/elasticsearch-2.2.1.rpm sudo rpm -Uvh ./elasticsearch-2.2.1.rpm sudo systemctl daemon-reload sudo systemctl enable elasticsearch.service sudo systemctl start elasticsearch.service sudo systemctl status elasticsearch.service Status –OK? Let's go for Logstash
wget https://download.elastic.co/logstash/logstash/packages/centos/logstash-2.2.2-1.noarch.rpm sudo rpm -Uvh ./logstash-2.2.2-1.noarch.rpm Tver needs to configure it, go to /etc/logstash/conf.d/
This is how the working logstash config for current versions of software components looks like:
input { file { path => ["/var/log/suricata/eve.json"] #sincedb_path => ["/var/lib/logstash/"] codec => json type => "SuricataIDPS-logs" start_position => "beginning" } } filter { if [type] == "SuricataIDPS-logs" { date { match => [ "timestamp", "ISO8601" ] } ruby { code => "if event['event_type'] == 'fileinfo'; event['fileinfo']['type']=event['fileinfo']['magic'].to_s.split(',')[0]; end;" } } if [src_ip] { geoip { source => "src_ip" target => "geoip" #database => "/opt/logstash/vendor/geoip/GeoLiteCity.dat" add_field => [ "[geoip][coordinates]", "%{[geoip][longitude]}" ] add_field => [ "[geoip][coordinates]", "%{[geoip][latitude]}" ] } mutate { convert => [ "[geoip][coordinates]", "float" ] } } } output { elasticsearch { hosts => ["localhost:9200"] } #stdout { codec => rubydebug } } Save, check the configuration:
@srv-ids ~]# service logstash configtest Configuration OK Finally, we install the web face of our IDS system - Kibana4.
wget https://download.elastic.co/kibana/kibana/kibana-4.4.2-linux-x64.tar.gz Unpack it into a folder, like this: / opt / kibana4 / or / var / www / html /. In the / opt / kibana4 / bin / directory, start the web interface. You can make the service as - described here discuss.elastic.co/t/run-kibana-as-service-on-centos/23971/2 . I did not do it.
It happens that when starting kibana, the error “kibana is still indexing” appears, this can be seen in the console or on the web dashboard in the “Status” dashboard. To eliminate the error, we make the following commands with success checks:
curl -XDELETE http://localhost:9200/.kibana curl -XDELETE http://localhost:9200/* Now we need indexes. Come here github.com/StamusNetworks/KTS . Here we will find already prepared indexes and dashboards.
git clone https://github.com/StamusNetworks/KTS.git patch -p1 -d /opt/kibana4/ < /opt/kibana4/KTS/patches/kibana-integer.patch patch -p1 -d /opt/kibana4/ < /opt/kibana4/KTS/patches/timelion-integer.patch ./load.sh Go, go, go!
To launch the IDS engine, enter:
@srv-ids ~]# /usr/bin/suricata -c /etc/suricata//suricata.yaml -i eth0 Pay attention to the name of the interface and its mode of operation. For passive analysis, it is necessary to transfer the interface to promisc mode, and a SPAN session is also better to acquire:
@srv-ids ~]# ifconfig eth0 promisc After running IDS, the size of the log files should increase significantly.
If there were no critical errors at startup, go to port 5601. We select logstash- * indexes, go to Dashboards and create a display interface for ourselves. There may be something like this:
Or to this (the screen is not mine):
In order to look at the map, you need to uncomment this line in the logstash config: #database => "/opt/logstash/vendor/geoip/GeoLiteCity.dat" and download the actual or similar file with geolocation by IP.
Yes, do not forget about the Log rotation.
In /etc/logrotate.d/ create a file suricata with the following content:
/var/log/suricata/*.log /var/log/suricata/*.json { rotate 3 missingok nocompress create sharedscripts postrotate /bin/kill -HUP $(cat /var/run/suricata.pid) endscript } I will be glad to your comments.
If you try and not get ELK or suricata, write, maybe that will come out =)
')
Source: https://habr.com/ru/post/280460/
All Articles