Comparison of programming languages regarding work on the upwork.com freelance market + survey
Recently (at the end of March 2016) I did research on the viability of programming languages on upwork.com for one of my projects and thought that it might be interesting to someone else.
First of all, I was interested in the supply / demand ratio for the most popular PL, as well as the level of remuneration for each of them. I was also curious about what level of qualification employers expect (and, accordingly, how much they expect to pay)
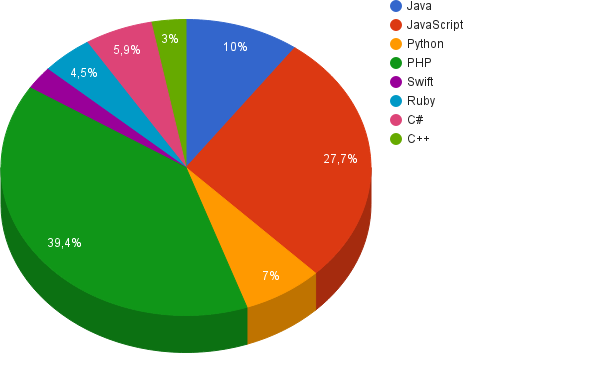
Percentage of offers in popular programming languages
In fact, most of the JavaScript and PHP offers overlap, so in reality, the rest of the PL should have a little more than a percentage, but at the same time some languages did not fall here at all.
Selection of programming languages
Search in Google were selected top programming languages (PL)
- Java
- Python
- Javascript
- C ++
- C #
- SQL
- Php
- Swift
- Ruby
I allowed myself to remove SQL from research: working exclusively with a database programmer on apvorka is very rare, such developers are often required in large corporations for a permanent, and on apvork, knowledge of SQL is simply a practically necessary addition to any other main language.
Search for offers on upwork.com
You saw the ratio of offers in the picture above, but besides this I was also interested in the expectations of employers to the level of specialists.
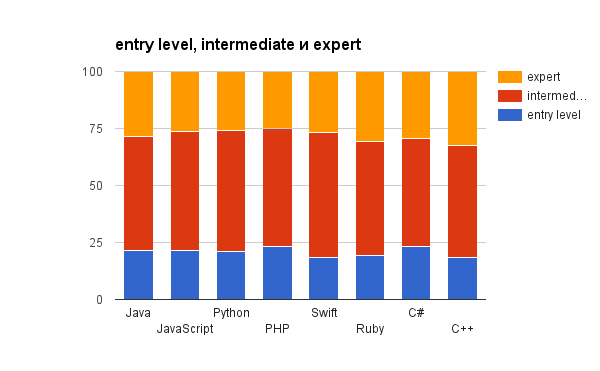
I assumed that for different PLs employers' expectations would be very different, but in practice the difference was insignificant.
Slightly more awaiting expertise from Java, C ++, C # and Ruby developers, and a little more tolerant of PHP beginners and suddenly C # again.
On average, 51.5% of employers expect an intermediate , 26.5% expert and a 22% entry .
')
Search for working freelancers
Unfortunately, the search by freelancers C ++ (3%) and C # (5.9%) did not give actual results. For this reason, I had to remove them from further research, despite the fact that the demand for them is more than the same Ruby (4.5%) and Swift (2.5%). Forgive me, please.
There are two types of "freelancers" on the up-market - those who earn there and those who only registered and scored. I believe that inactive accounts do not represent competition and decided to search only for accounts that have earned at least a dollar on apvorki.
I was also interested in their expectations about pay.
When searching for freelancers on the appork it is possible to filter them by the hourly rate:
- <10 $
- 10 - $ 30
- 30 - 60 $
60 $ +
Taking into account the fact that they all earn at least some yes, this can give some picture of what kind of PL earn more compared to others.
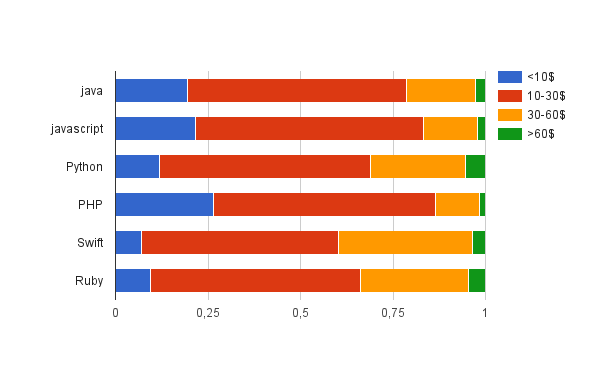
If we talk only about the highest paid freelancers, the rating will be as follows:
- Python
- Ruby
- Swift
- Java
- Javascript
- Php
I think the 1st place of Python is due to the fact that different highly paid analysts get here, who often use it and indicate in skills.
If, however, we take $ 30 + from the “average” for the apvork, then Python and Swift will change places:
- Swift
- Ruby
- Python
The most important thing: supply / demand ratio
By simply dividing the total number of offers by the number of freelancer accounts for each PL, the following picture was obtained:
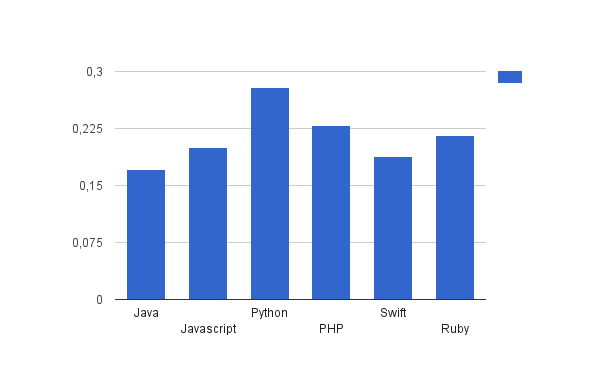
Numbers mean how many offers each freelancer works. The rating is as follows:
- Python (0,279)
- PHP (0,229)
- Ruby (0,216)
- JavaScript (0,200)
- Swift (0.188)
- Java (0.172)
Criticism of the study
- As noted above, the picture is not complete, as it had to be removed from the study of C # and C ++, both languages are excellent and could compete for ratings
- JavaScript and its ratings are not the same. We all understand that making an animation on jQuery, a full-fledged application and a backend are 3 different tasks of a completely different level. In this study, this is not evaluated at all, but as far as I know, programming on Node.JS is now one of the top trends in the global development world.
I removed inactive freelancers from research, but did not filter employers by rating or by the number of paid hours. Many offers always hang unclosed, which can significantly distort the numbers on the last chart. Nevertheless, it probably does not affect the distribution of the rating.
findings
- It’s hard to compete with the PHP codec hindus, but you can always make money on bread
- There are a lot of developers of mobile applications, competition is higher than for other PLs, but those who are kodit for iOS get well
- Python and Ruby are good languages for apv version
- It may be difficult for you to find employers, if you are developing for C # and C ++, you need to send proposals yourself
And also kopetan evidence in his ear whispers that:
- You need to know english
- Knowledge of SQL is required in which language you would not code
- Understanding JavaScript is necessary if you are going to code for the Web
I would be grateful for the objective criticism of the study and advice on how to supplement it and make it more useful.
Source: https://habr.com/ru/post/280041/
All Articles