Five steps to optimize the performance of the application for Android
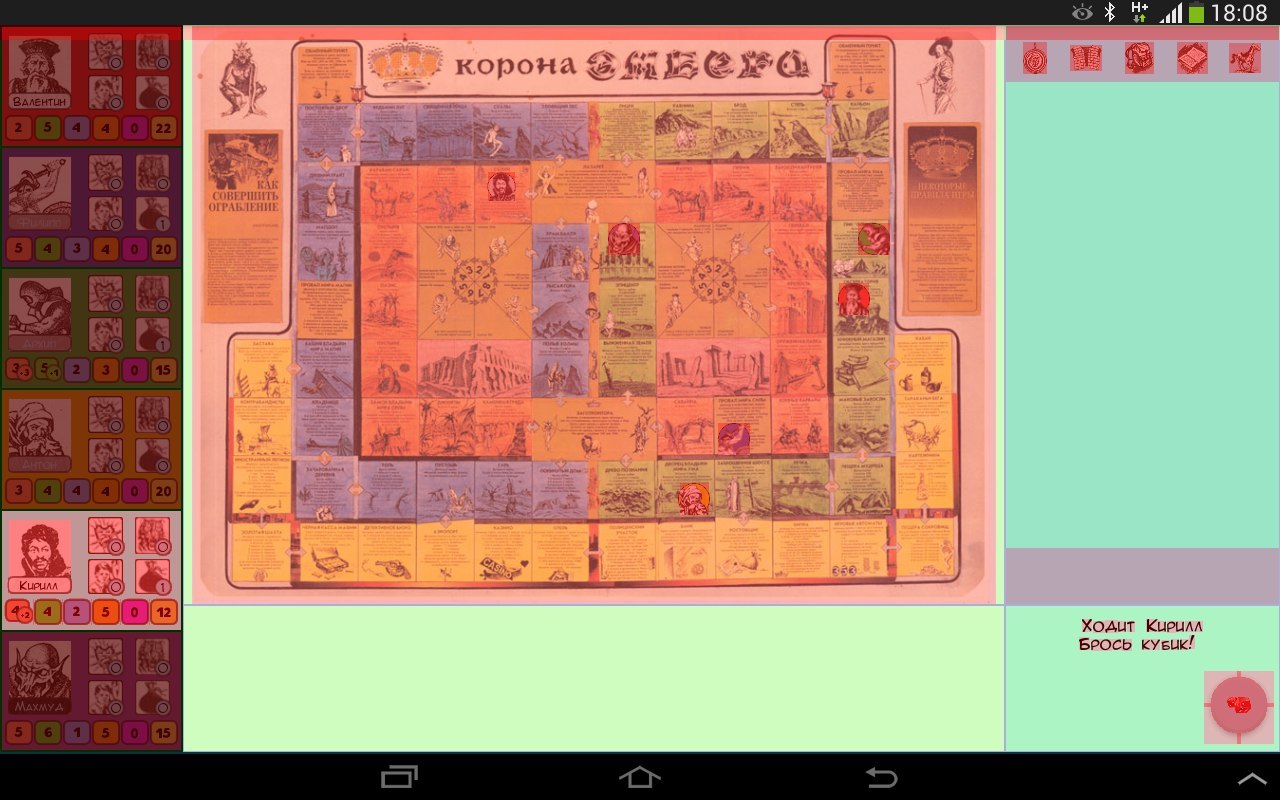
In this small article I want to share with you the experience of how to programmatically optimize the performance of an Android application in 5 simple steps using the example of creating a digital version of the game “Crown of Amber”.
Before creating serious applications with a complex structure of View and Layouts, we didn’t particularly think about how simple and logical “look, I sketched design from the layouts” actions can seriously slow down the entire program.
Among other things, the task with “The Crown of Ember” was complicated by the fact that the game we planned to transfer to the Android platform was in itself rather saturated with various components that somehow had to be placed on the playing field or next to it.
')
In the article I gathered our successful experience and put it into a convenient and readable form, useful for those who still google "how to programmatically optimize the application for Android" or "why my application lags."
The design of the application was created from the "correct" heap of about two hundred View and a dozen Layouts. The loading of the playing field took about 5 seconds, and almost every action hung for another 1-2 seconds. And if on progressive devices and emulators lags were almost imperceptible, then on most less modern devices the picture looked rather sad.

It is clear that this did not suit me, or our team, or testers. And although we were sincerely sure that everything was optimized for nowhere, we began to look for information.
Some of the knowledge that I want to share, we found here - great video tutorials with Russian subtitles (I recommend), part - on Habré, part - in the depths of the Internet, on the same Google Developers site.
Moreover, each time getting a new batch and carrying out another optimization, we were sure that “everything is nowhere further, it will not be faster” and with each step we discovered more and more new things for ourselves.
And that's how it happened.
In fact, this is not even a step, but an insistent recommendation to constantly measure one’s performance. To do this, Android Studio provides several special programs: Android Device Monitor with HierarhyViewer, SystemTracing, Method Profiling; Android Monitor with Memory, CPU and GPU monitors. Describing their work is not the purpose of this article, you can easily find guides here, on Habré, or in the mentioned video tutorials .
The bottom line is that in order to optimize performance, you must first understand where it stumbles.
Although, even without measurement, there are a few things that every developer needs to pay attention to and we will go further.
The main loss of application performance occurs when recalculating and redrawing displayed Layouts. Moreover, the “heavier” the layout is, the longer it takes to recalculate its indicators. And here it is necessary to pay attention to the following points:
- there should not be LinearLayout nested with “weigh” parameters in your hierarchy. Measuring such a layout takes two (three, four! - depending on nesting) more time. It is better to replace this construction with GridLayout (or support.v7.GridLayout for API less than 21);
- some LinearLayout can be replaced by RelativeLayout, thereby removing additional investments, for example ;
- it turns out, RelativeLayout is also measured twice. Where possible, it should be replaced with a more “lightweight” FrameLayout.
Example:
After examining our markup, we were horrified to find that it contains up to four (!) Times LinearLayout with the weight parameter, the playing field consists of almost hundreds of RelativeLayout (cells of the field), and some Layout are simply not needed.
(Green indicates the allowed investment, yellow indicates undesirable, orange indicates dangerous, red indicates “never-do-not!”)

After that, we slightly reworked the structure. The “character” was taken out in a separate fragment with RelativeLayout, all nested Linear were replaced with (one!) Support.v7.GridLayout, and all RelativeLayout (not visible on the screen — these are field cells) was replaced with FrameLayout. It turned out both simpatishny and more productive.

However, this did not solve our problems to the end, and we went further.
It turned out that Android carefully draws every picture, every background of every View on the screen. Here he is, of course, well done. But what to do if some images overlap others, the backgrounds are superimposed and some of this drawing becomes absolutely unnecessary? That's right - turn off everything that is not visible and not necessary.
It is very simple to measure the overlay of redrawing: on your device in the Developer Parameters you need to enable “Show GPU excess”, launch the application and look at the screen.
The colors of the View-elements will show how good or bad you are.
Own color - level 0, “perfect”
The blue color is level 1, “normal.
Green color - level 2, „permissible“.
Light red color - level 3, "undesirable."
Red color - level 4+, "God forbid".
Our picture once again plunged us into horror:
We had to go all the way over again and turn off the background where it turned out to be superfluous. Do not forget about the main back of the application - one simple line:
In the application theme turned it off. And that's what happened in the end. Maybe not always perfect, but it is quite acceptable. (Almost all of the View has gone down 3 levels!)

It is also quite obvious thing that did not seem obligatory - it is caching. In particular (in this case) font caching.
As you have probably noticed, everywhere, including the logs, your own font is used and, oh (again) horror!, Every time, for each new text it is loaded again from Assets. Every time, Karl! (black is the main sweat, brown is the work of Assesnager).

None of us came across caching before, but here we were rescued by one good person with StackOverflow and suggested simple code:
Having applied that, I personally almost completely forgot what lags are.
As in the joke, where the muzhik was told that he would get as much land as he could put on it, he could measure and jump, run, walk, crawl, and at the end, exhausted, he took off his hat and threw as much as he could with the words: dill ", and we sought to optimize performance to the smallest detail.
Therefore, it is time to optimize the code. Of course, then how to write the code is more a matter of correct habit, and here you can only give a few general recommendations (for more details, you can find them in any article on software optimization). This is what our team faced:
- create fewer “unnecessary” cycles. If something can be done without them, do it without them;
- do not create variables in the loop. It is better to create them outside of it, and in the cycle just to update;
- if there is a need to refer to resources repeatedly (using gerResources () or just to another class / array, for example, myList.get (0)) - better write the result into a new variable and use it: int myItem = myList.get (0); - this also gives your application milliseconds of free time;
- if possible, use static methods (if there is no need to refer to the class itself);
- well, the classic way: at the final stage of programming, remove the encapsulation (getters and setters) and access the variable directly.
I am sure that the steps taken are not final and there will always be a “place for dill”, which we did not get to. Always ready to learn about step number 6, 7 ... and even number 157, if you want to share them in the comments. Moreover, for “science” I will be grateful.
In the meantime, summarize what you need to do to start your application to "fly":
1. Measure the performance of your application and find the source of the problem. Maybe it will not be your font, but, for example, a memory leak (turn on Memory Monitor);
2. Optimize the structure and hierarchy of View (we include HierarhyViewer and common sense);
3. We remove all unnecessary backups everywhere, including the background of the application (in this case, please note that in order to display correctly you will still need a common backend);
4. We look at frequently used resources / downloads / images / fonts and cache them;
5. We do software code optimization.
In the end, after all these steps, the image of the application's routing began to look like this:
the delays have almost disappeared (or have become invisible), which is quite convenient for us.
And of course, the first thought that came to my mind after all our optimization: “Wow! Now you can add even more View and Layout to the main screen! “
facepalm, curtain ...
Before creating serious applications with a complex structure of View and Layouts, we didn’t particularly think about how simple and logical “look, I sketched design from the layouts” actions can seriously slow down the entire program.
Among other things, the task with “The Crown of Ember” was complicated by the fact that the game we planned to transfer to the Android platform was in itself rather saturated with various components that somehow had to be placed on the playing field or next to it.
')
In the article I gathered our successful experience and put it into a convenient and readable form, useful for those who still google "how to programmatically optimize the application for Android" or "why my application lags."
So. The starting point (the way it all looked before optimization)
The design of the application was created from the "correct" heap of about two hundred View and a dozen Layouts. The loading of the playing field took about 5 seconds, and almost every action hung for another 1-2 seconds. And if on progressive devices and emulators lags were almost imperceptible, then on most less modern devices the picture looked rather sad.
It is clear that this did not suit me, or our team, or testers. And although we were sincerely sure that everything was optimized for nowhere, we began to look for information.
Some of the knowledge that I want to share, we found here - great video tutorials with Russian subtitles (I recommend), part - on Habré, part - in the depths of the Internet, on the same Google Developers site.
Moreover, each time getting a new batch and carrying out another optimization, we were sure that “everything is nowhere further, it will not be faster” and with each step we discovered more and more new things for ourselves.
And that's how it happened.
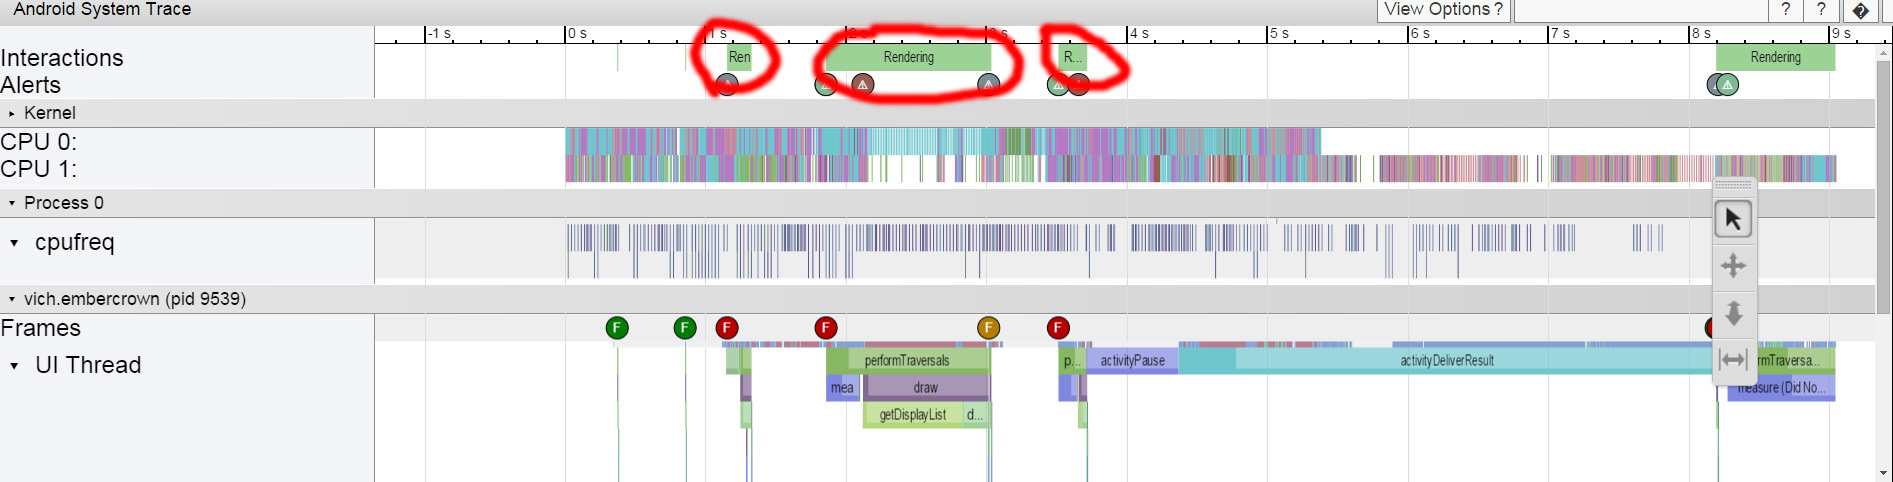
Step 1. Measurement
In fact, this is not even a step, but an insistent recommendation to constantly measure one’s performance. To do this, Android Studio provides several special programs: Android Device Monitor with HierarhyViewer, SystemTracing, Method Profiling; Android Monitor with Memory, CPU and GPU monitors. Describing their work is not the purpose of this article, you can easily find guides here, on Habré, or in the mentioned video tutorials .
The bottom line is that in order to optimize performance, you must first understand where it stumbles.
Although, even without measurement, there are a few things that every developer needs to pay attention to and we will go further.
Step 2. Hierarchy optimization and weight reduction
The main loss of application performance occurs when recalculating and redrawing displayed Layouts. Moreover, the “heavier” the layout is, the longer it takes to recalculate its indicators. And here it is necessary to pay attention to the following points:
- there should not be LinearLayout nested with “weigh” parameters in your hierarchy. Measuring such a layout takes two (three, four! - depending on nesting) more time. It is better to replace this construction with GridLayout (or support.v7.GridLayout for API less than 21);
- some LinearLayout can be replaced by RelativeLayout, thereby removing additional investments, for example ;
- it turns out, RelativeLayout is also measured twice. Where possible, it should be replaced with a more “lightweight” FrameLayout.
Example:
After examining our markup, we were horrified to find that it contains up to four (!) Times LinearLayout with the weight parameter, the playing field consists of almost hundreds of RelativeLayout (cells of the field), and some Layout are simply not needed.
(Green indicates the allowed investment, yellow indicates undesirable, orange indicates dangerous, red indicates “never-do-not!”)
After that, we slightly reworked the structure. The “character” was taken out in a separate fragment with RelativeLayout, all nested Linear were replaced with (one!) Support.v7.GridLayout, and all RelativeLayout (not visible on the screen — these are field cells) was replaced with FrameLayout. It turned out both simpatishny and more productive.
However, this did not solve our problems to the end, and we went further.
Step 3. Excess Redrawing (Overdraw)
It turned out that Android carefully draws every picture, every background of every View on the screen. Here he is, of course, well done. But what to do if some images overlap others, the backgrounds are superimposed and some of this drawing becomes absolutely unnecessary? That's right - turn off everything that is not visible and not necessary.
It is very simple to measure the overlay of redrawing: on your device in the Developer Parameters you need to enable “Show GPU excess”, launch the application and look at the screen.
The colors of the View-elements will show how good or bad you are.
Own color - level 0, “perfect”
The blue color is level 1, “normal.
Green color - level 2, „permissible“.
Light red color - level 3, "undesirable."
Red color - level 4+, "God forbid".
Our picture once again plunged us into horror:
We had to go all the way over again and turn off the background where it turned out to be superfluous. Do not forget about the main back of the application - one simple line:
<item name="android:windowBackground">@null</item> In the application theme turned it off. And that's what happened in the end. Maybe not always perfect, but it is quite acceptable. (Almost all of the View has gone down 3 levels!)
Step 4. Caching is the key to success.
It is also quite obvious thing that did not seem obligatory - it is caching. In particular (in this case) font caching.
As you have probably noticed, everywhere, including the logs, your own font is used and, oh (again) horror!, Every time, for each new text it is loaded again from Assets. Every time, Karl! (black is the main sweat, brown is the work of Assesnager).
None of us came across caching before, but here we were rescued by one good person with StackOverflow and suggested simple code:
private static final Hashtable<String, Typeface> cache = new Hashtable<String, Typeface>(); public static Typeface get(Context c, String name) { synchronized (cache) { if (!cache.containsKey(name)) { String path = "fonts/" + name; try { Typeface t = Typeface.createFromAsset(c.getAssets(), path); cache.put(name, t); } catch (Exception e) { e.printStackTrace(); } } return cache.get(name); } } Having applied that, I personally almost completely forgot what lags are.
Step 5. “And this is for dill!”
As in the joke, where the muzhik was told that he would get as much land as he could put on it, he could measure and jump, run, walk, crawl, and at the end, exhausted, he took off his hat and threw as much as he could with the words: dill ", and we sought to optimize performance to the smallest detail.
Therefore, it is time to optimize the code. Of course, then how to write the code is more a matter of correct habit, and here you can only give a few general recommendations (for more details, you can find them in any article on software optimization). This is what our team faced:
- create fewer “unnecessary” cycles. If something can be done without them, do it without them;
- do not create variables in the loop. It is better to create them outside of it, and in the cycle just to update;
- if there is a need to refer to resources repeatedly (using gerResources () or just to another class / array, for example, myList.get (0)) - better write the result into a new variable and use it: int myItem = myList.get (0); - this also gives your application milliseconds of free time;
- if possible, use static methods (if there is no need to refer to the class itself);
- well, the classic way: at the final stage of programming, remove the encapsulation (getters and setters) and access the variable directly.
Summarizing
I am sure that the steps taken are not final and there will always be a “place for dill”, which we did not get to. Always ready to learn about step number 6, 7 ... and even number 157, if you want to share them in the comments. Moreover, for “science” I will be grateful.
In the meantime, summarize what you need to do to start your application to "fly":
1. Measure the performance of your application and find the source of the problem. Maybe it will not be your font, but, for example, a memory leak (turn on Memory Monitor);
2. Optimize the structure and hierarchy of View (we include HierarhyViewer and common sense);
3. We remove all unnecessary backups everywhere, including the background of the application (in this case, please note that in order to display correctly you will still need a common backend);
4. We look at frequently used resources / downloads / images / fonts and cache them;
5. We do software code optimization.
In the end, after all these steps, the image of the application's routing began to look like this:
the delays have almost disappeared (or have become invisible), which is quite convenient for us.
And of course, the first thought that came to my mind after all our optimization: “Wow! Now you can add even more View and Layout to the main screen! “
facepalm, curtain ...
Source: https://habr.com/ru/post/279979/
All Articles