How Big Data is Used to Analyze the Stock Market
In our blog, we repeatedly wrote about software for trading on the exchange of various tools used to analyze the situation on the stock market and create forecasts of possible collapses and price changes ( this material contains all the considered algorithms and tools). One of the most popular analysis tools are various technologies for working with Big Data - for example, Hadoop, NoSQL.
Today we will look at two experiments in which researchers used Big Data to create predictions of movements in the stock market.
')
Forecasting volatility by analyzing investor opinions
Researchers at the Institute of Technology in the Indian city of Coimbatore published a paper on the use of Big Data analysis mechanisms to determine the tonality of public opinion using this data to create forecasts of movements in the stock market.
In particular, messages and reviews that investors and traders left on the websites of stock exchanges and financial organizations were analyzed.
In the process of analysis, it was necessary to collect data, and then select from them markers indicating whether this statement was positive or negative. At the same time, it is necessary to take into account the peculiarities of natural language, which must be taken into account in order to avoid mistakes - for example, the phrase “not bad” is a positive characteristic.
Such a classification can be carried out in various ways - at the level of a document, sentence or phrase. Various machine learning mechanics can also be used for this — for example, algorithms for learning with a “teacher” and without a teacher , which oppose each other.
In the latter case, the analysis of the lexicon is often used to determine the overall tone of the statement — the system searches for words that express opinion (opinion words), for example, adjectives.
In the case of training with a teacher, training samples are used, which contain the input data and the desired result of the analysis. To compare these data, you can use a naive Bais classifier or an algorithm of support vectors.
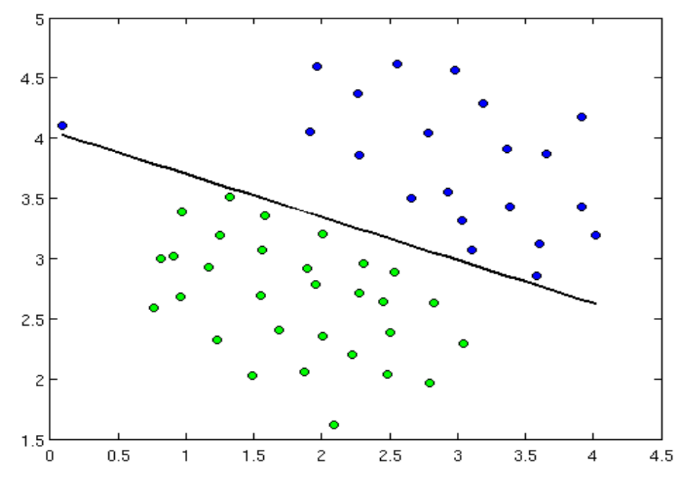
Linear classifier by support vector algorithm
Data on the tonality of investors' statements is also compared with historical data to determine financial volatility — after which you can make predictions about what this value may be in the future. Volatility here means the change in the value of a financial asset over a certain period of time.
For the analysis of time series, models of autoregressive conditional heteroscedasticity (ARCH) are used - they are intended to analyze the process of clustering volatility in financial markets. Which is expressed in the fact that periods of high volatility are replaced by periods of low volatility. At the same time, the average volatility remains relatively stable - all this allows us to predict what kind of volatility can be in the future.
At the same time, the ARCH model assumes the dependence of the conditional variance only on the squares of the past values of the time series. This model was generalized when it was suggested that the conditional variance also depends on the past values of itself - as a result, the GARCH (Generalized ARCH) model appeared.
Scheme of work
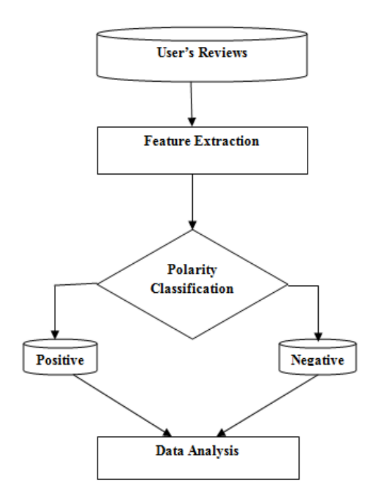
Researchers have developed a system that applies the support vector algorithm to the GARCH model for a predictive analysis of the stock market situation. It works as follows:
- At the beginning of popular financial sites are downloaded analyst reviews, reviews of investors and traders, as well as the logs of their open chats in the bidding process in text format, in addition, the system loads news from the sites of companies whose shares are traded on exchanges;
- With the help of the support vector algorithm, the tonality of statements is determined (experiments have shown that this algorithm makes it possible to create a more accurate classification than in the case of using the Bayesian classifier);
- Also for the same period of time, historical data of the values of the analyzed stock index are loaded - this information is used to calculate the volatility of the GARCH model;
- Based on the data obtained, volatility trends are projected for individual stocks (for smaller companies, the model works better than for large ones).
A system for selecting promising stocks based on Twitter data
Researchers from Imperial College in London, in turn, published a story about creating a tool for analyzing publications in social networks and identifying correlations of these data with trends in the stock market to form a portfolio of promising stocks.
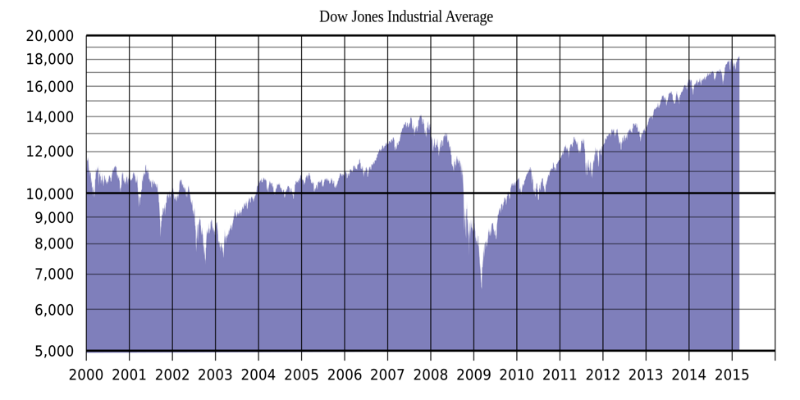
Various studies, including scientists at Stanford University , demonstrate the presence of a correlation between the Dow Johns index and the attitudes of Twitter users:
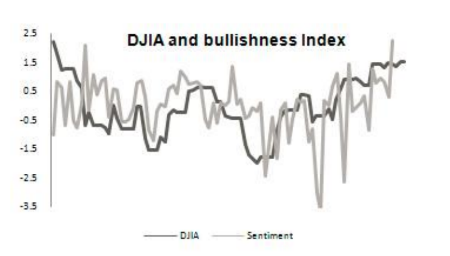
Analysis of this information allows you to generate forecasts for future price movements. English researchers created an application that downloads tweets that are related to companies in the S & P 500 index, launches Hadoop Job to create an aggregate assessment of tonality for each utterance and set of stocks (portfolio), and then ranks a portfolio whose positive tone scores are higher than other's.
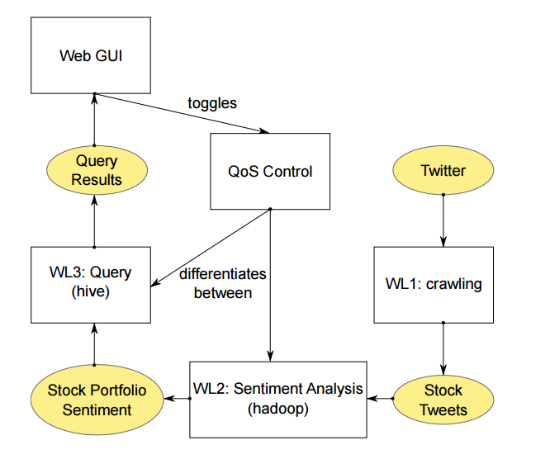
Application architecture
The demo system works in a Hadoop 1.1.2 cluster and IBM GPFS 3.6. Each node is equipped with eight Intel Xeon 2.5 GHz CPU, 8 GB of memory and 250 GB of storage, OS - RedHat Linux.
According to the creators of the application, investors can use it to select the most promising stocks at the moment for trading - this tool is not designed to accurately predict stock prices, but it helps to choose those that can be expected to move in one direction or another.
Other materials on stock pricing prediction in the ITinvest blog:
- Machine learning techniques for predicting stock prices: indicator functions and news analysis
- How to predict a stock price: An adaptive filtering algorithm
- Detection of insider trading: Algorithms for identifying and patterns of illegal transactions
- Machine learning as a method of analyzing the microstructure of the market and its application in high-frequency trading
- Algorithms and trading on the stock exchange: Hiding large transactions and predicting the price of shares
Source: https://habr.com/ru/post/279963/
All Articles