Configuring Visual Studio Code Editor for PHP Development
Hello!
It's time to move from words to actions and get to know Visual Studio Code better. This post presents a phased configuration of VS Code for PHP development.
')
In short, we’ll talk about how:
- Download and install Visual Studio Code .
- Configure statistical code analysis for PHP in user parameters.
- Download and install the PHP Debug extension from the Visual Studio Marketplace portal.
- Configure the PHP Debug extension to use XDebug.
Download and install Visual Studio Code
Visual Studio Code is a free, cross-platform, lightweight code editor from Microsoft. While it will be loaded (there are only 42 megabytes in it), we will take a closer look at each of these properties:
- Free: yes, VS Code is completely free, no small text postscript.
- Cross platform: VS Code for Windows, Linux and OS X versions are available.
- Lightweight: VS Code, unlike Visual Studio, is not a full-featured IDE, but a code editor. It supports a number of powerful features specific to the IDE, such as IntelliSense, debugging, and integration with the Git source control system.
In addition, VS Code is an open source project . You can participate in the development or send problem reports via the repository on GitHub .
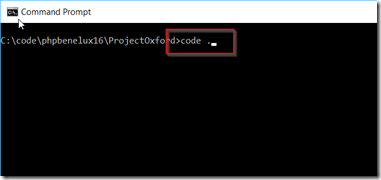
After downloading, install the editor on your computer. Detailed installation instructions are available here . Now you can open a command prompt window, start Visual Studio Code and start editing the files in the folder.
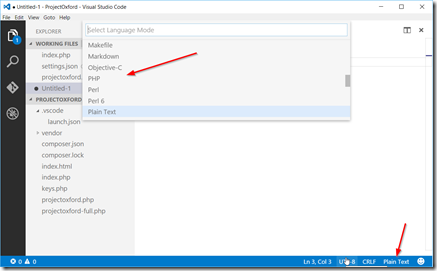
If you open a file with the extension .php, Code will understand that this is a file in PHP. You can also change the file type manually: click the Language Mode button in the lower right corner of the editor window or press the Ctrl + K and M keys in sequence.
PHP built-in functions
VS Code supports many languages , including PHP. VS Code extensions are available on the Visual Studio Marketplace portal to support additional languages. For PHP, syntax highlighting, definition of paired brackets and code snippets work.
When you start typing code in a PHP file, you will notice automatic triggering of syntax coloring, definition of paired brackets and IntelliSense function.

Setting up static PHP analysis
By default, VS Code will perform static code analysis in PHP during the check while saving the file. This is done using the php executable. If you are working with VS Code for the first time, you will receive an error message stating that the executable PHP file was not found.

You must specify the path to the PHP executable file on your computer. To do this, change the settings file (in VS Code there are different levels of settings files, see the documentation for details). In our example, we will configure PHP parameters globally for the user.
Open the user preferences using the command panel: press F1, enter "user" and press Enter.

Two JSON documents will open. The document on the left contains the default settings, and the document on the right contains the user settings. In user settings, you can override the default settings. To enable static analysis of PHP code, you need to change the values of the three parameters.
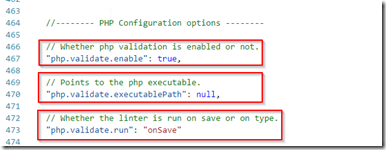
To configure the path to the PHP executable file, specify it in the user settings file:

After this, the validation feature will be enabled for all PHP files. Invalid PHP code will be underlined in red (in the example below, a semicolon is missing).

Debugging setup
The PHP Debug extension (thanks to Felix Becker!) Adds support for the XDebug debugger to VS Code. Install the extension through the VS Code command panel: press F1, enter "install ext", press Enter, enter "PHP Debug" and press Enter again. After installing the extension, you may need to restart VS Code.

Please note: this extension uses the XDebug debugger. Therefore, for his work, you must install XDebug. Download XDebug here (for Windows, choose the 32-bit non-thread-safe version).
Then make the following settings in the php.ini file. I installed XDebug in the ext subdirectory of the PHP installation folder. If you selected a different installation directory for XDebug, make sure that the zend_extension parameter contains the correct value.

Make sure that the root section of the web server matches your project. Then, every time you request a PHP file, XDebug will attempt to connect to port 9000 for debugging.
To start debugging, open the VS Code Debugging tab.
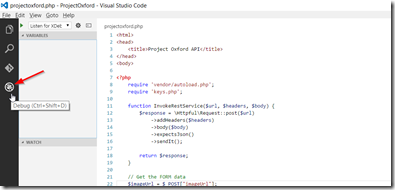
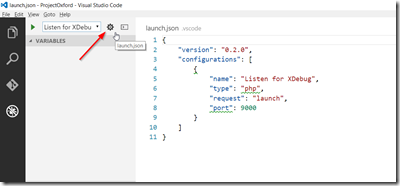
Click the gear icon to form a launch.json file that will allow VS Code to start the XDebug debug session.
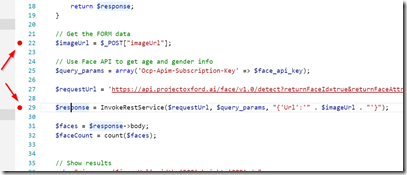
To start debugging, press F5 or click the green arrow on the Debugging tab. To set a breakpoint in the source code, select the line and press F9.
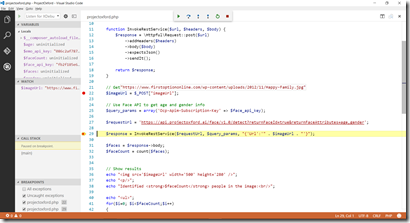
Now, when you open a specific web page, VS Code will stop the execution of the source code at the specified point. Information on variables, call stack, etc. will be displayed in the area on the left.
Conclusion
Visual Studio Code has excellent built-in support for PHP, and the PHP Debug extension adds the ability to debug code in PHP. All of these tools are free and cross-platform.
Other extensions for working with PHP are available on the Visual Studio Marketplace portal.
useful links
- Visual Studio 2015: free offers for developers
- Additional and free tools and services in Visual Studio Dev Essentials
- Laboratory work on the development, testing and management of the life cycle of software for Visual Studio 2015
Source: https://habr.com/ru/post/279947/
All Articles