Habrostatistika, part 2 - refutation with graphs
Yesterday I published an article on the topic of when it is better to publish in the Internet. Since then, my spider has collected statistics for the entire 2015, and the picture has changed a bit. I also built several graphs, and the whole picture became clearer. Caution traffic!
First, we look at the statistics separately for each day:
Designations on the graphs are as follows:
Monday looks like this:
')

Tuesday:

Wednesday:
Thursday:
Friday:

Saturday:

Sunday:

And finally, the most delicious is the hodgepodge of the whole week:

We have to admit that the statistics obtained somewhat contradicts the opinion that I expressed in the first article . Indeed, as some commentators mentioned, it is best to publish on Saturday and Sunday at 5 am, when competition with your article is minimal.
Or not?
And let's look at the samples by the resulting peaks:
For a start - 6 am Saturday.
Result:
Then - on Sunday at 6 in the morning.
Like this. It is pretty obvious that single posts make our statistics. And, although I can’t help but admit that the time of publication still has some influence - it is not worth even thinking about it.
And watching charts is very dangerous. Graphics give false illusions of understanding and incorrect premises. Therefore, it is vitally important to understand what data and for what reason lie under your graphs. Otherwise, everything you build and do will be approximately
First, we look at the statistics separately for each day:
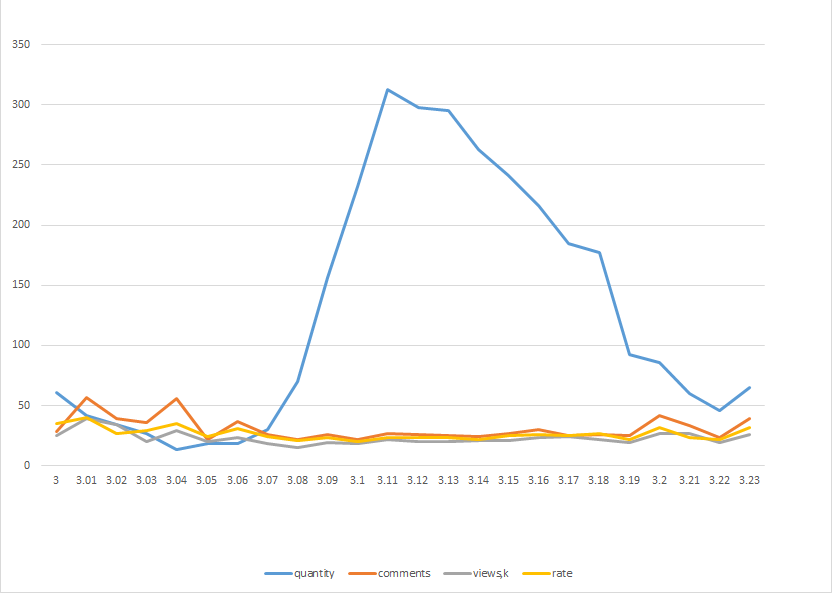
Designations on the graphs are as follows:
- Quantity - the number of articles published at this time.
- Comments - average number of comments left
- Views - the average number of views scored
- Rate - the average typed rating
Monday looks like this:
')
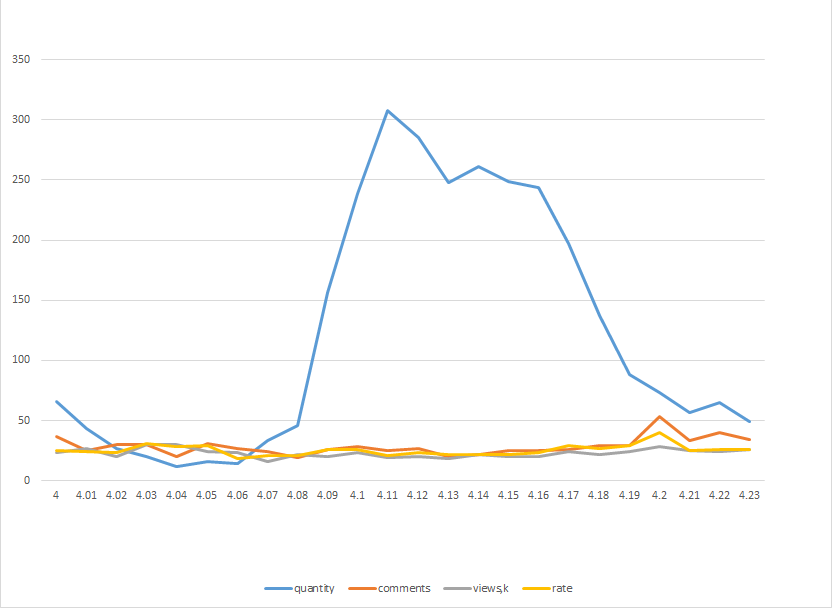
Tuesday:
Wednesday:
Thursday:
Friday:
Saturday:
Sunday:
And finally, the most delicious is the hodgepodge of the whole week:
We have to admit that the statistics obtained somewhat contradicts the opinion that I expressed in the first article . Indeed, as some commentators mentioned, it is best to publish on Saturday and Sunday at 5 am, when competition with your article is minimal.
Or not?
And let's look at the samples by the resulting peaks:
For a start - 6 am Saturday.
SELECT * FROM posts WHERE WEEKDAY(created)+1=6 AND HOUR(created)=6 Result:
| id | created | rate | comments | views |
| 255509 | 2015-04-11 06:28:00 | 50 | 104 | 74000 |
| 250557 | 2015-02-14 06:21:00 | 6 | nineteen | 23,000 |
| 238363 | 2014-09-27 06:14:00 | 63 | 29 | 56000 |
| 233533 | 2014-08-16 06:08:00 | 49 | 95 | 52,000 |
| 228751 | 2014-07-05 06:58:00 | 82 | 70 | 38,000 |
| 223149 | 2014-05-17 06:32:00 | 134 | 89 | 70,000 |
Then - on Sunday at 6 in the morning.
SELECT * FROM posts WHERE WEEKDAY(created)+1=7 AND HOUR(created)=6 | id | created | rate | comments | views |
| 276249 | 2016-01-31 06:05:00 | 73 | 21 | 52,000 |
| 269005 | 2015-10-18 06:03:00 | 34 | 25 | 19,000 |
| 256617 | 2015-04-26 06:14:00 | 56 | 116 | 74000 |
| 253711 | 2015-03-22 06:56:00 | thirty | 25 | 39,000 |
| 246785 | 2015-01-04 06:42:00 | 122 | 113 | 169,000 |
| 238379 | 2014-09-28 06:28:00 | 20 | 33 | 28,000 |
| 232009 | 2014-08-03 06:00:00 | 24 | 20 | 51,000 |
Like this. It is pretty obvious that single posts make our statistics. And, although I can’t help but admit that the time of publication still has some influence - it is not worth even thinking about it.
And watching charts is very dangerous. Graphics give false illusions of understanding and incorrect premises. Therefore, it is vitally important to understand what data and for what reason lie under your graphs. Otherwise, everything you build and do will be approximately
such a foundation.
Source: https://habr.com/ru/post/279769/
All Articles