Analysis of the election results to the State Duma. Getting ready for the 2016 vote
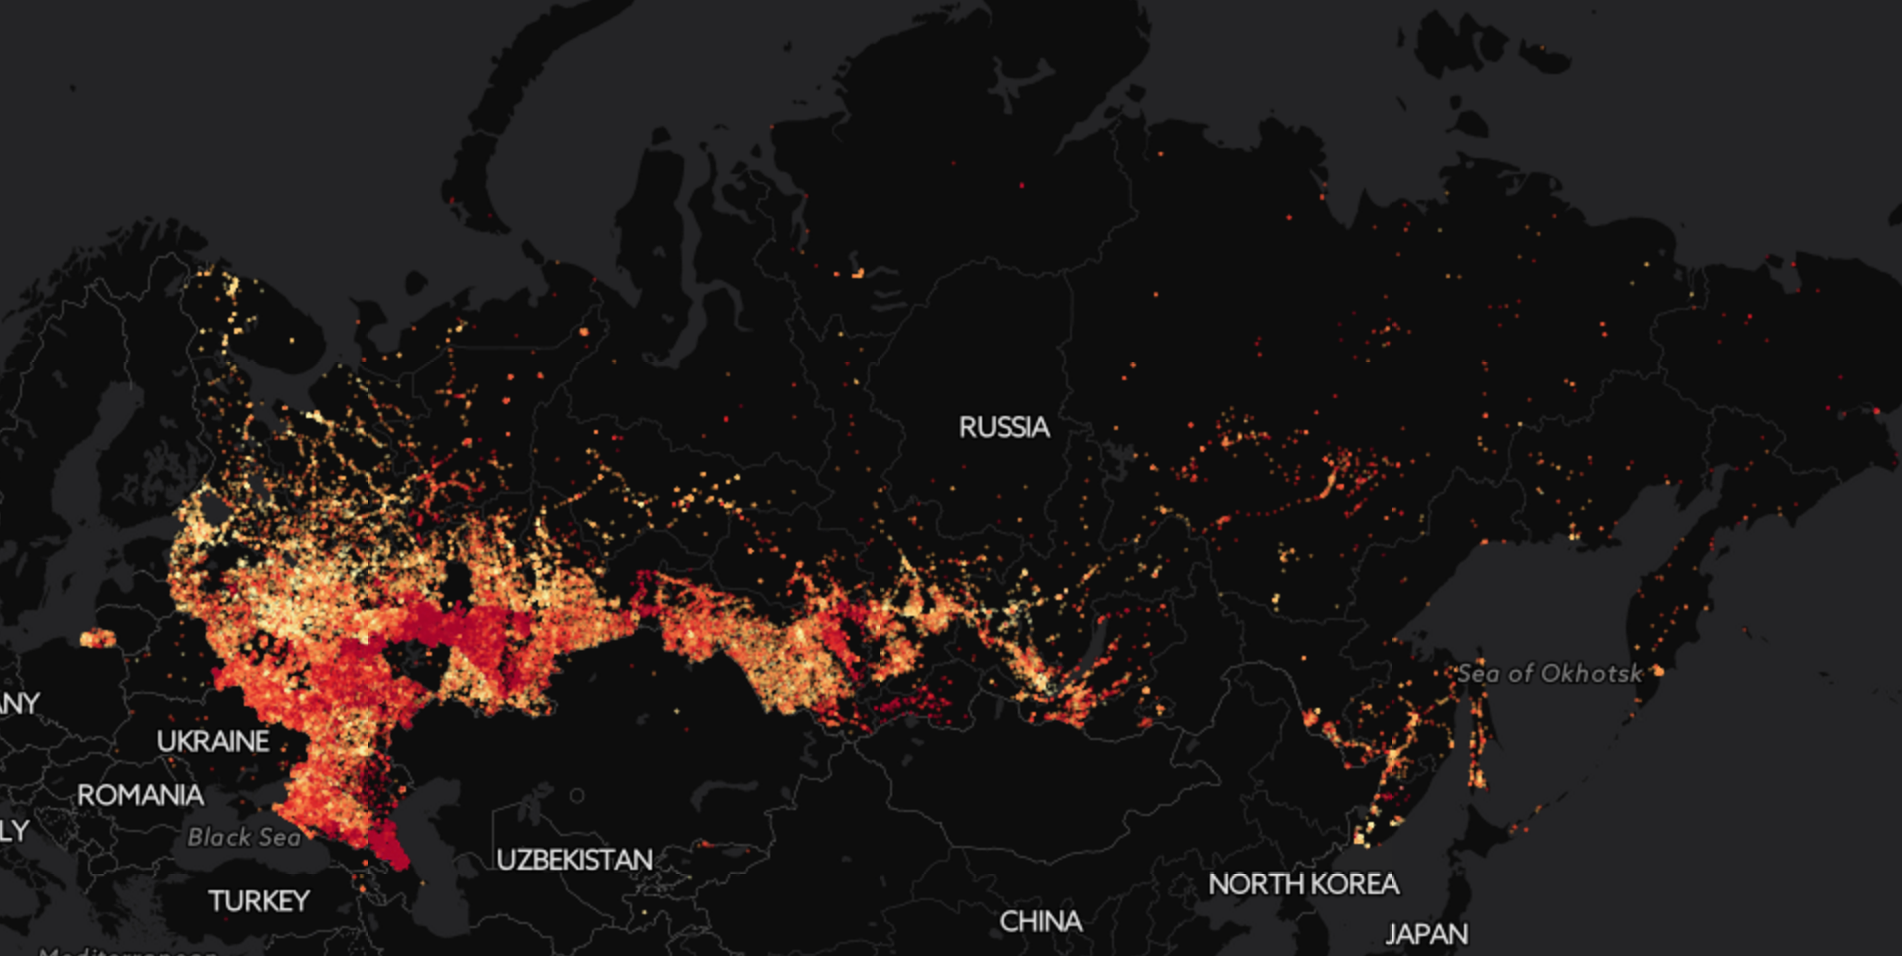
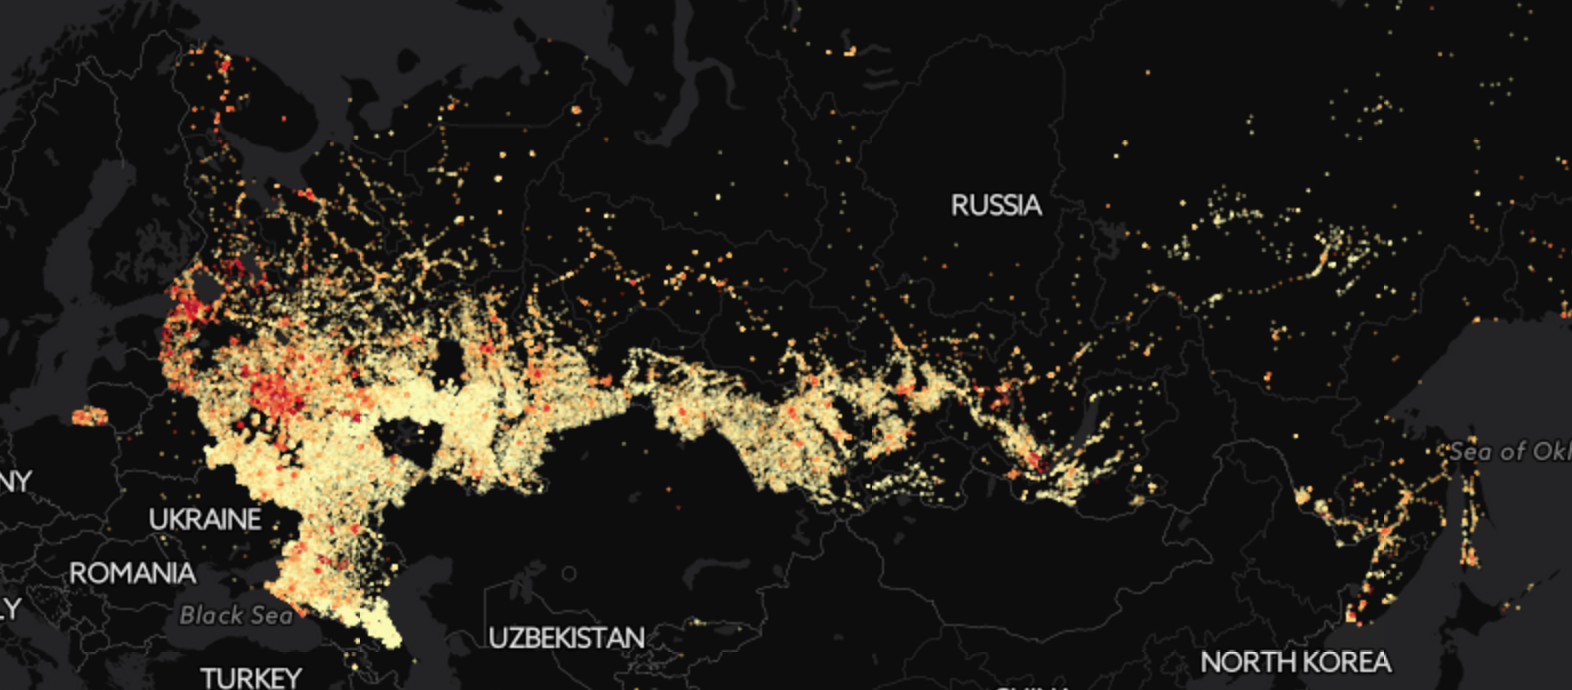
Elections to the State Duma are only in the autumn, but we are already beginning to prepare. If the history of 2011 repeats, it will be very interesting. Probably, many people remember how, immediately after those elections, a bunch of statistical studies appeared, hinting at falsifications and how everyone knew what the Gauss distribution looks like. I would like to tell you where to look for data about the elections and how to work with them. In addition to well-known graphs, I will show some other cool pictures that I have not seen before in public. So, for example, the distribution of votes for United Russia in the country looks like, the regions with the maximum support of the party of power are clearly visible - the North Caucasus and Tatarstan:
There is such a wonderful site izbirkom.ru . He was even mentioned here recently in the context that, like, he spent too much money on him. But personally, I don’t feel sorry for the site:
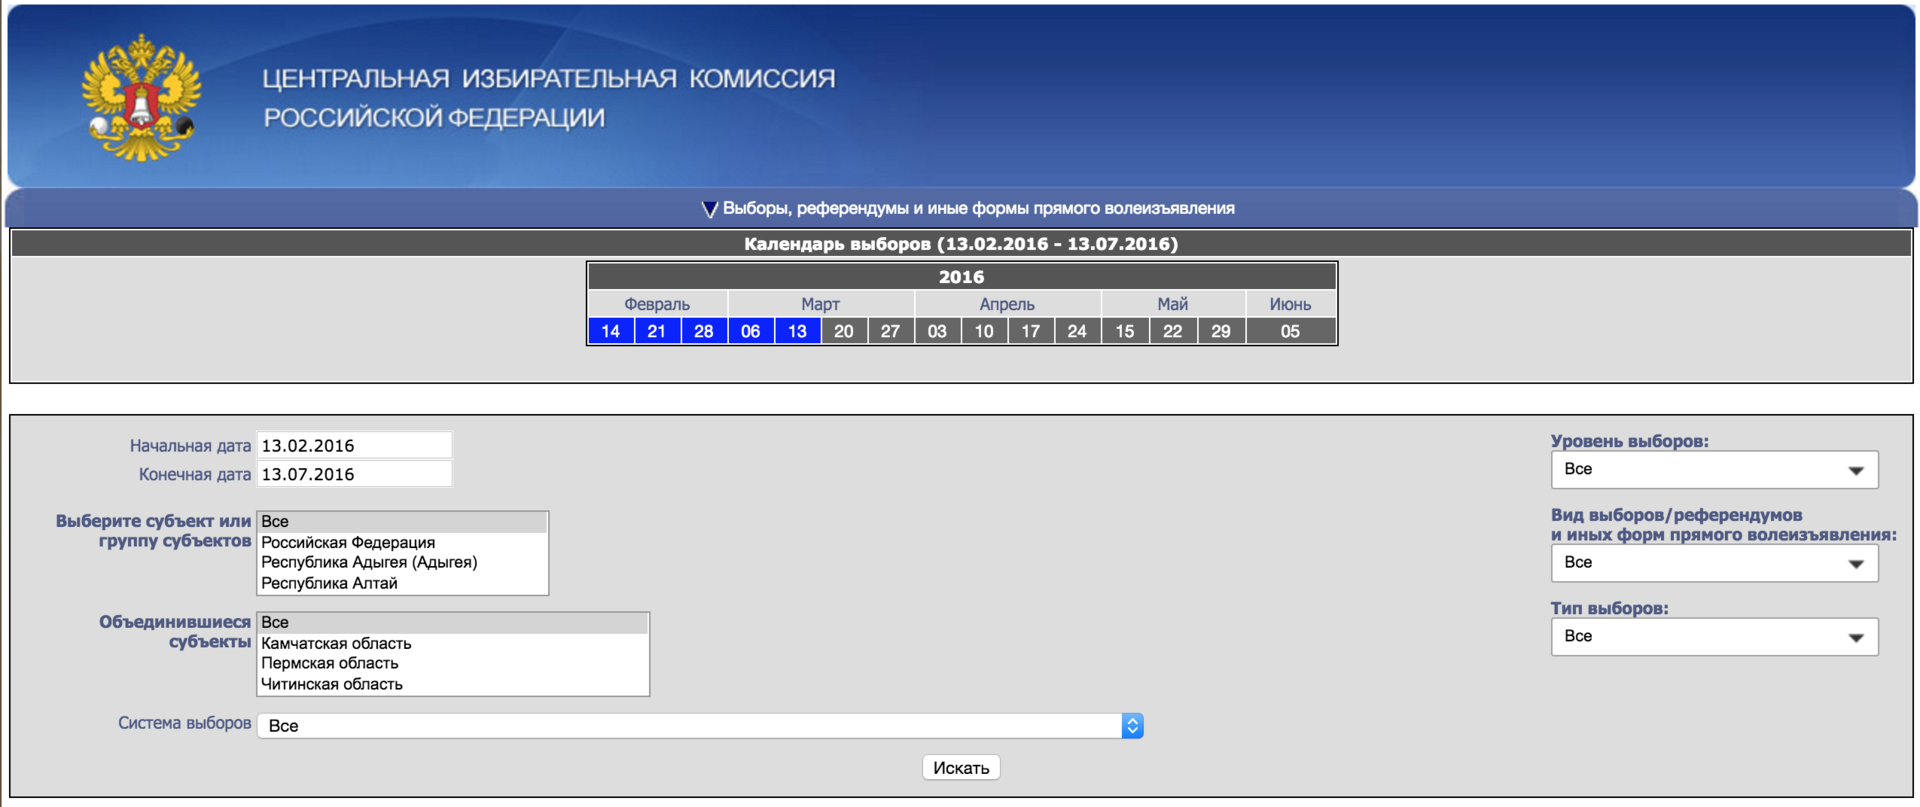
There is an info about all-over elections with details to the PEC. We choose 2011, the level of elections is “federal”, click on “ Elections of deputies of the State Duma of the Federal Assembly of the Russian Federation of the sixth convocation ” and recursively plunge into the “Lower Election Commissions”. A small hack that helps collect data automatically: go to a neatly-shaped url www.kirov.vybory.izbirkomhtf2/430/en/en/32/30ion/kirov?action=ro1=28113304 null & vibid = 100100028713304 & type = 233 and follow the links in the table header until the links end:
But our happiness would be incomplete if for each PEC of our vast country, the Electoral Commission did not publish a detailed description . Telephone, address, members of the election commission - all this can be found on izbirkom.ru broken down by PECs. Moreover, the guys from Gis Lab, periodically pumped this section of the site and put the data in the form of a csv-table .
')
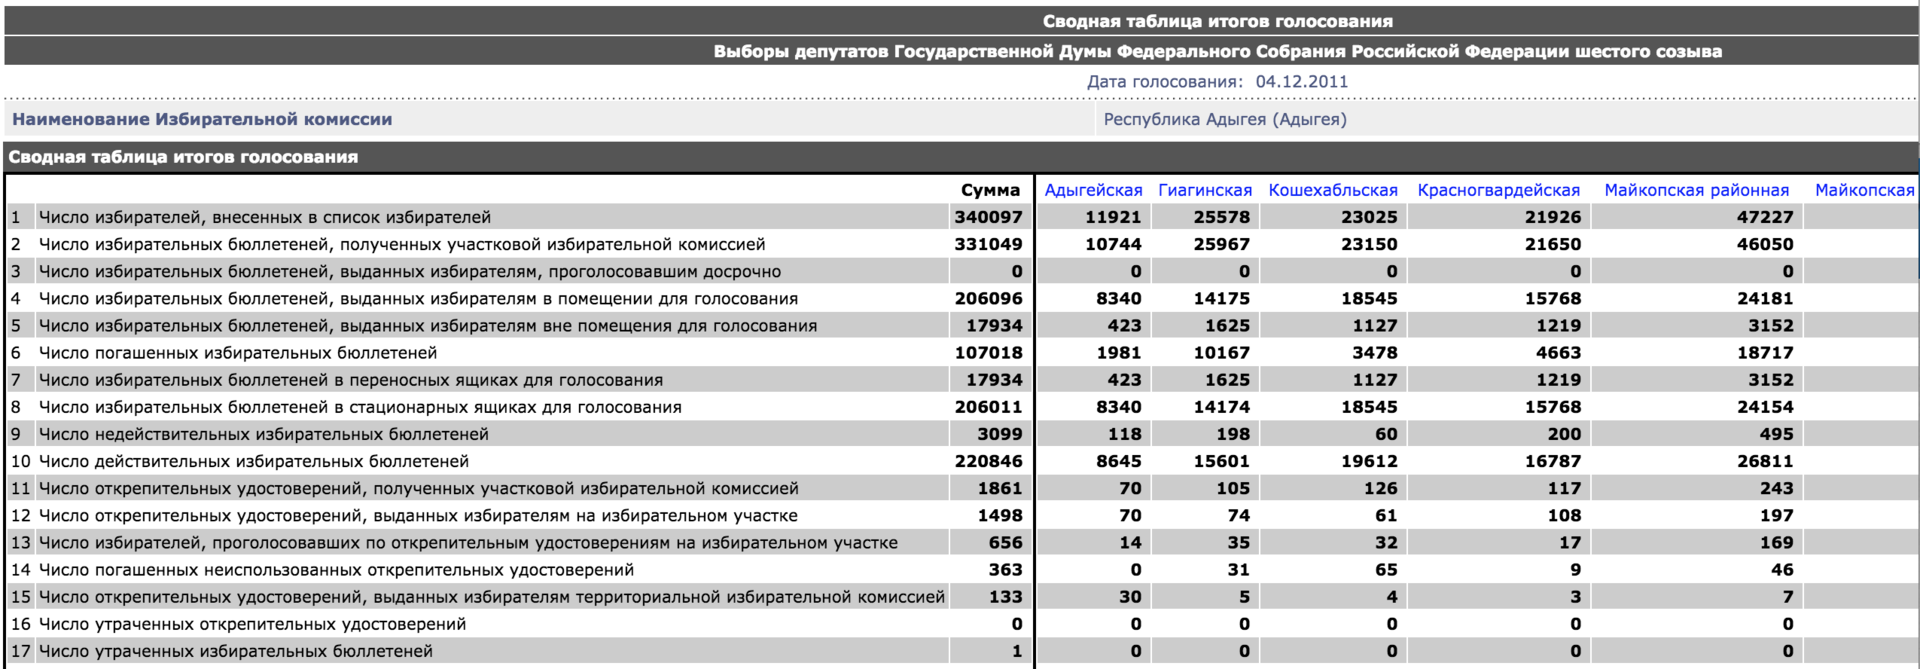
There is only one problem: it is not clear how to combine descriptions of PECs and figures about the results of voting on them. Because, for example, in the section with the results for the Bazarnosyzgansky district of the Ulyanovsk region, the PECs have numbers from 1 to 21, and the section with descriptions from 1101 to 1120. I decided to apply my favorite method here: to score on them. As a result, by the exact coincidence of the name of the region and the PEC number, it was possible to combine approximately 80% of the records, which are as many as 80,000 PECs. You can download them at github.com/alexanderkuk/analyze-izbirkom/blob/master/data/data.csv . There is also the code github.com/alexanderkuk/analyze-izbirkom . The table looks like this (size is the number of people assigned to the PEC, total is the number of ballots, votes is the number of ballots used, and further votes broken down by party):

With this data, it is possible to reproduce classical observations after the elections of 2011. With an increase in turnout, the share of votes for the ruling party grows, and for all the others it falls (dot - PEC):

In Russia, in general, a very unusual distribution of the number of plots by turnout. For some reason, at round values (60%, 70%, 80%), peaks occur, and the maximum is generally 100%. In fact, there should be a normal or log-normal distribution, but not such an interesting curve:

And it cannot be said that high turnout is observed only in small polling stations, it is not uncommon when 90-100% are in the areas to which 1500-2000 people are attributed:

We have the coordinates, so you definitely need to put something on the map. I recently discovered the service CartoDB , I advise everyone. This is what the distribution of votes for United Russia looks like, which I showed at the very beginning (empty spots, such as around Samara, are artifacts of the not perfect process of pasting addresses of PECs with their results):

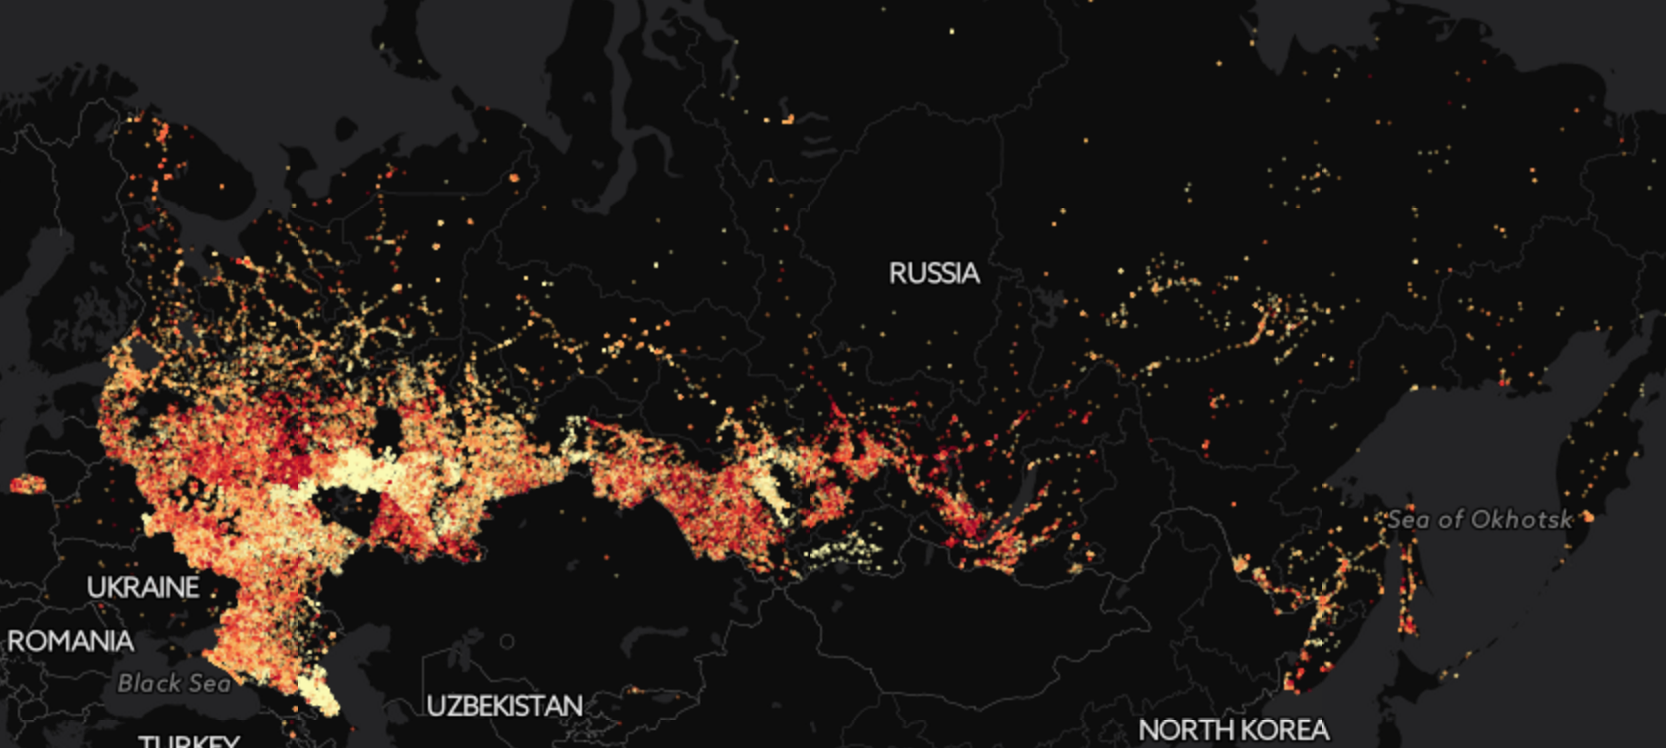
The same for the Communist Party of the Russian Federation (increased support near Nizhny Novgorod and Altai):
Apple has more support in metropolitan areas:
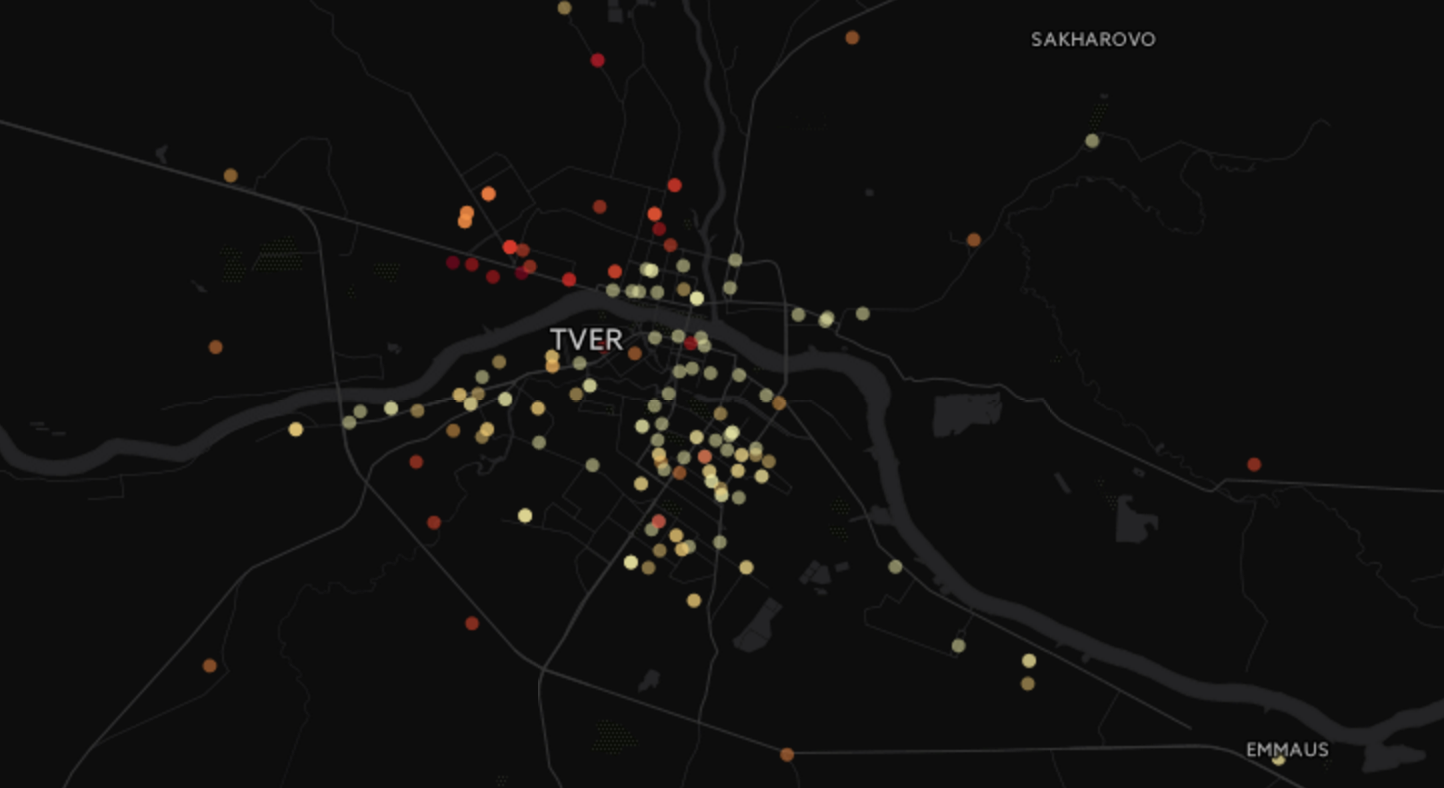
Sometimes it is still interesting to look at individual cities. For example, in Tver, support for United Russia on the left bank of the Volga is clearly higher than on the right:
In general, we are waiting for September 18, in theory, the data should be posted immediately after the counting of votes.
There is such a wonderful site izbirkom.ru . He was even mentioned here recently in the context that, like, he spent too much money on him. But personally, I don’t feel sorry for the site:
There is an info about all-over elections with details to the PEC. We choose 2011, the level of elections is “federal”, click on “ Elections of deputies of the State Duma of the Federal Assembly of the Russian Federation of the sixth convocation ” and recursively plunge into the “Lower Election Commissions”. A small hack that helps collect data automatically: go to a neatly-shaped url www.kirov.vybory.izbirkomhtf2/430/en/en/32/30ion/kirov?action=ro1=28113304 null & vibid = 100100028713304 & type = 233 and follow the links in the table header until the links end:
But our happiness would be incomplete if for each PEC of our vast country, the Electoral Commission did not publish a detailed description . Telephone, address, members of the election commission - all this can be found on izbirkom.ru broken down by PECs. Moreover, the guys from Gis Lab, periodically pumped this section of the site and put the data in the form of a csv-table .
')
There is only one problem: it is not clear how to combine descriptions of PECs and figures about the results of voting on them. Because, for example, in the section with the results for the Bazarnosyzgansky district of the Ulyanovsk region, the PECs have numbers from 1 to 21, and the section with descriptions from 1101 to 1120. I decided to apply my favorite method here: to score on them. As a result, by the exact coincidence of the name of the region and the PEC number, it was possible to combine approximately 80% of the records, which are as many as 80,000 PECs. You can download them at github.com/alexanderkuk/analyze-izbirkom/blob/master/data/data.csv . There is also the code github.com/alexanderkuk/analyze-izbirkom . The table looks like this (size is the number of people assigned to the PEC, total is the number of ballots, votes is the number of ballots used, and further votes broken down by party):
With this data, it is possible to reproduce classical observations after the elections of 2011. With an increase in turnout, the share of votes for the ruling party grows, and for all the others it falls (dot - PEC):
In Russia, in general, a very unusual distribution of the number of plots by turnout. For some reason, at round values (60%, 70%, 80%), peaks occur, and the maximum is generally 100%. In fact, there should be a normal or log-normal distribution, but not such an interesting curve:
And it cannot be said that high turnout is observed only in small polling stations, it is not uncommon when 90-100% are in the areas to which 1500-2000 people are attributed:
We have the coordinates, so you definitely need to put something on the map. I recently discovered the service CartoDB , I advise everyone. This is what the distribution of votes for United Russia looks like, which I showed at the very beginning (empty spots, such as around Samara, are artifacts of the not perfect process of pasting addresses of PECs with their results):
The same for the Communist Party of the Russian Federation (increased support near Nizhny Novgorod and Altai):
Apple has more support in metropolitan areas:
Sometimes it is still interesting to look at individual cities. For example, in Tver, support for United Russia on the left bank of the Volga is clearly higher than on the right:
In general, we are waiting for September 18, in theory, the data should be posted immediately after the counting of votes.
Source: https://habr.com/ru/post/279157/
All Articles