Release Webix 3.2. New widgets for working with data and other features

Following the tradition of releasing new versions of the library with an enviable consistency, Webix developers have announced the release of a regular spring release, this time number 3.2 . Among the innovations in this version, two new widgets were seen: SpreadSheet , which, as the name implies, serves to create extra-like tables, and RangeChart , which allows you to select a specific portion of a large chart for display. In addition, new features have been added, allowing to expand the functionality of existing components.
But first things first.
')
SpreadSheet Widget
In order to use this widget, in addition to the js and css files necessary for Webix to work, you need to add the files required to work directly with SpreadSheet.
Here's how to do it:
<script src="codebase/webix.js"></script> <link rel="stylesheet" href="codebase/webix.css"> <script src="codebase/spreadsheet.js"></script> <link rel="stylesheet" href="codebase/spreadsheet.css"> After that you can create a widget. Here is the minimum amount of code required for this:
webix.ready(function(){ webix.ui({ view:"spreadsheet" }); }); You can see the result in the screenshot:
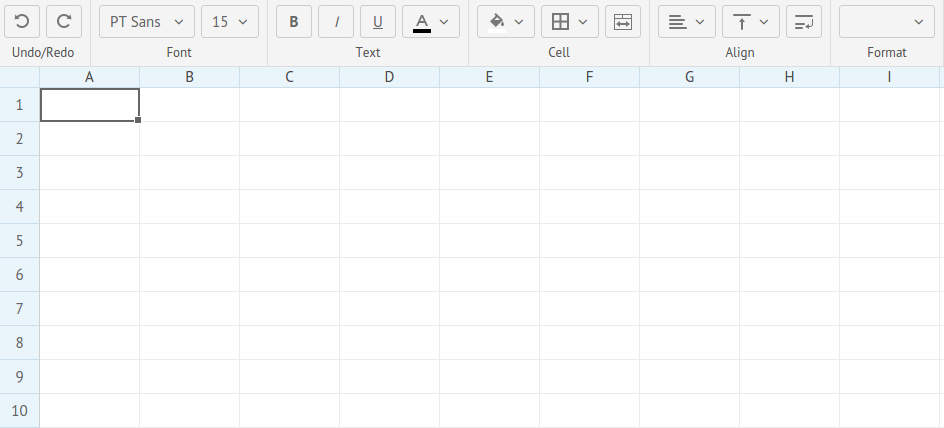
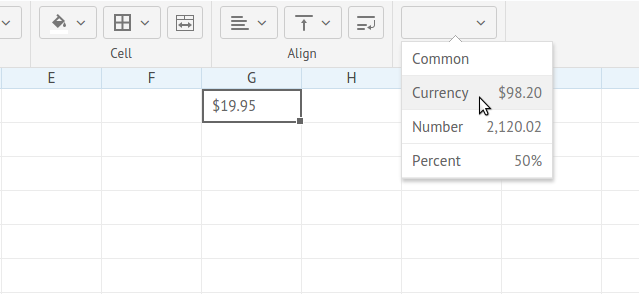
Nothing unusual, if you had at least some experience with office suites. You can format the font, adjust the cells and select the format of the displayed data: Common , Currency , Number and Percent :
It was a bit strange that by default, mathematical formulas do not work. To enable them, you need to use a separate property. We will almost certainly need the formulas, so let's look at other available properties at the same time:
view:"spreadsheet", /* */ resizeCell:true, /* */ math: true, /* */ columnCount:10, rowCount:20, /* */ data: base_data It is also possible to enable
readonly:true mode using readonly:true and adding new fields to the toolbar. For example, you can add a text field to more easily edit formulas: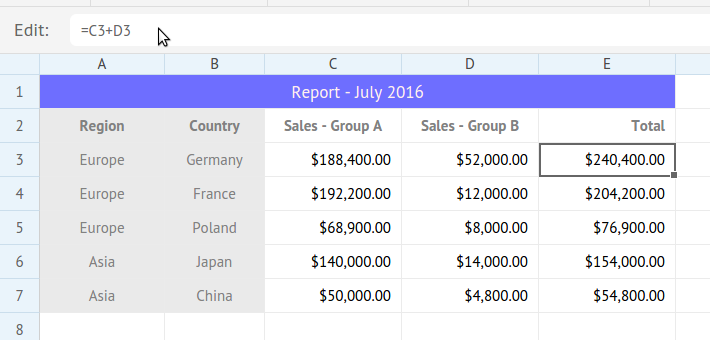
Table data is stored in JSON format. In addition to loading and saving data, there is the possibility of exporting to Excel, PDF and PNG formats. You can also import data from an Excel file.
The widget can be customized at its discretion. It is possible to configure the toolbar, in which you can add your own panels and buttons. You can add your own context menu to the table, it is possible to localize and process events.
The API guide, demos and widget overview can be found on the documentation page .
The download page offers to download the widget separately or as part of an enterprise package.
RangeChart Widget
This widget will be useful when plotting graphs based on a large amount of data. For example, you have a certain sample for a long period of time and you want to display it as a graph with the ability to select the desired interval. It is best to consider a small example.
Suppose we have an array of
data that stores sales data for a certain period. Here is how we could build a graph: /* line */ view:"chart", id:"dchart", type:"line", /* */ data: data, value:"#sales#", xAxis:{ template:"#time#" }, yAxis:{}, item:{ borderColor: "#1293f8", color: "#ffffff" } Since there is a lot of data, you end up with something like this:
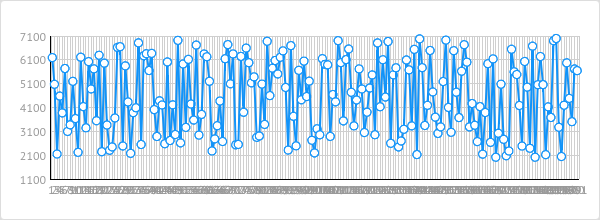
There is no benefit from such a schedule. And this is where RangeChart comes to the rescue. It controls what is displayed on the graph, which means that the code given above does not need to be thrown away. You can only remove the
data: data string from it, because now RangeChart will extract the data.You can add it to the page like this:
webix.ui({ rows:[ { view:"chart", id:"dchart", /* - */ }, { /* */ view:"rangechart", height: 80, id:"range", type:"line", value:"#sales#", padding:0, item: { radius :0 }, data: data, /* RangeChart*/ frameId:"time", range:{ start:30, end:50 } /* RangeChart */ on: { onAfterRangeChange:function(){ $$("dchart").clearAll(); $$("dchart").parse(this.getFrameData()); } }, } ] }); RangeChart properties do not differ much from those of all other charts. What you should pay attention to is the
frameId property, which determines which parameter from the data array the RangeChart will control (in this case, change the time scale), and the range property that determines the range of the selected data. The on property allows you to add a handler to the component. In this case, with changes in RangeChart, we first clear the graph using its id , and then draw the new data. Here is what we got in the end: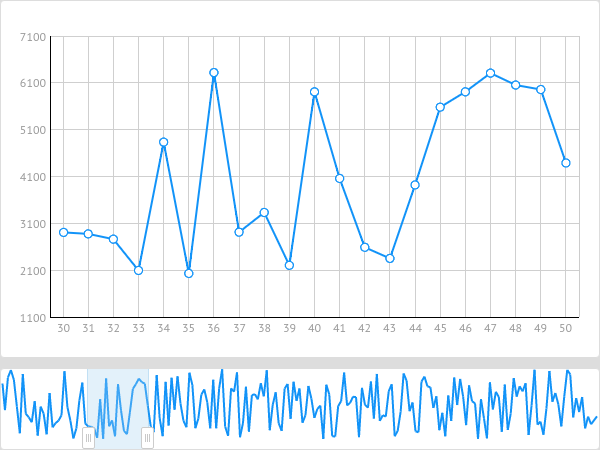
You can move the frame and scale it to view different parts of the original graph. You can play with the code on this page .
RangeChart can be used with any Webix charts that are horizontal. You can learn more about how to use it and see the demos on the documentation page .
Other utilities: Undo, export to PDF, areaselect property for data widgets
Now let's talk about the new features that have appeared in the latest version of the library.
Undo for data components
The
undo property is available for all data components and allows you to undo the changes in case the server returned an error message.You can consider how all this works on a simple example, in which there is a button that cancels the changes made to the list:
webix.ui({ /* : */ rows:[ { view: "editlist", id: "myList", undo: true, /* ... */ }, { view:"button", value:"Undo", click:function(){ $$("myList").undo(); } } ] }); Enjoy the result here .
As you noticed, in addition to the
undo: true property, we also used the undo() method. There are only three methods for using the described functionality:undo()undo component changes. Calling this method only cancels the most recent change. If you want to discard all changes and return the component to its original state, you need to pass the value of theidproperty of this element to the method.removeUndo()removes the change history of a component. As parameter acceptsidignoreUndo()takes as a parameter a function that will be ignored when undoing changes usingundo().
A documentation page with more detailed description is available here .
Export to PDF
You can now use the
toPDF() method to export data from a data widget to a PDF file.For example, we have a List component and we want to add an export button. The code will look something like this:
webix.ui({ rows:[ { view:"list", id:"myList", /* ... */ }, { view:"button", value:"Export to PDF", click:function(){ webix.toPDF($$("myList")); } } ] }); If we want to export not the entire table, but only some columns:
click:function(){ webix.toPDF($$("myList"),{ columns:{ "title": true, "rank":true } }); } You can also set your own headers, field widths, a template for the exported file, etc.
A more detailed description of this function with examples can be found on the documentation page .
You can try in here .
Areaselect property
So, the last significant innovation. The
areaselect property areaselect available for the DataTable and TreeTable components . It includes the ability to select a group of cells in Excel style and migrated to these widgets from the already known SpreadSheet. It can be combined with the multiselect property, which, as the name implies, allows you to select several areas.Everything works quite simply:
webix.ui({ view:"datatable", /* ... */ areaselect:true, multiselect: true, }); You can see what came of it on this page .
Four methods are also available that allow you to work with the selected area:
addSelectArea()allows you to add a selected area. The three required parameters define the upper left and right lower elements of the table, as well as whether the previous selection will be deleted. You can also set a name for the selected area, so that you can, for example, delete or modify the selected data, use CSS to design the frame, etc.removeSelectArea()removes the selected area. You can pass the name of a specific region as a parameter.getSelectArea()returns the selected object. Again, you can use the name of the highlighted area.getAllSelectAreas()should be used if you specified themultiselect: trueproperty. In this case, you can get all selected areas at once.
You can read in detail about how this feature works, as well as see sample code on the documentation page .
Final word
Developers release new releases on a regular basis, while not limited to only bug fixes, which, by the way, were also quite a few in this release. New features will seem interesting to someone, but not to others. Some of them are available for everyone, and some are only for secured gentlemen in the PRO version. In any case, it is useful to pay attention to the new features of this library.
Source: https://habr.com/ru/post/278997/
All Articles