Capture and visualize! Or a histogram from a microphone using Web Audio API
I really like live graphics. Deadly boredom - look at static pictures with numbers. I want the chart to fascinate, to force a person who is looking at him to interact and discover new facets of all the data on him. Therefore, any example that falls into my hands, and any visualization library that was not lucky enough to be on my machine, passes the “revitalization” test. So once again, wondering how else I can raskoryachit visualization widgets from the DevExtreme library, I thought about displaying sound. “Interesting and lively” - I thought that day, I stocked up tea with cookies and sat down for this task. What I finally got done - you will find out under the cut.
The first thing I had to choose was what kind of sound to visualize. Just the melody seemed too banal, besides, I found a wonderful article on Habré that fully describes the whole process from creating sound to rendering on Canvas. But, after reading the comments on this article, I noticed a certain interest in capturing audio from a microphone. Having poked Google for the presence of such articles, I found out that there are not many of them on this topic. A goal appeared - a plan of action appeared:

')
Capture audio from a microphone . One of the easiest ways to get data from the microphone in the browser is to use the getUserMedia method, which is in the object of the public browser methods - in the navigator. He takes three arguments:
- Audio and video capture settings:
{ audio: true/false, video: true/false } - Successful function
- Function executing in case of error
That is, in general, the call to this method looks like this:
navigator.getUserMedia( { audio: true, video: true }, function (stream) { //stream processing }, function (error) { //error processing } ); But! It must be remembered that the method in different browsers is different, so it will not be superfluous to call the next thing before calling getUserMedia, and to provide support for the method in all common browsers:
navigator.getUserMedia = (navigator.getUserMedia || navigator.webkitGetUserMedia || navigator.mozGetUserMedia || navigator.msGetUserMedia); Analysis of captured audio . If the getUserMedia method executes successfully, we get an object of type MediaStream, which can already be used to create an audio source using the Web Audio API. But to use this method, first you need to create AudioContext - our guide to the world of Web Audio API. The creation is very simple:
var ctx = new AudioContext(); Again, do not forget about cross-browser compatibility:
var AudioContext = window.AudioContext || window.webkitAudioContext; Now, using the ctx audio context, it is possible to create all the necessary elements for analyzing our sound. What are these elements?

The Destination element is available to us by default, after the creation of the audio context. In fact, this is where our sound will go, and using the ctx.destination construct gives us access to the standard sound output for the system, for example, speakers or headphones. The remaining elements from this scheme need to be created and configured.
- Source is the sound source, our captured audio from the microphone. It is only necessary to convert the MediaStream stream into an element with which we can work, and the createMediaStreamSource context audio method is suitable for this:
var source = ctx.createMediaStreamSource(stream); - An analyzer is a node for analyzing audio; many parameters of sound can be drawn precisely with its help. It is created by the createAnalyser simple audio context method:
var analyser = ctx.createAnalyser(); - ScriptProcessor is an audio processing module. It is necessary to track the moment of sound change using the onaudioprocess event. You can create it using the createScriptProcessor audio context method with buffer size parameters, number of inputs and outputs:
var processor = ctx.createScriptProcessor(2048, 1, 1);
source.connect(analyser); source.connect(processor); analyser.connect(ctx.destination); processor.connect(ctx.destination); When you run all this code ( here's an example ) and with a little bit of luck you can hear the sound from the microphone from the speakers / headphones. Listening to your voice is very annoying, so with a clear conscience you can not create connections of the analyzer with the audio output, this will not affect the final result. The final scheme of work will look like this:

The final touches - the analysis of sound brick by brick. For the analyzer it is possible to set the dimension of the Fourier transform - the option fftSize. Why did she give up? And then, that in the end we get the number of data elements equal to fftSize / 2, that is, the number of points for the chart:
analyser.fftSize = 128; It remains only to receive data on the frequencies of sound from the analyzer, storing them in a specially created for this variable data. The change in sound is tracked thanks to the onaudioprocess event already familiar to us:
var data = new Uint8Array(analyser.frequencyBinCount); processor.onaudioprocess = function (){ analyser.getByteFrequencyData(data); console.log(data); } Ta-dam! And here they are, treasured tsiferki from a microphone in the console ( example ):

Visualization of the data . Directly the “animating” part, turning tsiferok into a graph, for which the DevExtreme library is needed . First of all, of course, you need to create a schedule:
<div id="chart" style="width: 800px; height: 250px"></div> var chart = chart = $("#chart").dxChart({ //chart options }).dxChart("instance"); Such a created chart will be empty, because data is needed for it - the dataSource option, and the series that needs to be displayed is the series option. At the same time, the data is dynamic and needs to be changed when the onaudioprocess event is triggered:
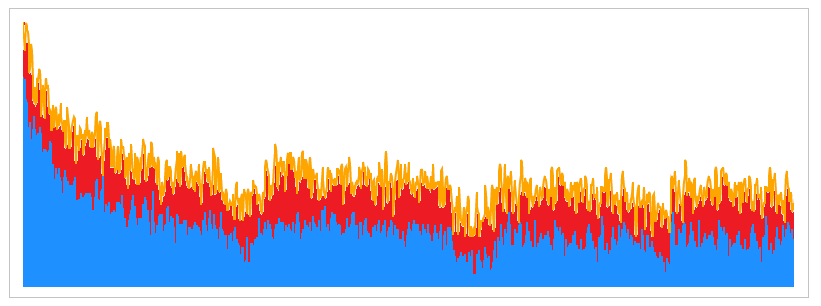
var dataSource = $.map(data, function (item, index) { return { arg: index, val: item }; }); chart.option("dataSource", dataSource); Adding a couple of settings for graphics, color type and type of series, you can end up with just such a wonderful thing:
And the final code will look like this, simply and concisely:
Summary code
navigator.getUserMedia = (navigator.getUserMedia || navigator.webkitGetUserMedia || navigator.mozGetUserMedia || navigator.msGetUserMedia); navigator.getUserMedia( { audio: true, video: false }, function (stream) { var AudioContext = window.AudioContext || window.webkitAudioContext, ctx = new AudioContext(), source = ctx.createMediaStreamSource(stream), analyser = ctx.createAnalyser(), processor = ctx.createScriptProcessor(2048, 1, 1), data, chart, dataSource; source.connect(analyser); source.connect(processor); //analyser.connect(ctx.destination); processor.connect(ctx.destination); chart = $("#chart").dxChart({ dataSource: [], legend: { visible: false }, argumentAxis: { label: { visible: false } }, valueAxis: { grid: { visible: false }, label: { visible: false } }, series: { hoverMode: "none", type: "bar", color: "#1E90FF" } }).dxChart("instance"); data = new Uint8Array(analyser.frequencyBinCount); processor.onaudioprocess = function (){ analyser.getByteFrequencyData(data); dataSource = $.map(data, function (item, index) { return { arg: index, val: item }; }); chart.option("dataSource", dataSource); } }, function (error) { //error processing } ); Here you can find a ready-made example . If desired, you can collect an example locally, or even replace the visualization with any other one you like. The main thing is how quickly and simply a similar example is collected using the Web Audio API and the DevExtreme library.
As always, I am waiting for your comments and suggestions in the comments to the article. Have a nice day, everyone!
Source: https://habr.com/ru/post/278823/
All Articles