Lessons from participation in the Dota Science hackathon in the framework of Data Fest 2
6 days ago around midnight, we, the EC.Dota2 team of four people ( ivankomarov , kolyanzzz , Sergei_Smetanin , AzZzone ), began working on the online part of the Dota Science hackathon . None of us knew anything about the game Dota2.
First, chronologically, about the first, “online” part. There is a grid of world finals of the game “The Shanghai Major 2016”. It is necessary to predict its outcome before the match. As time has shown (but not a description of the competition), it was necessary to predict the matches for March 3, 4, 5. For training were given historical data about the matches in Dota2 for different past tournaments with aggregated information about each match. From Wednesday I had to start getting enough sleep, because all day work. Two models were developed for the online stage.
The following metric was used as an indicator of forecast quality: score = log2 (p_winner) +1, where p_winner is the predicted probability of winning the team that won as a result.
')

Here it is worth saying a few words about the goals of the hackathon. The purpose of the formal - to get the highest relative to other assessment of the quality of forecasts. The goal of Data Fest is to build the best, relative to others, model for predicting the outcome of a match using machine learning methods.
One Data Fest 2 speaker on the last day ( Nuker ?) Correctly noted that “the problem of machine learning can always be solved without machine learning” (with its own neural networks in the head). Who used models, who used expert experience, who just played by chance? Unknown.
The final assessment of the first stage is the average of all values of the quality metric for the predicted probabilities. As the tournament table of the first stage of the Hakaton shows, the number of predictions per “team” varied by 10–20 times. As we know, the missing data can, of course, be replaced by something, but here the key question is whether the person deliberately concluded that the probability is 0.5 or just overslept the moment of sending the forecast? Probably overslept, just not sent. Therefore, it would be better to simply not consider the commands in the table with the number of predictions less than, say, 10, because too little information to evaluate the team model. And the best strategy of the game in the final assessment is to make a good prediction and no longer play (send 0.5), which, of course, does not correspond to the meaning of Data Fest.
Model online part number 1 "Nikolay" (machine learning). The SVM algorithm predicts the victory of the first team in terms of the shares of the victories of the first team in all matches for the last 1, 2, ..., 12 months + the same for the second team. When creating a model, an algorithm was selected and insignificant features were screened out.
The feature set was selected as follows. The share of team wins in previous matches is an indicator of team mastery. Mastery can change over time, so it is important to consider dynamics. Initially, we wanted to use the team wins for individual months, but there were too many gaps in the data. Therefore, we moved to shares in the past few months. Among the signs was the share of victories of the first team in all matches against the second team, but the importance of this sign turned out to be very low (presumably due to the large number of passes), so we eliminated this sign.
There was also an idea to take into account the skill of the teams that were defeated by the first or the second team when calculating their skills, since a victory over a strong team should make a greater contribution to the skill index than a victory over a weak one. However, there was no time to implement the idea.
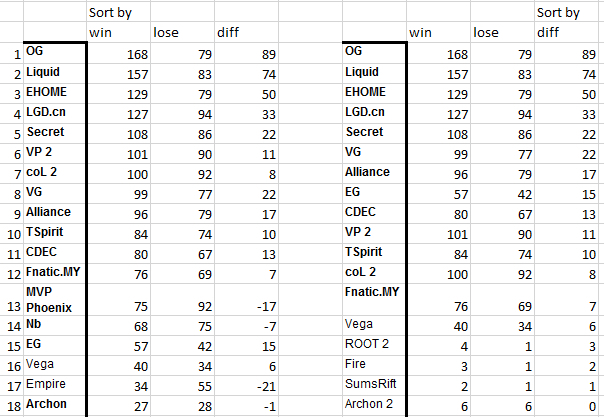
Model online part number 2 "Sergey Smetanin" (assumptions + data analysis). We decided to consider matches only from 07/01/2015. After analyzing the table of victories / losses / difference of victories and losses, we saw that sorting by victories most precisely groups the teams of the tournament “The Shanghai Major 2016”:
Accordingly, as ad hoc, the probabilities of victory for the first team used a sum with identical weights of 0.5 two sizes:
1) The ratio of the number of victories of the first team to the total number of victories of the first and second teams in all matches from 07/01/2015;
2) The ratio of the number of victories of the first team to the total number of victories of the first and second teams in matches only between the first and second teams from 07/01/2015.
Why? Repeated from such assumptions:
- teams and experience have greatly changed over time, so we will take only the latest information. What is fresh? We do not know. For example, 07/01/2015.
- the table of teams shows that victories most accurately group the teams “The Shanghai Major”. We will work with winnings.
- it is probably important that the game was between two teams of interest. We make a sign only for such matches. (However, after the matches, the recalculation showed that it is better not to take this sign. Partly, therefore, we took into account all the teams in the second part of the hackathon.)
- we look at the historical strength of the teams.
- the force measured by the winnings already has all the information about the choice of strategy, players, etc. Therefore, while we dwell on it.
Model results:
At first, Model 2 was in the lead, but the human factor played a role - they made a mistake when sending, one prediction was lost with probability 1. From the first place on March 3, they quickly gave up the palm of a steady “Nikolay”, which would win 4th place of 42 at the end of the online part, if we consider at least 10 matches.
Offline part officially began on March 5 at 20:00. For building models, data was provided (at 0:30) on the course of matches of the tournament (the state of the game at different points in time during the match). At 1:30 we received the latest missing information about who won in these matches. By the beginning of the first match of the final (the match before the grand final) at 5:30 the model was ready.
Input for model:
- by player: xp_per_min, gold, net_worth, respawn_timer
- by command: tower_state, barracks_state
- for the match: duration
Target variable: Radiant probability of winning
Selected Model: Logistic Regression
Selected predictors: team experience (xp), team total cost (net worth), experience ratio and team total cost (Radiant to Dire), respawn_timer (by heroes), level (by heroes), respawn_timer * level (by heroes).
Training sample: data on the progress of all matches Shanghai Major 2016.
Note : respawn_timer - the time until the revival of the killed hero.
We took the product respawn_timer and level, because we assumed that the higher the level of the hero who temporarily left the game, the worse the team’s chances of winning.
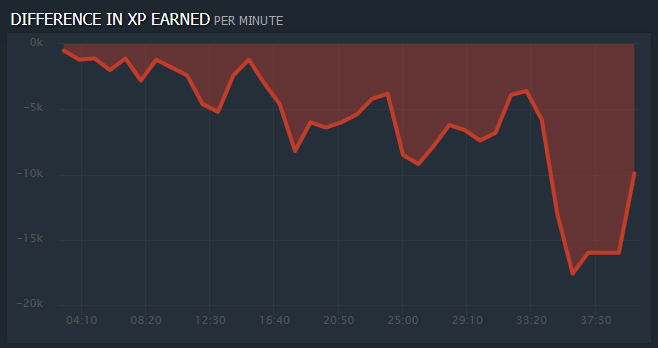
Since there were some doubts about the reliability of the model, we also displayed a graph of the difference in the experience of the teams in real time, so that if the chart shows who wins, and the model gives cautious predictions of about 0.5, send probabilities higher.
The final surprised many when they defeated Liquid in a match against EG, with a negative difference in experience throughout the match (see chart). EG was the favorite of our first Dota2 consultant.
There are rare strategies that work in this way, the second of two (sided) consultants, who played Dota1 professionally at the level of the Russian Championship, explained to us. This did not fit into our logic of feature selection, since we were confident that excellence in experience was one of the most decisive factors for winning. The first consultant (young enthusiast Dota2) was shocked by what he saw.
Probably, such a deviation could be seen from the state of the towers, but such a strategy seems to be so rare that it is not clear how to identify it with machine learning methods without having experience playing Dota2. Adding signs related to the state of the towers and barracks worsened the quality of the model on our test sample.

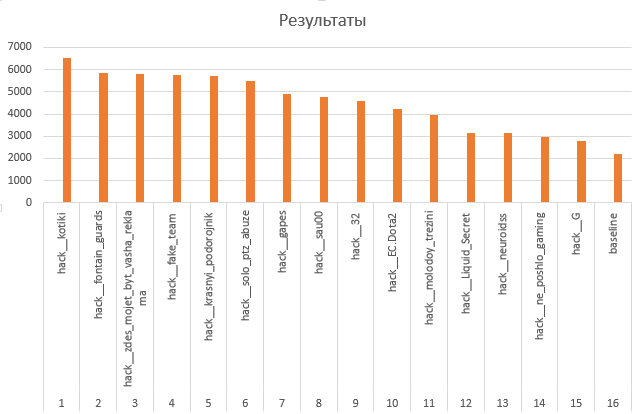
The graph shows the importance of signs. There are many interesting things here, for example, we are surprised that the level of the first hero R turned out to be significantly less important than the level of the second hero R.
We approached the grand final, not too believing in the strength of our model. The two who made the model and the script for drawing the difference graph in the experience of the teams in real time went to sleep, the two remained to send the model results for evaluation and, in general, “act according to the situation”.
We also thought about the strategy of sending probabilities, taking into account the model evaluation at the end of the match. Probably, the advantage can be obtained by starting as early as possible to predict the highest probabilities. We thought that we would not make such a strategy: we send 0.5 until we “see” the team’s victory and then we send 1. Looking ahead, we can say that many have used this strategy or its variants. It would be interesting to investigate in more detail the question of the optimal strategy, but there was no time.
And ... the final has begun! We watched the game for the first time in our life. The model suddenly ... fell. The schedule went anyway, and we played on it, deciding to systematically increase the deviation of the sent probability from 0.5 in three game periods: start (10 min) ± 0.05, middle (20) ± 0.25, final (20+) ± 0.49.
It was possible to send probabilities during the selection of heroes. One could come up with another model, but decided to just send nothing.
We played for 15th place out of 23, predicting the outcome of the match according to the sum of quality ratings correctly (the final assessment of the quality of forecasts for the entire match turned out to be positive). The game was predicted easily and it seems that in that match the model would help us more than a person’s fear of the logarithm.
Second game Most interesting. Liquid suddenly came to life after the defeat (he chose the heroes correctly, as consultant No. 2 said). The model was repaired (woke up the creator). We were not sure how it works (and it was obvious that it was proceeding from experience), and sometimes we took the wheel into our own hands. The model gave a strong scatter, we decided to cool her ardor. We climbed to the 14th place in the game.
The third game. What will happen? Finished 15th place, I think because of the interventions rates before the start of the game on Liquid.
Fourth game Or pan or gone. We decided not to go to the car. Put on autopilot. Result - 3rd place ( results of the last match of the grand final ) after extremely extreme and extremely confident teams, perhaps the best result of pure machine learning.
Conclusion: Although the model seems harsh, but she is strong (she ... we congratulate her on March 8!). Especially for matches that go with the advantage of one team. The model did not waste time in vain, did not look at the recent past ... as we do. Not looking for strategies as a consultant. She simply said that from the place where we are now in the match, historically everything goes to such an outcome.
In total, 10th place (according to our total calculations) of 23 teams who played in all 4 games of the grand final.
If we eliminate the "extreme" and "confident", then the place will be higher. By the way, to play only algorithms, it would be useful for people to bet real money on the result. Then it would be interesting to look at the last 5 teams for the sum of 4 games, which would be dropped from 9000 to 300000 rubles (at 1 ruble per metric unit). I think then the winning team would think more carefully.
Lessons:
1) Hackathon is a cool thing with its tight time and an unknown topic that needs to be opened. We will playDota2 hackathons on!
2) We performed well, taking into account the tight deadlines and complete ignorance of Dota2.
3) Trust the machine (but verify).
4) Experts are needed to transfer knowledge that will be pulled out of the data for a long time and which the machine will then check. In this hackathon, the “models” of experts simultaneously had bias + variance, i.e. they had a rough model “put everything on this team”, and a large scatter (“no, no, now put on this”). Perhaps symbiosis machine + expert is best.
5) Do not go into combat with one tool. Suddenly refuse? We are grateful that we had a schedule that saved the first match of the grand final.
6) For rare events (emissions in the form of very rare strategies) there are not enough observations to adequately take into account the contribution of such a strategy.
First, chronologically, about the first, “online” part. There is a grid of world finals of the game “The Shanghai Major 2016”. It is necessary to predict its outcome before the match. As time has shown (but not a description of the competition), it was necessary to predict the matches for March 3, 4, 5. For training were given historical data about the matches in Dota2 for different past tournaments with aggregated information about each match. From Wednesday I had to start getting enough sleep, because all day work. Two models were developed for the online stage.
The following metric was used as an indicator of forecast quality: score = log2 (p_winner) +1, where p_winner is the predicted probability of winning the team that won as a result.
')
Here it is worth saying a few words about the goals of the hackathon. The purpose of the formal - to get the highest relative to other assessment of the quality of forecasts. The goal of Data Fest is to build the best, relative to others, model for predicting the outcome of a match using machine learning methods.
One Data Fest 2 speaker on the last day ( Nuker ?) Correctly noted that “the problem of machine learning can always be solved without machine learning” (with its own neural networks in the head). Who used models, who used expert experience, who just played by chance? Unknown.
The final assessment of the first stage is the average of all values of the quality metric for the predicted probabilities. As the tournament table of the first stage of the Hakaton shows, the number of predictions per “team” varied by 10–20 times. As we know, the missing data can, of course, be replaced by something, but here the key question is whether the person deliberately concluded that the probability is 0.5 or just overslept the moment of sending the forecast? Probably overslept, just not sent. Therefore, it would be better to simply not consider the commands in the table with the number of predictions less than, say, 10, because too little information to evaluate the team model. And the best strategy of the game in the final assessment is to make a good prediction and no longer play (send 0.5), which, of course, does not correspond to the meaning of Data Fest.
Model online part number 1 "Nikolay" (machine learning). The SVM algorithm predicts the victory of the first team in terms of the shares of the victories of the first team in all matches for the last 1, 2, ..., 12 months + the same for the second team. When creating a model, an algorithm was selected and insignificant features were screened out.
The feature set was selected as follows. The share of team wins in previous matches is an indicator of team mastery. Mastery can change over time, so it is important to consider dynamics. Initially, we wanted to use the team wins for individual months, but there were too many gaps in the data. Therefore, we moved to shares in the past few months. Among the signs was the share of victories of the first team in all matches against the second team, but the importance of this sign turned out to be very low (presumably due to the large number of passes), so we eliminated this sign.
There was also an idea to take into account the skill of the teams that were defeated by the first or the second team when calculating their skills, since a victory over a strong team should make a greater contribution to the skill index than a victory over a weak one. However, there was no time to implement the idea.
Model online part number 2 "Sergey Smetanin" (assumptions + data analysis). We decided to consider matches only from 07/01/2015. After analyzing the table of victories / losses / difference of victories and losses, we saw that sorting by victories most precisely groups the teams of the tournament “The Shanghai Major 2016”:
Accordingly, as ad hoc, the probabilities of victory for the first team used a sum with identical weights of 0.5 two sizes:
1) The ratio of the number of victories of the first team to the total number of victories of the first and second teams in all matches from 07/01/2015;
2) The ratio of the number of victories of the first team to the total number of victories of the first and second teams in matches only between the first and second teams from 07/01/2015.
Why? Repeated from such assumptions:
- teams and experience have greatly changed over time, so we will take only the latest information. What is fresh? We do not know. For example, 07/01/2015.
- the table of teams shows that victories most accurately group the teams “The Shanghai Major”. We will work with winnings.
- it is probably important that the game was between two teams of interest. We make a sign only for such matches. (However, after the matches, the recalculation showed that it is better not to take this sign. Partly, therefore, we took into account all the teams in the second part of the hackathon.)
- we look at the historical strength of the teams.
- the force measured by the winnings already has all the information about the choice of strategy, players, etc. Therefore, while we dwell on it.
Model results:
At first, Model 2 was in the lead, but the human factor played a role - they made a mistake when sending, one prediction was lost with probability 1. From the first place on March 3, they quickly gave up the palm of a steady “Nikolay”, which would win 4th place of 42 at the end of the online part, if we consider at least 10 matches.
Offline part officially began on March 5 at 20:00. For building models, data was provided (at 0:30) on the course of matches of the tournament (the state of the game at different points in time during the match). At 1:30 we received the latest missing information about who won in these matches. By the beginning of the first match of the final (the match before the grand final) at 5:30 the model was ready.
Input for model:
- by player: xp_per_min, gold, net_worth, respawn_timer
- by command: tower_state, barracks_state
- for the match: duration
Target variable: Radiant probability of winning
Selected Model: Logistic Regression
Selected predictors: team experience (xp), team total cost (net worth), experience ratio and team total cost (Radiant to Dire), respawn_timer (by heroes), level (by heroes), respawn_timer * level (by heroes).
Training sample: data on the progress of all matches Shanghai Major 2016.
Note : respawn_timer - the time until the revival of the killed hero.
We took the product respawn_timer and level, because we assumed that the higher the level of the hero who temporarily left the game, the worse the team’s chances of winning.
Since there were some doubts about the reliability of the model, we also displayed a graph of the difference in the experience of the teams in real time, so that if the chart shows who wins, and the model gives cautious predictions of about 0.5, send probabilities higher.
The final surprised many when they defeated Liquid in a match against EG, with a negative difference in experience throughout the match (see chart). EG was the favorite of our first Dota2 consultant.
There are rare strategies that work in this way, the second of two (sided) consultants, who played Dota1 professionally at the level of the Russian Championship, explained to us. This did not fit into our logic of feature selection, since we were confident that excellence in experience was one of the most decisive factors for winning. The first consultant (young enthusiast Dota2) was shocked by what he saw.
Probably, such a deviation could be seen from the state of the towers, but such a strategy seems to be so rare that it is not clear how to identify it with machine learning methods without having experience playing Dota2. Adding signs related to the state of the towers and barracks worsened the quality of the model on our test sample.
The graph shows the importance of signs. There are many interesting things here, for example, we are surprised that the level of the first hero R turned out to be significantly less important than the level of the second hero R.
We approached the grand final, not too believing in the strength of our model. The two who made the model and the script for drawing the difference graph in the experience of the teams in real time went to sleep, the two remained to send the model results for evaluation and, in general, “act according to the situation”.
We also thought about the strategy of sending probabilities, taking into account the model evaluation at the end of the match. Probably, the advantage can be obtained by starting as early as possible to predict the highest probabilities. We thought that we would not make such a strategy: we send 0.5 until we “see” the team’s victory and then we send 1. Looking ahead, we can say that many have used this strategy or its variants. It would be interesting to investigate in more detail the question of the optimal strategy, but there was no time.
And ... the final has begun! We watched the game for the first time in our life. The model suddenly ... fell. The schedule went anyway, and we played on it, deciding to systematically increase the deviation of the sent probability from 0.5 in three game periods: start (10 min) ± 0.05, middle (20) ± 0.25, final (20+) ± 0.49.
It was possible to send probabilities during the selection of heroes. One could come up with another model, but decided to just send nothing.
We played for 15th place out of 23, predicting the outcome of the match according to the sum of quality ratings correctly (the final assessment of the quality of forecasts for the entire match turned out to be positive). The game was predicted easily and it seems that in that match the model would help us more than a person’s fear of the logarithm.
Second game Most interesting. Liquid suddenly came to life after the defeat (he chose the heroes correctly, as consultant No. 2 said). The model was repaired (woke up the creator). We were not sure how it works (and it was obvious that it was proceeding from experience), and sometimes we took the wheel into our own hands. The model gave a strong scatter, we decided to cool her ardor. We climbed to the 14th place in the game.
The third game. What will happen? Finished 15th place, I think because of the interventions rates before the start of the game on Liquid.
Fourth game Or pan or gone. We decided not to go to the car. Put on autopilot. Result - 3rd place ( results of the last match of the grand final ) after extremely extreme and extremely confident teams, perhaps the best result of pure machine learning.
Conclusion: Although the model seems harsh, but she is strong (she ... we congratulate her on March 8!). Especially for matches that go with the advantage of one team. The model did not waste time in vain, did not look at the recent past ... as we do. Not looking for strategies as a consultant. She simply said that from the place where we are now in the match, historically everything goes to such an outcome.
In total, 10th place (according to our total calculations) of 23 teams who played in all 4 games of the grand final.
If we eliminate the "extreme" and "confident", then the place will be higher. By the way, to play only algorithms, it would be useful for people to bet real money on the result. Then it would be interesting to look at the last 5 teams for the sum of 4 games, which would be dropped from 9000 to 300000 rubles (at 1 ruble per metric unit). I think then the winning team would think more carefully.
Lessons:
1) Hackathon is a cool thing with its tight time and an unknown topic that needs to be opened. We will play
2) We performed well, taking into account the tight deadlines and complete ignorance of Dota2.
3) Trust the machine (but verify).
4) Experts are needed to transfer knowledge that will be pulled out of the data for a long time and which the machine will then check. In this hackathon, the “models” of experts simultaneously had bias + variance, i.e. they had a rough model “put everything on this team”, and a large scatter (“no, no, now put on this”). Perhaps symbiosis machine + expert is best.
5) Do not go into combat with one tool. Suddenly refuse? We are grateful that we had a schedule that saved the first match of the grand final.
6) For rare events (emissions in the form of very rare strategies) there are not enough observations to adequately take into account the contribution of such a strategy.
Source: https://habr.com/ru/post/278785/
All Articles