Kibana-mother or Why do you need logs at all?
You can say that “sometimes it is necessary ...” But actually, you want to always see what you have in the logs, through a graphical interface. This allows:
So today we will talk again about the ELK stack (Elasticsearch + Logstash + Kibana).
But this time - in terms of json-logs !
Such a use case promises to fill your life with completely new colors and make you experience the full range of feelings.
')

In the life of every normal boy, a moment arises when he decided to put an ELK bundle on his project.
The scheme of the average pipeline looks like this:

We send 2 kinds of logs to Kibana:
These are, respectively, the front-and back-end-s of our entire system ... Let's start!
filebeat
logstash

To generate the request-id on Nginx, we will use a Lua-library that generates uuid-s. In general, it does its job, but it had to be slightly modified with a file - for in its original form it is (ta-dam!) Duplicate uuid-s.
At the output, we are able to find the request that arrives to Nginx by an event in the application log. And vice versa.
It was quickly discovered that our “universe-unique” IDs are not that unique. The fact is that the randomseed library is taken from the timestamp at the time of the start of the nginx worker. And we have as many workers as the cores of the processor, and they are launched at the same time ... It doesn't matter! Let's add the worker's pid there and we will be happy:
PS The Debian repository has the nginx-extras package ready. Immediately there is Lua and a bunch of useful modules. I recommend, instead of compiling the Lua module with my hands (it is still openresty, but I have not tried it).
Kibana allows you to group (build ratings) events based on the same field values.
In the error log, we have stackracks, they are almost perfect as a grouping key, but the snag is that in Kibana you cannot group by keys longer than 256 characters, and stacks are certainly longer. Therefore, we make md5 hashes of stackrays in bunyan and group them already. Beauty!
This is what the top 20 errors look like:

And a single type of error on the chart and the list of episodes:

Now we know which bug in the system can be fixed sometime later, because he is too rare. Agree, such an approach is much more scientific than “there were many similar support tickets for this week”.

Not. Not all fall.
Mapping remembers the name of the field and its type (number, string, array, object, etc.). If we send a message to ES, in which there is a field that already exists in the mapping, but the type does not match what was in this field before (for example, in the mapping - an array, but the object came), then such a message will not fall into ES , and in its log there will be a not too obvious message:
{"Error": "MappedParcingException [object] mapping for [something] tried
A source
Elasticsearch v2.x does not accept messages in which there are fields whose names contain dots. In v1.x there was no such restriction, and we cannot switch to the new version without redoing all the logs, since we have such fields are "historically".
A source
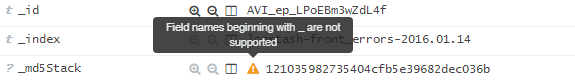
In addition, Kibana does not support fields whose names begin with an underscore '_'.
Developer Comment
By default, the Zen Discovery option is enabled in ES. Thanks to it, if you run several ES instances on the same network (for example, several docker containers on the same host), they will find each other and share the data among themselves. A very convenient way to mix productive and test data and deal with it for a long time.
The stack of demons involved in our criminal scheme is quite numerous. In addition, some of them like to fall incomprehensibly and go up for a very long time (yes, those in Java). Most often logstash-indexer hangs, in the logs there is silence or unsuccessful attempts to send data to ES (it can be seen that they were long ago, and not just that). The process is alive, if you send it a kill - it dies for a very long time. You have to send kill -9 if you have no time to wait.
Less often, but it also happens that Elasticsearch is falling. He does it “in English” (i.e. silently).
In order to understand which of the two of them fell, we make an http-request in ES - if answered, then it’s not him. In addition, when you have relatively a lot of data (say, 500G), then your Elasticsearch will start to siphon this data for about half an hour after launch, and at that time it will be unavailable. The data of Kibana itself is stored there, so it also does not work until its index is picked up. According to the law of meanness, it usually turns to the very end.
It is necessary to monitor by monitoring the queue length in rabbitmq in order to quickly respond to incidents. Once a week they happen to be stable.
And when you have everything in the docker, and the containers are linked together, then you need to restart also all the containers that were linked to the ES container, except for himself.
By default, the HeapDumpOnOutOfMemoryError option is enabled in ES. This can lead to the fact that you have unexpectedly run out of disk space due to one or several ~ 30GB dumps. Of course, they are dumped into the directory where the binaries are located (and not where the data is). This happens quickly, monitoring does not even have time to send SMS. You can disable this behavior in bin / elasticsearch.in.sh.
In Elasticsearch there is a so-called. “Mapping” indexes. In essence, this is a table schema in which data is stored in the format “field - type”. It is created automatically based on the incoming data. This means that ES will remember the name and data type of the field, based on what type of data came in this field for the first time.
For example, we have 2 very different logs: access-log nginx and production-log nodejs-applications. In one standard set of fields, it is short, data types never change. In the other, on the contrary, there are many fields, they are nested, they are different for each line of the log, the names can intersect, the data inside the fields can be of different types, the length of the line reaches 3 or more MB. As a result, ES auto-mapping does this:
Mapping thehealthy “rectangular” nginx log:
root @ localhost: /> du -h ./nginx.mapping
16K ./nginx.mapping
Mapping thesmoker of the “shapeless” json-log of our application:
root @ localhost: /> du -h ./prodlog.mapping
2.1M ./prodlog.mapping
In general, it greatly slows down both when indexing data and when searching through Kibana. In this case, the more accumulated data, the worse.
We tried to deal with this closure of old indices with curator . The positive effect is certainly there, but still it is anesthesia, not a treatment.
Therefore, we came up with a more radical solution. All heavy nested-json in the production-log will now be logged as a string in a special single message field. Those. here is straight JSON.stringify (). Due to this, the set of fields in the messages becomes fixed and short, we arrive at a “light” mapping like that of the nginx log.
Of course, this is a kind of “amputation with further prosthetics,” but the option is working. It will be interesting to see in the comments how else you could have done.
Stack ELK is a cool tool. For us, it has become simply indispensable. Managers watch the bursts of errors on the front-end after the next release and come to complain to the developers already “not empty-handed”. Those, in turn, find correlations with errors in the application, immediately see their stacks and other important data necessary for debag. It is possible to instantly build various reports from the series “hits by site domains”, etc. In a word, it is not clear how we lived before. But in other way…
“Robust, Reliable, Predictable” - all this is not about ELK. The system is very capricious and rich in unpleasant surprises. Very often you have to dig in all this shaky, sorry, Jav-no. Personally, I can not remember the technology that would so badly follow the principle of "set up and forget."
Therefore, over the past 2 months, we completely redid the application logs. As in terms of format (we get rid of dots in names, in order to switch to ES v.2), so in terms of approach to what is generally logged and what is not. By itself, this process, IMHO, is absolutely normal and logical for a project such as ours - recently, uKit celebrated its first birthday.
“At the beginning of the way you dump as much information as possible into the logs, since it is not known in advance what will be needed, and then, having begun to “grow up,” gradually remove the excess. ” (c. pavel_kudinov )
- To make life easier for developers and system administrators, whose time is just a pity and expensive to write grep-pipelines and parsers for each individual case.
- Provide access to the information contained in the logs, moderately advanced users - managers and technical support.
- And to see the dynamics and tendencies of appearance of pledged events (for example, errors).
So today we will talk again about the ELK stack (Elasticsearch + Logstash + Kibana).
But this time - in terms of json-logs !
Such a use case promises to fill your life with completely new colors and make you experience the full range of feelings.
')
Prologue:
“Understand, on Habrahabr only talk, what about Kibana and Elasticsearch. How damn cool it is to see how a huge text log turns into beautiful graphics, and the CPU load is barely visible somewhere in the depths of the top. And you? .. What will you tell them? "
Materiel
In the life of every normal boy, a moment arises when he decided to put an ELK bundle on his project.
The scheme of the average pipeline looks like this:
We send 2 kinds of logs to Kibana:
- “Almost normal” nginx log. Its only highlight is the request-id. We will generate them, as is now fashionable, using Lua-in-config ™.
- The “unusual” logs of the application itself on node.js. That is, the error log and the “prodlog”, where “normal” events are flying - for example, “the user has created a new site”.
The peculiarity of this type of logs is that it:- Serialized json (logs events for the bunyan npm module)
- Formless. The set of fields for messages is different, besides, in the same fields different messages may have different types of data (this is important!).
- Very fat. The length of some messages exceeds 3Mb.
These are, respectively, the front-and back-end-s of our entire system ... Let's start!
filebeat
filebeat.yml:
We describe the paths to the files and add fields to the messages that we need to determine the types of logs at the filtering stage and when sending to ES.
filebeat: prospectors: - paths: - /home/appuser/app/production.log.json input_type: log document_type: production fields: format: json es_index_name: production es_document_type: production.log - paths: - /home/appuser/app/error.log.json input_type: log document_type: production fields: format: json es_index_name: production es_document_type: production.log - paths: - /home/appuser/app/log/nginx.log input_type: log document_type: nginx fields: format: nginx es_index_name: nginx es_document_type: nginx.log registry_file: /var/lib/filebeat/registry output: logstash: hosts: ["kibana-server:5044"] shipper: name: ukit tags: ["prod"] logging: files: rotateeverybytes: 10485760 # = 10MB logstash
logstash-listener / 01-beats-input.conf:
input { beats { port => 5044 } } logstash-listener / 30-rabbit-output.conf:
output { rabbitmq { exchange => "logstash-rabbitmq" exchange_type => "direct" key => "logstash-key" host => "localhost" port => 5672 workers => 4 durable => true persistent => true } } logstash-indexer / 01-rabbit-input.conf:
input { rabbitmq { host => "localhost" queue => "logstash-queue" durable => true key => "logstash-key" exchange => "logstash-rabbitmq" threads => 4 prefetch_count => 50 port => 5672 } } logstash-indexer / 09-filter.conf:
Depending on the format, we run it through the appropriate codec.
In the case of nginx, these will be such “unusual” regular semi-finished products offered by the “grok” filter module (left), and the names of the fields into which the matched data will fall (right). For greater beauty, we also have a geoip filter, which determines the location of the client. In Kibana, it will be possible to make "geography" of clients. Base download from here dev.maxmind.com/geoip/legacy/geolite .
And in the case of json, as you see, you don’t need to do anything at all, which is good news.
filter { if [fields][format] == "nginx" { grok { match => [ "message", "%{IPORHOST:clientip} - \[%{HTTPDATE:timestamp}\] %{IPORHOST:domain} \"(?:%{WORD:verb} %{NOTSPACE:request}(?: HTTP/%{NUMBER:httpversion})?|%{DATA:rawrequest})\" %{NUMBER:status:int} (?:%{NUMBER:bytes:int}|-) %{QS:referrer} %{QS:agent} %{NUMBER:request_time:float} (?:%{NUMBER:upstream_time:float}|-)( %{UUID:request_id})?" ] } date { locale => "en" match => [ "timestamp" , "dd/MMM/YYYY:HH:mm:ss Z" ] } geoip { source => "clientip" database => "/opt/logstash/geoip/GeoLiteCity.dat" } } if [fields][format] == "json" { json { source => "message" } } } logstash-indexer / 30-elasticsearch-output.conf:
The index name and document_type for ES are taken from the fields, which at the very beginning of the path were pasted to the messages in the filebeat.
output { elasticsearch { hosts => ["localhost:9200"] index => "logstash-%{[fields][es_index_name]}-%{+YYYY.MM.dd}" document_type => "%{[fields][es_document_type]}" } } Linking events in front and back logs
Outline:
“We had 2 types of logs, 5 services in a stack, a half-byte of data in ES, as well as an uncountable set of fields in the application logs. Not that it was a necessary set for real-time analysis of the state of the service, but when you start thinking more about linking nginx and application events, it becomes difficult to stop.
My only concern was Lua. There is nothing more helpless, irresponsible and vicious than Lua in Nginx configs. I knew that sooner or later we will move on to this rubbish. ”
To generate the request-id on Nginx, we will use a Lua-library that generates uuid-s. In general, it does its job, but it had to be slightly modified with a file - for in its original form it is (ta-dam!) Duplicate uuid-s.
http { ... # lua_package_path '/etc/nginx/lua/uuid4.lua'; init_worker_by_lua ' uuid4 = require "uuid4" math = require "math" '; ... # request_id, # (set $var) http map $host $request_uuid { default ''; } # log_format ukit '$remote_addr - [$time_local] $host "$request" ' '$status $body_bytes_sent "$http_referer" ' '"$http_user_agent" $request_time ' '$upstream_response_time $request_uuid'; # access_log /home/appuser/app/log/nginx.log ukit; } server { ... # id set_by_lua $request_uuid ' if ngx.var.http_x_request_id == nil then return uuid4.getUUID() else return ngx.var.http_x_request_id end '; # , . location @backend { proxy_pass http://127.0.0.1:$app_port; proxy_redirect http://127.0.0.1:$app_port http://$host; proxy_http_version 1.1; proxy_set_header Connection ""; proxy_set_header X-Real-IP $remote_addr; proxy_set_header X-Nginx-Request-ID $request_uuid; #id proxy_set_header Host $host; ... } ... } At the output, we are able to find the request that arrives to Nginx by an event in the application log. And vice versa.
It was quickly discovered that our “universe-unique” IDs are not that unique. The fact is that the randomseed library is taken from the timestamp at the time of the start of the nginx worker. And we have as many workers as the cores of the processor, and they are launched at the same time ... It doesn't matter! Let's add the worker's pid there and we will be happy:
... local M = {} local pid = ngx.worker.pid() ----- math.randomseed( pid + os.time() ) math.random() ... PS The Debian repository has the nginx-extras package ready. Immediately there is Lua and a bunch of useful modules. I recommend, instead of compiling the Lua module with my hands (it is still openresty, but I have not tried it).
Grouping errors by frequency of occurrence.
Kibana allows you to group (build ratings) events based on the same field values.
In the error log, we have stackracks, they are almost perfect as a grouping key, but the snag is that in Kibana you cannot group by keys longer than 256 characters, and stacks are certainly longer. Therefore, we make md5 hashes of stackrays in bunyan and group them already. Beauty!
This is what the top 20 errors look like:
And a single type of error on the chart and the list of episodes:
Now we know which bug in the system can be fixed sometime later, because he is too rare. Agree, such an approach is much more scientific than “there were many similar support tickets for this week”.
And now - the disruption of covers: it works, but bad
The climax:
"I understand. You found paradise in NoSQL: you were developing quickly, because you kept everything in MongoDB, and you didn’t need friends like me. And now, you come and say: I need a search. But you do not ask with respect, you do not even call me the Best Search Engine. No, you come to my house on Lucene's birthday and ask me to index unstructured logs for free. ”
Surprises
Do all messages from the log fall into Kibana?
Not. Not all fall.
Mapping remembers the name of the field and its type (number, string, array, object, etc.). If we send a message to ES, in which there is a field that already exists in the mapping, but the type does not match what was in this field before (for example, in the mapping - an array, but the object came), then such a message will not fall into ES , and in its log there will be a not too obvious message:
{"Error": "MappedParcingException [object] mapping for [something] tried
A source
Field names in json logs
Elasticsearch v2.x does not accept messages in which there are fields whose names contain dots. In v1.x there was no such restriction, and we cannot switch to the new version without redoing all the logs, since we have such fields are "historically".
A source
In addition, Kibana does not support fields whose names begin with an underscore '_'.
Developer Comment
Automatic data crawling to neighboring ES instances
By default, the Zen Discovery option is enabled in ES. Thanks to it, if you run several ES instances on the same network (for example, several docker containers on the same host), they will find each other and share the data among themselves. A very convenient way to mix productive and test data and deal with it for a long time.
It falls and then rises for a long time. This is even more painful when the docker
The stack of demons involved in our criminal scheme is quite numerous. In addition, some of them like to fall incomprehensibly and go up for a very long time (yes, those in Java). Most often logstash-indexer hangs, in the logs there is silence or unsuccessful attempts to send data to ES (it can be seen that they were long ago, and not just that). The process is alive, if you send it a kill - it dies for a very long time. You have to send kill -9 if you have no time to wait.
Less often, but it also happens that Elasticsearch is falling. He does it “in English” (i.e. silently).
In order to understand which of the two of them fell, we make an http-request in ES - if answered, then it’s not him. In addition, when you have relatively a lot of data (say, 500G), then your Elasticsearch will start to siphon this data for about half an hour after launch, and at that time it will be unavailable. The data of Kibana itself is stored there, so it also does not work until its index is picked up. According to the law of meanness, it usually turns to the very end.
It is necessary to monitor by monitoring the queue length in rabbitmq in order to quickly respond to incidents. Once a week they happen to be stable.
And when you have everything in the docker, and the containers are linked together, then you need to restart also all the containers that were linked to the ES container, except for himself.
Large memory dumps with OOM
By default, the HeapDumpOnOutOfMemoryError option is enabled in ES. This can lead to the fact that you have unexpectedly run out of disk space due to one or several ~ 30GB dumps. Of course, they are dumped into the directory where the binaries are located (and not where the data is). This happens quickly, monitoring does not even have time to send SMS. You can disable this behavior in bin / elasticsearch.in.sh.
Performance
In Elasticsearch there is a so-called. “Mapping” indexes. In essence, this is a table schema in which data is stored in the format “field - type”. It is created automatically based on the incoming data. This means that ES will remember the name and data type of the field, based on what type of data came in this field for the first time.
For example, we have 2 very different logs: access-log nginx and production-log nodejs-applications. In one standard set of fields, it is short, data types never change. In the other, on the contrary, there are many fields, they are nested, they are different for each line of the log, the names can intersect, the data inside the fields can be of different types, the length of the line reaches 3 or more MB. As a result, ES auto-mapping does this:
Mapping the
root @ localhost: /> du -h ./nginx.mapping
16K ./nginx.mapping
Mapping the
root @ localhost: /> du -h ./prodlog.mapping
2.1M ./prodlog.mapping
In general, it greatly slows down both when indexing data and when searching through Kibana. In this case, the more accumulated data, the worse.
We tried to deal with this closure of old indices with curator . The positive effect is certainly there, but still it is anesthesia, not a treatment.
Therefore, we came up with a more radical solution. All heavy nested-json in the production-log will now be logged as a string in a special single message field. Those. here is straight JSON.stringify (). Due to this, the set of fields in the messages becomes fixed and short, we arrive at a “light” mapping like that of the nginx log.
Of course, this is a kind of “amputation with further prosthetics,” but the option is working. It will be interesting to see in the comments how else you could have done.
Subtotal
Stack ELK is a cool tool. For us, it has become simply indispensable. Managers watch the bursts of errors on the front-end after the next release and come to complain to the developers already “not empty-handed”. Those, in turn, find correlations with errors in the application, immediately see their stacks and other important data necessary for debag. It is possible to instantly build various reports from the series “hits by site domains”, etc. In a word, it is not clear how we lived before. But in other way…
“Robust, Reliable, Predictable” - all this is not about ELK. The system is very capricious and rich in unpleasant surprises. Very often you have to dig in all this shaky, sorry, Jav-no. Personally, I can not remember the technology that would so badly follow the principle of "set up and forget."
Therefore, over the past 2 months, we completely redid the application logs. As in terms of format (we get rid of dots in names, in order to switch to ES v.2), so in terms of approach to what is generally logged and what is not. By itself, this process, IMHO, is absolutely normal and logical for a project such as ours - recently, uKit celebrated its first birthday.
“At the beginning of the way you dump as much information as possible into the logs, since it is not known in advance what will be needed, and then, having begun to “grow up,” gradually remove the excess. ” (c. pavel_kudinov )
Source: https://habr.com/ru/post/278729/
All Articles