The legend of the silver pool, or how I looked for logical caching and retrieval errors
Disclaimer : do not use the following patches for production; Use specially prepared test sites.
When I was little, I dreamed of becoming a wizard. When I grew up a bit, I chose the profession closest to witchcraft - I became a programmer. In the process of developing all sorts of web applications of varying degrees of complexity, it turned out that not only curiosity and love for experiments, but also simple human vanity amused themselves.
Oh, this sweet feeling when you come all in white, move your fingers over the keyboard for a week or two (maybe an hour or a day) - and solve some kind of problem that many people have been struggling with for a long time without success.
')
The story began with the fact that I was asked to conduct a detailed audit of a fairly popular online store. The whole application spun on two balancers, several backends and two database servers. Load - 1-4 thousand requests per minute. The stack is close to the classic: PHP (-fpm), Mysql, Memcached, Sphinx, Nginx. Sometimes the circumstances were such that the whole system got a stake, and there was no direct correlation with the load. And even with the layout of the new code (and the corresponding restarts of the demons) - not always.
It's nice that, it seems, the developers read various useful articles when they created it all. Then, however, people slowly changed, and the current team basically sawed the new functionality, and occasionally fell on the residual principle (i.e., put a bolt: “quickly raised is not considered to be fallen”).
When the project was already completed, it seemed strange to me that I had been digging for so long: the problematic method flashed in the first reports of New Relic, and it was possible to immediately notice the request to the external data storage inside the cycle.
As a result, it took me several dozen hours to read the code and experiment to “feel” the project and finally catch the problem.
Rewrite, debug and prepare a patch - half a day, maybe a little more. I hope someday I will be able to proudly say something like “no one would be able to find this cant faster.” But for now I’m writing notes to allow my colleagues to fill in less cones :)
The main root of the problems (in fact, no) I found quite quickly. Since the launch of the store, the table of goods has grown to more than 10GB, and turned around with certain difficulties. Especially when indexes were updated on it. There was something similar with the order plate, but there were no mass appeals to it. At the same time back office site on Magento ruled out at least some sharding. The part for which the main load fell was written in Yii, and in it I needed to dig up something with the help of New Relic and non-print expressions.
First of all, of course, I ran through the TOP-20 of the most “time-consuming” controllers. I checked how it was done with caching (almost everywhere it was), checked that the caches work. At the same time I walked through the code with an automatic analyzer, I found several errors like “it’s impossible in PHP”, and only that.
While the developers were finishing caching in places where it was not enough, I continued to dig into the application. I tried to jerk off the balancer of SQL-queries for Magento, spent a lot of time, lost heart, threw.
At some point, a sensible decision came to mind. If caching is everywhere, “hot start” does not require any queries to the database at all, then maybe there are too many caches? The keys are different, the data is the same? Indirectly, this idea led me to statistics - for a single request of a web page three hundred memcached-get is a bit too much, there is clearly room for optimization.
To conduct a study on the use of memokes was not so difficult. The main thing - do not do it in production. All break - a couple of trivia. We will patch the core of Yii.
In the memcached class, you need to add a variable, say, $ debagger. If the call goes through a singleton or something like that, it is not necessary to even declare the variable static.
Then in the get () method we add statistics.
We count the total number of unique keys ( ids_count ). If the key is not unique, we count how many times it is called. Then we fix hits and misses. And, finally, for the most popular keys, we fix the trace to find the ends.
Somewhere at the bottom of the page, all this variable can be output. Accuracy, of course, will put this all in a log file and will look there.
I walked through the main pages, collected logs and climbed to look. Surprisingly - but there were several methods that requested the same data 20 times. Redid - and the number of requests fell about a half to two times, which, however, did not greatly affect the performance (naturally).
Digging more, farther and deeper ... I began to suspect (in fact, there were complaints of falling) that there are problems with using Sphinx. The application communicated both with it and with Mysql via the HandlerSocket, so New Relic did not share them in its statistics - I had to do it myself.
Applying the above method of collecting statistics, I saw 600 fantastic requests to Sphinx on the main page with a cold start, and none with a hot one. True, all requests are different. I recorded the request in the logs and received something like:
Then I began to suspect something. Looked into the code. And, of course, I saw the correct cache (correctly), in the absence of which the foreach was executed, in which a query was made to Sphinx (incorrectly).
Sphinx fast and cool. But he cannot (and should not) work with the same intensity as memkes. He has a different principle of work and, frankly, other tasks. Do not do it this way.
Rewrote the whole method to use one large query instead of a pack of small ones. The request began to look like this:
Checked that everything works. With a sinking heart, I waited for the calculations.
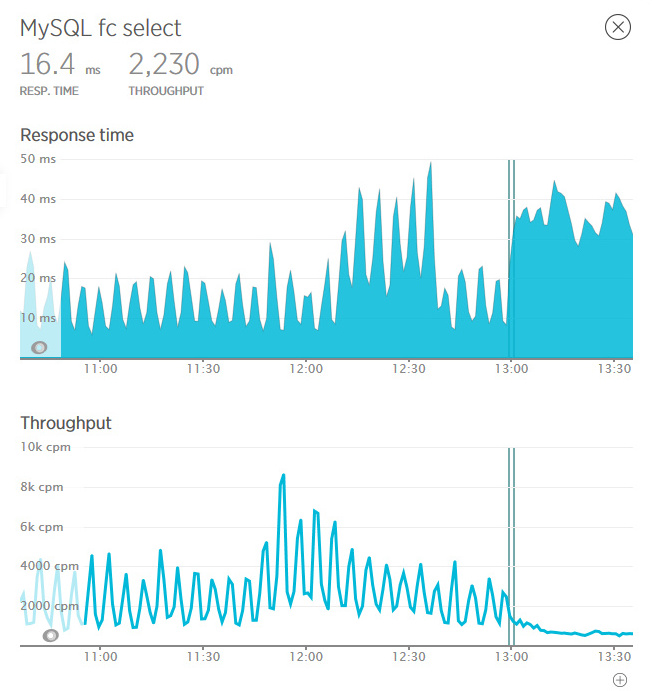
The overall performance increase, of course, was not a multiple. Maybe 10%, maybe a little more. But how much easier were Memcache faults started to be given! 600 simple and fast requests turned into one complex and long. But he was still done twice as fast! But the server was breathing deeply and stopped falling with each calculation.
Here on these graphs, the vertical lines mark the laying of the code on the servers (I note that, on our advice, the code was not laid out at the same time, but at a short interval). Ragged schedule of requests immediately turned into a smooth line. The minimum time to refine the page has grown, but the extremes have completely disappeared. And, most importantly, the number of requests has become steadily low.

The participants in the events took more beautiful pictures in New Relic, drew an optimistic report and drank a substantial fee with pleasure.
* * *
When I was little, I dreamed of becoming a wizard. When I grew up a bit, I chose the profession closest to witchcraft - I became a programmer. In the process of developing all sorts of web applications of varying degrees of complexity, it turned out that not only curiosity and love for experiments, but also simple human vanity amused themselves.
Oh, this sweet feeling when you come all in white, move your fingers over the keyboard for a week or two (maybe an hour or a day) - and solve some kind of problem that many people have been struggling with for a long time without success.
')
Introductory
The story began with the fact that I was asked to conduct a detailed audit of a fairly popular online store. The whole application spun on two balancers, several backends and two database servers. Load - 1-4 thousand requests per minute. The stack is close to the classic: PHP (-fpm), Mysql, Memcached, Sphinx, Nginx. Sometimes the circumstances were such that the whole system got a stake, and there was no direct correlation with the load. And even with the layout of the new code (and the corresponding restarts of the demons) - not always.
It's nice that, it seems, the developers read various useful articles when they created it all. Then, however, people slowly changed, and the current team basically sawed the new functionality, and occasionally fell on the residual principle (i.e., put a bolt: “quickly raised is not considered to be fallen”).
Retrospective (looking ahead)
When the project was already completed, it seemed strange to me that I had been digging for so long: the problematic method flashed in the first reports of New Relic, and it was possible to immediately notice the request to the external data storage inside the cycle.
As a result, it took me several dozen hours to read the code and experiment to “feel” the project and finally catch the problem.
Rewrite, debug and prepare a patch - half a day, maybe a little more. I hope someday I will be able to proudly say something like “no one would be able to find this cant faster.” But for now I’m writing notes to allow my colleagues to fill in less cones :)
Research
The main root of the problems (in fact, no) I found quite quickly. Since the launch of the store, the table of goods has grown to more than 10GB, and turned around with certain difficulties. Especially when indexes were updated on it. There was something similar with the order plate, but there were no mass appeals to it. At the same time back office site on Magento ruled out at least some sharding. The part for which the main load fell was written in Yii, and in it I needed to dig up something with the help of New Relic and non-print expressions.
First of all, of course, I ran through the TOP-20 of the most “time-consuming” controllers. I checked how it was done with caching (almost everywhere it was), checked that the caches work. At the same time I walked through the code with an automatic analyzer, I found several errors like “it’s impossible in PHP”, and only that.
While the developers were finishing caching in places where it was not enough, I continued to dig into the application. I tried to jerk off the balancer of SQL-queries for Magento, spent a lot of time, lost heart, threw.
At some point, a sensible decision came to mind. If caching is everywhere, “hot start” does not require any queries to the database at all, then maybe there are too many caches? The keys are different, the data is the same? Indirectly, this idea led me to statistics - for a single request of a web page three hundred memcached-get is a bit too much, there is clearly room for optimization.
To conduct a study on the use of memokes was not so difficult. The main thing - do not do it in production. All break - a couple of trivia. We will patch the core of Yii.
Experiment
In the memcached class, you need to add a variable, say, $ debagger. If the call goes through a singleton or something like that, it is not necessary to even declare the variable static.
Then in the get () method we add statistics.
public function get($id) { if (isset($this->debugger['ids_count'][$id])) { $this->debugger['ids_count'][$id]++; if ( $this->debugger['ids_count'][$id] > 10 && !isset($this->debugger['much'][$id]) ) { $backtrace = debug_backtrace(DEBUG_BACKTRACE_IGNORE_ARGS); $this->debugger['much'][$id] = $this->debugger['ids_count'][$id]; $this->debugger['much'][$id] = $backtrace; } } else { $this->debugger['ids_count'][$id] = 0; } if (isset($this->debugger['all'])) { $this->debugger['all']++; } else { $this->debugger['all'] = 0; } if(($value=$this->getValue($this->generateUniqueKey($id)))!==false) { $data=$this->autoSerialize ? $this->unserializeValue($value) : $value; if(!$this->autoSerialize || (is_array($data) && (!($data[1] instanceof ICacheDependency) || !$data[1]->getHasChanged()))) { Yii::trace('Serving "'.$id.'" from cache','system.caching.'.get_class($this)); if (isset($this->debugger['success'][$id])) { $this->debugger['success'][$id]++; } else { $this->debugger['success'][$id] = 0; } return $this->autoSerialize ? $data[0] : $data; } } if (isset($this->debugger['fail'][$id])) { $this->debugger['fail'][$id]++; } else { $this->debugger['fail'][$id] = 0; } return false; } We count the total number of unique keys ( ids_count ). If the key is not unique, we count how many times it is called. Then we fix hits and misses. And, finally, for the most popular keys, we fix the trace to find the ends.
Somewhere at the bottom of the page, all this variable can be output. Accuracy, of course, will put this all in a log file and will look there.
I walked through the main pages, collected logs and climbed to look. Surprisingly - but there were several methods that requested the same data 20 times. Redid - and the number of requests fell about a half to two times, which, however, did not greatly affect the performance (naturally).
Not a ride
Digging more, farther and deeper ... I began to suspect (in fact, there were complaints of falling) that there are problems with using Sphinx. The application communicated both with it and with Mysql via the HandlerSocket, so New Relic did not share them in its statistics - I had to do it myself.
Applying the above method of collecting statistics, I saw 600 fantastic requests to Sphinx on the main page with a cold start, and none with a hot one. True, all requests are different. I recorded the request in the logs and received something like:
select id1, id2 from table where cat_id IN (N); -- N -- . Then I began to suspect something. Looked into the code. And, of course, I saw the correct cache (correctly), in the absence of which the foreach was executed, in which a query was made to Sphinx (incorrectly).
Sphinx fast and cool. But he cannot (and should not) work with the same intensity as memkes. He has a different principle of work and, frankly, other tasks. Do not do it this way.
Rewrote the whole method to use one large query instead of a pack of small ones. The request began to look like this:
select id1, id2 from table where cat_id IN (X1, X2, ... XN); Checked that everything works. With a sinking heart, I waited for the calculations.
Rolled
The overall performance increase, of course, was not a multiple. Maybe 10%, maybe a little more. But how much easier were Memcache faults started to be given! 600 simple and fast requests turned into one complex and long. But he was still done twice as fast! But the server was breathing deeply and stopped falling with each calculation.
Here on these graphs, the vertical lines mark the laying of the code on the servers (I note that, on our advice, the code was not laid out at the same time, but at a short interval). Ragged schedule of requests immediately turned into a smooth line. The minimum time to refine the page has grown, but the extremes have completely disappeared. And, most importantly, the number of requests has become steadily low.
The participants in the events took more beautiful pictures in New Relic, drew an optimistic report and drank a substantial fee with pleasure.
Source: https://habr.com/ru/post/278675/
All Articles