Complex hardware nodes, simultaneous parallel execution and kernel / system runtime
Luxoft Training offers to get acquainted with the translation of another article by Randolph Gaist “ Big Nodes, Concurrent Parallel Execution And High System / Kernel Time ”.
 Randolph Geist specializes in correcting errors related to the performance of Oracle databases. One of the best specialists in the world in the area of analyzing the performance of SQL-code and Oracle optimization technologies. Is an Oracle Certified Database Administrator (OCP DBA) versions 8i, 9i and 10g.
The following applies only to customers running Oracle on large servers with a large number of cores in single-instance mode (this particular problem is not reproduced in the RAC environment; see below for an explanation of why).
')
These customers include one of my clients, which uses Exadata Xn-8 servers, for example, X4-8 with 120 cores / 240 processors per node (but also reproduced on older and smaller models with 64 cores / 128 processors per node ).
Recently, the base application decided to rewrite. A part of this code performed the same operations for different data sets, in many cases simultaneously. This led to the fact that multiple sessions used parallel query execution. Many queries in this code did not in the best way use parallel execution: queries with a very short duration used parallel execution, leading to several parallel execution starts per second. Such a picture can be seen in the AWR report, which shows that, on average, several parallel execution trees were run every second of an hour:

When the new code was tested on the data and load received from the production system, at first the profile of the processor of such a large node (operating in single-instance mode) looked like this. At the same time, the computer was not loaded by other processes.
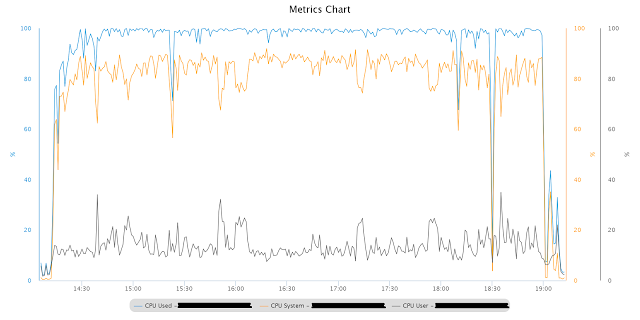
As can be seen in Fig., The node's processor is fully loaded, and most of the time is in kernel / system mode. AWR reports showed a significant number of atypical PX wait events:
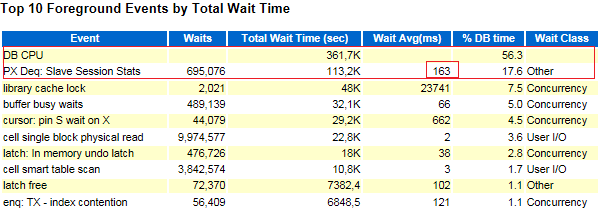
The “PX Deq: Slave Session Stats” event should not take a lot of time, since we are talking about the transfer of session statistics of slave nodes to the PX coordinator at the time of their completion. Obviously, something significantly slowed down this PX interaction (and this could only be noticed if there was excessive use of parallel execution).
In addition, some of the more complex queries with parallel execution that perform a large number of associations and lead to a significant amount of redistribution of data, occurred as in slow motion. Although almost 100% of the execution time was on the CPU, in Active Session History it can be seen that almost 90% of the time is related to the redistribution operation:
Running the same query with the same execution plan and the same data on the same machine during its idle time showed almost 20 times higher performance, and the redistribution took less than 40% of the time:
Apparently, these requests entered into some kind of competition, which does not occur in Oracle, but outside (at the operating system level), and manifested as the expenditure of CPU time in kernel mode. Similar was observed in previous versions of Oracle when spinning mutexes.
The reduction in overuse of parallel execution caused a significant reduction in CPU time. But still a large amount of CPU time in kernel / system mode was not clear.
So, the main question: what exactly did this time spend in the core of the operating system? The answer to it could help find additional clues.
Starting "perf top" on the site during this launch produced the following profile:
Running “strace” on these parallel slaves issued the following:
Conclusion: a lot of CPU time is spent on “spinning” spin-locks (a critical section of the code), caused by calls in parallel execution to “semctl” (semaphores). “Strace” indicates that all calls to “semctl” use the same semaphore set (first parameter), which explains the match for this particular set of semaphores (blocking area is a set of semaphores, not a semaphore).
Based on the results of “perf”, an Oracle engineer found a suitable, but unfortunately unpublished and closed 2013 error in version 12.1.0.2. For her, there are three different ways to solve the problem:
1. Starting from “cluster_database” = true: at the same time, Oracle will perform queries differently, which will reduce the number of semaphore calls by two orders of magnitude. We tested this approach, and it showed an immediate load on the core operating time — this is the explanation of why this particular problem is not reproduced in the RAC environment.
2. Run with different settings of “kernel.sem”: Exadata machines came with the following predefined semaphore configuration:
"Ipcs" showed the following semaphore arrays with this configuration when running an instance of Oracle:
In other words, now Oracle has allocated much more sets with fewer semaphores in the set. We tested this configuration instead of “cluster_database = TRUE” and got the same low CPU time.
3. There is a third solution to the problem. Its advantage is: there is no need to change the host configuration, and a configuration can be made for each instance: there is an undocumented parameter “_sem_per_sem_id” , which defines the upper limit on the number of semaphores allocated to a set. If you set an appropriate value for this parameter, such as 100 or 128, the end result should be the same. Oracle will allocate more sets with fewer semaphores in the set, but we did not check this option.
Some ways to use an Oracle instance result in a spin-lock contention at the Linux operating system level (if Oracle is running in single-instance mode) and the recommended semaphore settings are used. This leads to the fact that all semaphore calls go to the same semaphore set. If you force Oracle to allocate more semaphore sets, then the calls are distributed across more sets. Consequently, the competition is significantly reduced.
There are probably indications for Oracle internal use that the default semaphore parameters recommended for large nodes are not optimal for single-instance mode under certain circumstances. But I do not know whether there is a comprehensive official guide.
This is the CPU profile at exactly the same test load as before, using the modified settings of “kernel.sem”:
Also from the AWR report, PX-related wait events have disappeared, which should not be. Performance has improved significantly, also for the complex queries mentioned above.
If you liked the material from Randolph, then on March 24 he will hold his master class in Moscow.
Randolph Geist specializes in correcting errors related to the performance of Oracle databases. One of the best specialists in the world in the area of analyzing the performance of SQL-code and Oracle optimization technologies. Is an Oracle Certified Database Administrator (OCP DBA) versions 8i, 9i and 10g.The following applies only to customers running Oracle on large servers with a large number of cores in single-instance mode (this particular problem is not reproduced in the RAC environment; see below for an explanation of why).
')
These customers include one of my clients, which uses Exadata Xn-8 servers, for example, X4-8 with 120 cores / 240 processors per node (but also reproduced on older and smaller models with 64 cores / 128 processors per node ).
Recently, the base application decided to rewrite. A part of this code performed the same operations for different data sets, in many cases simultaneously. This led to the fact that multiple sessions used parallel query execution. Many queries in this code did not in the best way use parallel execution: queries with a very short duration used parallel execution, leading to several parallel execution starts per second. Such a picture can be seen in the AWR report, which shows that, on average, several parallel execution trees were run every second of an hour:
When the new code was tested on the data and load received from the production system, at first the profile of the processor of such a large node (operating in single-instance mode) looked like this. At the same time, the computer was not loaded by other processes.
As can be seen in Fig., The node's processor is fully loaded, and most of the time is in kernel / system mode. AWR reports showed a significant number of atypical PX wait events:
The “PX Deq: Slave Session Stats” event should not take a lot of time, since we are talking about the transfer of session statistics of slave nodes to the PX coordinator at the time of their completion. Obviously, something significantly slowed down this PX interaction (and this could only be noticed if there was excessive use of parallel execution).
In addition, some of the more complex queries with parallel execution that perform a large number of associations and lead to a significant amount of redistribution of data, occurred as in slow motion. Although almost 100% of the execution time was on the CPU, in Active Session History it can be seen that almost 90% of the time is related to the redistribution operation:
SQL statement execution ASH Summary ----------------------------------------------- | | | |PX SEND/RECEIVE|PX SEND/RECEIVE| PERCENTAGE_CPU| PERCENT| CPU PERCENT| --------------|---------------|---------------| 98| 86| 87| Running the same query with the same execution plan and the same data on the same machine during its idle time showed almost 20 times higher performance, and the redistribution took less than 40% of the time:
SQL statement execution ASH Summary ----------------------------------------------- | | | |PX SEND/RECEIVE|PX SEND/RECEIVE| PERCENTAGE_CPU| PERCENT| CPU PERCENT| --------------|---------------|---------------| 96| 38| 37| Apparently, these requests entered into some kind of competition, which does not occur in Oracle, but outside (at the operating system level), and manifested as the expenditure of CPU time in kernel mode. Similar was observed in previous versions of Oracle when spinning mutexes.
The reduction in overuse of parallel execution caused a significant reduction in CPU time. But still a large amount of CPU time in kernel / system mode was not clear.
So, the main question: what exactly did this time spend in the core of the operating system? The answer to it could help find additional clues.
Analysis
Starting "perf top" on the site during this launch produced the following profile:
PerfTop: 129074 irqs/sec kernel:76.4% exact: 0.0% [1000Hz cycles], (all, 128 CPUs) ------------------------------------------------------------------------------------------------------------------- samples pcnt function DSO _______ _____ ________________________ ___________________________________________________________ 1889395.00 67.8% __ticket_spin_lock /usr/lib/debug/lib/modules/2.6.39-400.128.17.el5uek/vmlinux 27746.00 1.0% ktime_get /usr/lib/debug/lib/modules/2.6.39-400.128.17.el5uek/vmlinux 24622.00 0.9% weighted_cpuload /usr/lib/debug/lib/modules/2.6.39-400.128.17.el5uek/vmlinux 23169.00 0.8% find_busiest_group /usr/lib/debug/lib/modules/2.6.39-400.128.17.el5uek/vmlinux 17243.00 0.6% pfrfd1_init_locals /data/oracle/XXXXXXX/product/11.2.0.4/bin/oracle 16961.00 0.6% sxorchk /data/oracle/XXXXXXX/product/11.2.0.4/bin/oracle 15434.00 0.6% kafger /data/oracle/XXXXXXX/product/11.2.0.4/bin/oracle 11531.00 0.4% try_atomic_semop /usr/lib/debug/lib/modules/2.6.39-400.128.17.el5uek/vmlinux 11006.00 0.4% __intel_new_memcpy /data/oracle/XXXXXXX/product/11.2.0.4/bin/oracle 10557.00 0.4% kaf_typed_stuff /data/oracle/XXXXXXX/product/11.2.0.4/bin/oracle 10380.00 0.4% idle_cpu /usr/lib/debug/lib/modules/2.6.39-400.128.17.el5uek/vmlinux 9977.00 0.4% kxfqfprFastPackRow /data/oracle/XXXXXXX/product/11.2.0.4/bin/oracle 9070.00 0.3% pfrinstr_INHFA1 /data/oracle/XXXXXXX/product/11.2.0.4/bin/oracle 8905.00 0.3% kcbgtcr /data/oracle/XXXXXXX/product/11.2.0.4/bin/oracle 8757.00 0.3% ktime_get_update_offsets /usr/lib/debug/lib/modules/2.6.39-400.128.17.el5uek/vmlinux 8641.00 0.3% kgxSharedExamine /data/oracle/XXXXXXX/product/11.2.0.4/bin/oracle 7487.00 0.3% update_queue /usr/lib/debug/lib/modules/2.6.39-400.128.17.el5uek/vmlinux 7233.00 0.3% kxhrPack /data/oracle/XXXXXXX/product/11.2.0.4/bin/oracle 6809.00 0.2% rworofprFastUnpackRow /data/oracle/XXXXXXX/product/11.2.0.4/bin/oracle 6581.00 0.2% ksliwat /data/oracle/XXXXXXX/product/11.2.0.4/bin/oracle 6242.00 0.2% kdiss_fetch /data/oracle/XXXXXXX/product/11.2.0.4/bin/oracle 6126.00 0.2% audit_filter_syscall /usr/lib/debug/lib/modules/2.6.39-400.128.17.el5uek/vmlinux 5860.00 0.2% cpumask_next_and /usr/lib/debug/lib/modules/2.6.39-400.128.17.el5uek/vmlinux 5618.00 0.2% kaf4reasrp1km /data/oracle/XXXXXXX/product/11.2.0.4/bin/oracle 5482.00 0.2% kaf4reasrp0km /data/oracle/XXXXXXX/product/11.2.0.4/bin/oracle 5314.00 0.2% kopp2upic /data/oracle/XXXXXXX/product/11.2.0.4/bin/oracle 5129.00 0.2% find_next_bit /usr/lib/debug/lib/modules/2.6.39-400.128.17.el5uek/vmlinux 4991.00 0.2% kdstf01001000000km /data/oracle/XXXXXXX/product/11.2.0.4/bin/oracle 4842.00 0.2% ktrgcm /data/oracle/XXXXXXX/product/11.2.0.4/bin/oracle 4762.00 0.2% evadcd /data/oracle/XXXXXXX/product/11.2.0.4/bin/oracle 4580.00 0.2% kdiss_mf_sc /data/oracle/XXXXXXX/product/11.2.0.4/bin/oracle «perf» : 0.36% ora_xxxx [kernel.kallsyms] [k] __ticket_spin_lock | --- __ticket_spin_lock | |--99.98%-- _raw_spin_lock | | | |--100.00%-- ipc_lock | | ipc_lock_check | | | | | |--99.83%-- semctl_main | | | sys_semctl | | | system_call | | | __semctl | | | | | | | --100.00%-- skgpwpost | | | kslpsprns | | | kskpthr | | | ksl_post_proc | | | kxfprienq | | | kxfpqrenq | | | | | | | |--98.41%-- kxfqeqb | | | | kxfqfprFastPackRow | | | | kxfqenq | | | | qertqoRop | | | | kdstf01001010000100km | | | | kdsttgr | | | | qertbFetch | | | | qergiFetch | | | | rwsfcd | | | | qertqoFetch | | | | qerpxSlaveFetch | | | | qerpxFetch | | | | opiexe | | | | kpoal8 Running “strace” on these parallel slaves issued the following:
. . . semctl(1347842, 397, SETVAL, 0x1) = 0 semctl(1347842, 388, SETVAL, 0x1) = 0 semctl(1347842, 347, SETVAL, 0x1) = 0 semctl(1347842, 394, SETVAL, 0x1) = 0 semctl(1347842, 393, SETVAL, 0x1) = 0 semctl(1347842, 392, SETVAL, 0x1) = 0 semctl(1347842, 383, SETVAL, 0x1) = 0 semctl(1347842, 406, SETVAL, 0x1) = 0 semctl(1347842, 389, SETVAL, 0x1) = 0 semctl(1347842, 380, SETVAL, 0x1) = 0 semctl(1347842, 395, SETVAL, 0x1) = 0 semctl(1347842, 386, SETVAL, 0x1) = 0 semctl(1347842, 385, SETVAL, 0x1) = 0 semctl(1347842, 384, SETVAL, 0x1) = 0 semctl(1347842, 375, SETVAL, 0x1) = 0 semctl(1347842, 398, SETVAL, 0x1) = 0 semctl(1347842, 381, SETVAL, 0x1) = 0 semctl(1347842, 372, SETVAL, 0x1) = 0 semctl(1347842, 387, SETVAL, 0x1) = 0 semctl(1347842, 378, SETVAL, 0x1) = 0 semctl(1347842, 377, SETVAL, 0x1) = 0 semctl(1347842, 376, SETVAL, 0x1) = 0 semctl(1347842, 367, SETVAL, 0x1) = 0 semctl(1347842, 390, SETVAL, 0x1) = 0 semctl(1347842, 373, SETVAL, 0x1) = 0 semctl(1347842, 332, SETVAL, 0x1) = 0 semctl(1347842, 379, SETVAL, 0x1) = 0 semctl(1347842, 346, SETVAL, 0x1) = 0 semctl(1347842, 369, SETVAL, 0x1) = 0 semctl(1347842, 368, SETVAL, 0x1) = 0 semctl(1347842, 359, SETVAL, 0x1) = 0 . . . Conclusion: a lot of CPU time is spent on “spinning” spin-locks (a critical section of the code), caused by calls in parallel execution to “semctl” (semaphores). “Strace” indicates that all calls to “semctl” use the same semaphore set (first parameter), which explains the match for this particular set of semaphores (blocking area is a set of semaphores, not a semaphore).
Decision
Based on the results of “perf”, an Oracle engineer found a suitable, but unfortunately unpublished and closed 2013 error in version 12.1.0.2. For her, there are three different ways to solve the problem:
1. Starting from “cluster_database” = true: at the same time, Oracle will perform queries differently, which will reduce the number of semaphore calls by two orders of magnitude. We tested this approach, and it showed an immediate load on the core operating time — this is the explanation of why this particular problem is not reproduced in the RAC environment.
2. Run with different settings of “kernel.sem”: Exadata machines came with the following predefined semaphore configuration:
kernel.sem = 2048 262144 256 256 "Ipcs" showed the following semaphore arrays with this configuration when running an instance of Oracle:
------ Semaphore Arrays -------- key semid owner perms nsems . . . 0xd87a8934 12941057 oracle 640 1502 0xd87a8935 12973826 oracle 640 1502 0xd87a8936 12006595 oracle 640 1502 , , : kernel.sem = 100 262144 256 4096 «ipcs»: ------ Semaphore Arrays -------- key semid owner perms nsems . . . 0xd87a8934 13137665 oracle 640 93 0xd87a8935 13170434 oracle 640 93 0xd87a8936 13203203 oracle 640 93 0xd87a8937 13235972 oracle 640 93 0xd87a8938 13268741 oracle 640 93 0xd87a8939 13301510 oracle 640 93 0xd87a893a 13334279 oracle 640 93 0xd87a893b 13367048 oracle 640 93 0xd87a893c 13399817 oracle 640 93 0xd87a893d 13432586 oracle 640 93 0xd87a893e 13465355 oracle 640 93 0xd87a893f 13498124 oracle 640 93 0xd87a8940 13530893 oracle 640 93 0xd87a8941 13563662 oracle 640 93 0xd87a8942 13596431 oracle 640 93 0xd87a8943 13629200 oracle 640 93 0xd87a8944 13661969 oracle 640 93 0xd87a8945 13694738 oracle 640 93 0xd87a8946 13727507 oracle 640 93 0xd87a8947 13760276 oracle 640 93 0xd87a8948 13793045 oracle 640 93 0xd87a8949 13825814 oracle 640 93 0xd87a894a 13858583 oracle 640 93 0xd87a894b 13891352 oracle 640 93 0xd87a894c 13924121 oracle 640 93 0xd87a894d 13956890 oracle 640 93 0xd87a894e 13989659 oracle 640 93 0xd87a894f 14022428 oracle 640 93 0xd87a8950 14055197 oracle 640 93 0xd87a8951 14087966 oracle 640 93 0xd87a8952 14120735 oracle 640 93 0xd87a8953 14153504 oracle 640 93 0xd87a8954 14186273 oracle 640 93 0xd87a8955 14219042 oracle 640 93 In other words, now Oracle has allocated much more sets with fewer semaphores in the set. We tested this configuration instead of “cluster_database = TRUE” and got the same low CPU time.
3. There is a third solution to the problem. Its advantage is: there is no need to change the host configuration, and a configuration can be made for each instance: there is an undocumented parameter “_sem_per_sem_id” , which defines the upper limit on the number of semaphores allocated to a set. If you set an appropriate value for this parameter, such as 100 or 128, the end result should be the same. Oracle will allocate more sets with fewer semaphores in the set, but we did not check this option.
Conclusion
Some ways to use an Oracle instance result in a spin-lock contention at the Linux operating system level (if Oracle is running in single-instance mode) and the recommended semaphore settings are used. This leads to the fact that all semaphore calls go to the same semaphore set. If you force Oracle to allocate more semaphore sets, then the calls are distributed across more sets. Consequently, the competition is significantly reduced.
There are probably indications for Oracle internal use that the default semaphore parameters recommended for large nodes are not optimal for single-instance mode under certain circumstances. But I do not know whether there is a comprehensive official guide.
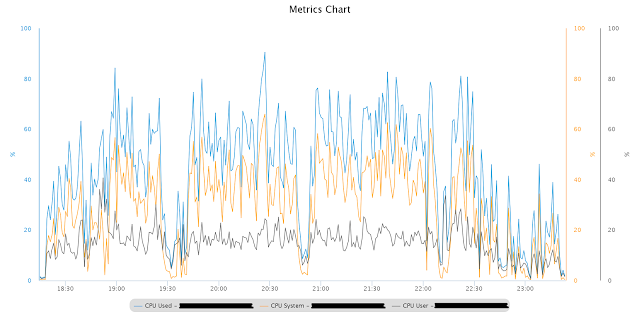
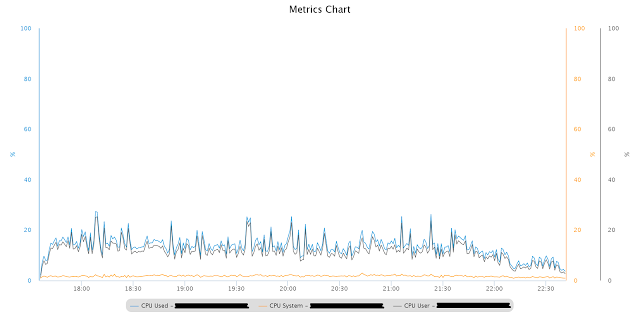
This is the CPU profile at exactly the same test load as before, using the modified settings of “kernel.sem”:
Also from the AWR report, PX-related wait events have disappeared, which should not be. Performance has improved significantly, also for the complex queries mentioned above.
If you liked the material from Randolph, then on March 24 he will hold his master class in Moscow.
Source: https://habr.com/ru/post/278545/
All Articles