Introduction to practical analytics, or what is common in neural networks with diet pills
Today, when neurorevolution is going on in all villages and villages, we are increasingly convinced that neural networks are pure magic and manna-heaven. They began to be used everywhere and even built into Excel . Implicitly, at the sight of a complex task, the following picture appears to many:

And today we will deal with combining the pleasant with the useful: analyze the interesting (practical) analytical task and at the same time analyze a number of factors that determine the (non-) applicability of neural networks to analytical tasks.
')
Imagine, you work as an analyst in some company, which is important for her appearance on Habré (let's call it Mail.com). And then a girl from the PR department comes to you and says: “The managers and I have identified the company's Habra-rating as an important KPI. We have a budget and we want to figure out how to distribute it in order to maximize the Habra-index. We need so that you identify the key factors that influence it and bring out the most sensible strategy. Try any neural networks there. "
During this speech, your eye begins to twitch, but after a couple of minutes you make a list of questions for analysis:
Article structure
If you look at the company profile, the following possible candidates are evident:

Moreover, the parameters may consist of a whole group of variables: karma and employee rating, number of views, favorites, advantages of articles, as well as their number, etc.
And here the most interesting moment: feature construction, and what exactly is the factor determining the Habra index? And why is this so important? For example, in order for the machine learning algorithm to “learn” a real source function, it is necessary that the source function be defined in the correct space, which we do not have!
In a sense, this is a vicious circle - you need to know that space (or subspace) contains key factors in order to restore dependence. But in this situation, if the key factors are known (or their superset), then the problem is actually solved.
A little more formally, it can be described as follows: local patterns are present in our data representation, that is, we have a “correct representation” of all the parameters of the function that we want to learn. If the present function is f (X, Y, Z), and in our representation there is only X and Y, then we are looking for a function in the obviously wrong class F (X, Y) that does not take into account Z. By this, the real tasks differ significantly from Kaggle , nothing is given.
How to determine which factor is important? We know that dependence is deterministic, that is, there is some analytic function by which TM uniquely counts the index. We denote the index function for f , then f depends on the factor x i , if and only if for any x i it is true that:

and with we will call the magnitude of the effect.
This definition does not imply independence between variables. If the variables are dependent, then c for the i -th factor may change depending on the other variables.
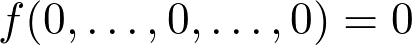
We also know from our experience that the function must satisfy the boundary condition:
An important point: the integration of strong a priori ideas about what the function should be in neural networks is a completely non-trivial task.
Thus, the key observation in question Q 1 : it is necessary to adequately transform the data from the company profile (for example, listed above) and measure the effect, removing the confounding variables one by one. You will also need to check the factorization condition, that is, the variables are independent of each other:

We go to the address: https://habrahabr.ru/companies/ on the very last page and see the most valuable material:

This is a set of companies with zero publications and a small number of employees (one or two) and a small number of subscribers. Choosing two companies - xPrecision and Pocket DS with the same number of employees and the difference in one subscriber, we found a non-zero difference in the Habra index.
Bingo: the first factor determining the Habra index is the number of subscribers ! Note that the growth is clearly not linear - just look at the companies at the beginning, middle and end of the list. It is logical that the function should be saturated with a sufficient number of subscribers so that there are no markups and in general the subscribers factor does not dominate the articles themselves. So the function should grow slowly and at some point go almost to a constant. Hmm, logarithm!
log (2) = 0.69
log (4) = 1.39
log (5) = 1.61
.....
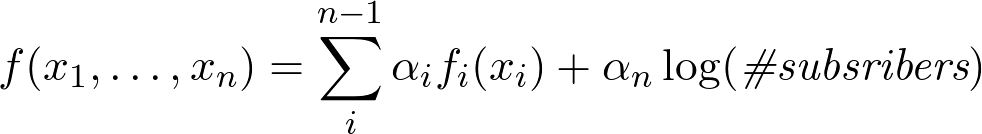
So, we make sure that the function looks like:
Note that the function does not depend on the subscribers karma, since log (8) = 2.08:

Moreover, the coefficient is 1 if the company has no publications, and is 3 if it is (as shown by further analysis).
Consider page 15 and take two companies with the same number of subscribers and different numbers of employees:

The second factor: the logarithm of the number of employees . Again, this is logical, it is impossible for the presence of employees to dominate the articles. Moreover, the multiplier in front of the logarithm also depends on other parameters.
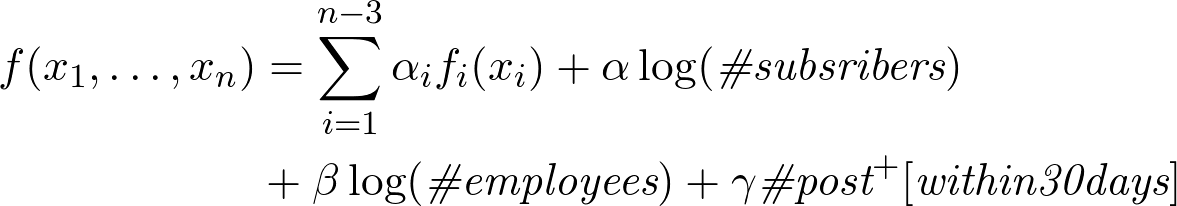
The formula takes the form:

Pluses for old articles (~ more than a month) do not affect the rating:

As we see old articles, even in a big plus, they have no influence.
The most important condition for the use of neural networks is the presence of a significant amount of data in which the "signal is stronger than noise", and the feature space must be appropriate. That is, even if we had a lot of noise points, the existing patterns would be determined through noise. As you can see, we actually have no data at all, all the more clearly demonstrating patterns. And the space of features is small and has some simple structure (it is practically factorized). Thus, Q 2 tells us that you should not use neural networks if you do not have a large amount of adequately marked data.
Conclusion: the data must come from somewhere. Albeit in very small quantities, but they are needed for the accurate formation of hypotheses.
Where can I get quality historical data when they are not? Internet Time Machine !
For example, we determine that the time constant for the rating of corporate blogs is about a month, looking at the company's history:
http://web.archive.org/web/20151220201116/http://habrahabr.ru/company/oda/
We also want to understand how the pluses to articles affect. To do this, we need to find out the rating of the company immediately after the pluses for the articles cease to be taken into account - it’s virtually impossible to find such data among the companies on the list, since practically all parameters should coincide with the pluses of the article.

Thus, the formula takes the form:
Moreover, if we make an analysis of the rating before and after the post, we will understand that if a company has at least one post, then the rating from subscribers and employees triples and the coefficients are as follows:

Note that the estimate of the linear member coefficient is approximate, but the nature of the dependency itself is more important to us than the absolutely exact value of the coefficient.
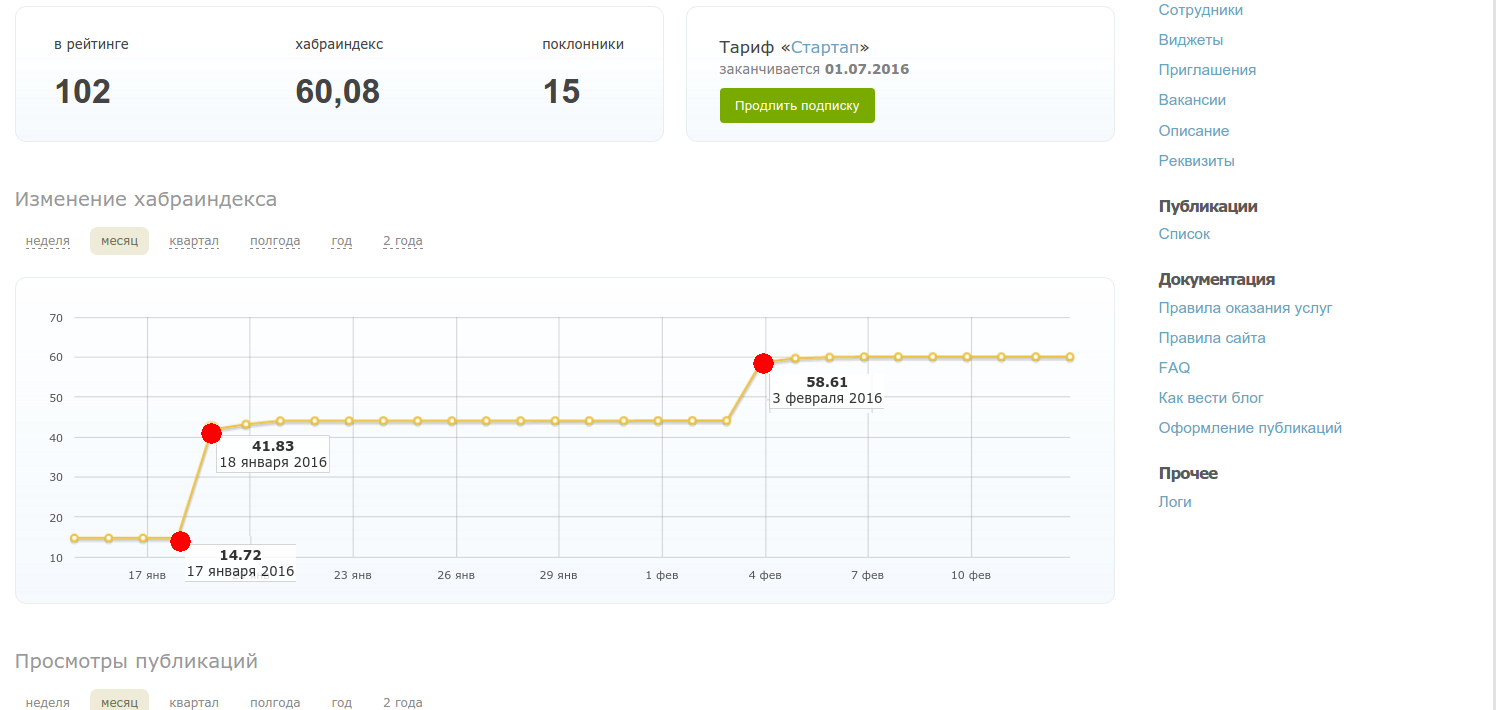
To analyze this effect, it is necessary to collect such non-trivial data that even the Internet Time Machine is powerless. But let's not despair, I just had access to the control panel of one company and there is visible rating in time:
These points correspond to the moment when I had a rating from other articles. The rating of workers means the Habra-index, the analysis shows that again it is logarithmically, with a coefficient approximately equal to 9:
We measure the effect of the karma of the employees as follows, we know that the posts of Mosigra are written by one person and they received the karma exactly at these posts, so I measured the indicators at the moment when they did not have active articles (which was not trivial at all) and got the following:
The author's karma was of the order of ~ 850, hence the dependence on the karma obtained at these posts is also logarithmic with a coefficient approximately equal to ~ 3.
As you can see, information was also collected on the size of the company. The impact of company size on the index turned out to be zero.

This shows that the growth is also logarithmic by the rating of subscribers, and the coefficient equal to three, observed earlier in the presence of articles, appears here:
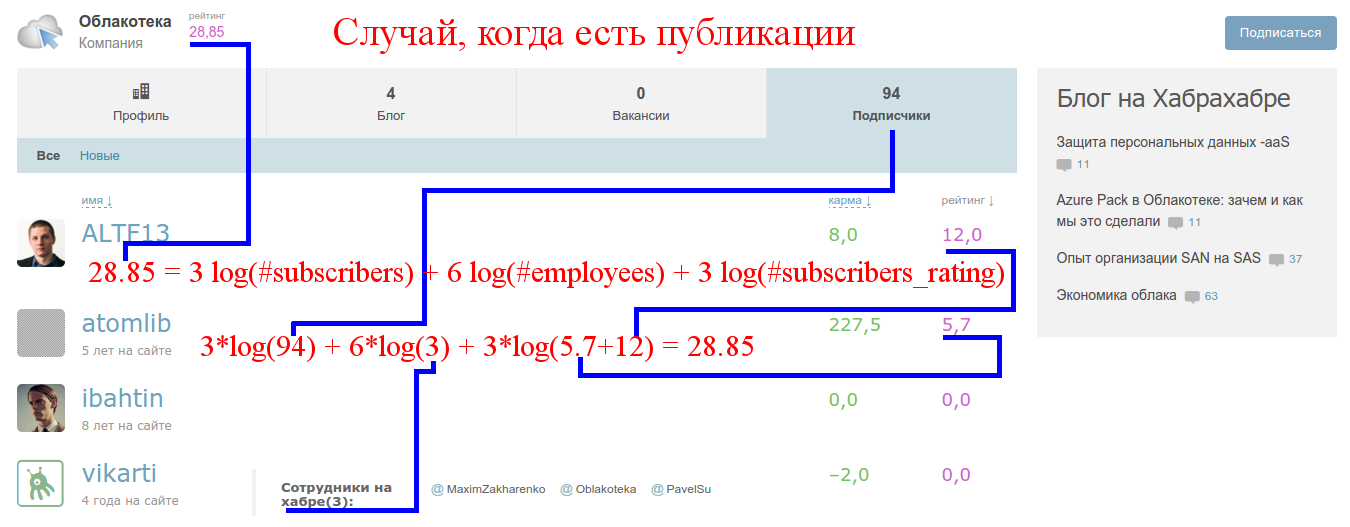
Hence, the formula for the case with publications is:

Moreover, the coefficient in front of a large bracket (where the sum of all logarithms) is 3 if the company has publications and 1 if not. Pluses to posts are considered the same as pluses to posts of users (that is, they are kept for 30 days).
If you skim through the article, it may seem like data collection is only a minor step. In fact, this is actually a key step in solving the problem; it allowed us to significantly narrow the space of hypotheses and get rid of secondary factors that do not affect the index.
It was the data from the Internet Time Machine and the company's time series panel that was not enough for me when I made the first attempt to analyze the dependence of the Habra-index (~ in August 2015) to derive key factors. For example, the interaction of parameters: the coefficient depending on the availability of articles directly affects the group of parameters.
A short list of important points by which you can recognize that a task can potentially be solved by neural networks:
In the problem we have analyzed, none of these conditions is fulfilled.
Having a formula with the main factors determining the Habra index, we can answer the question Q 3 - assess the effectiveness of various blogging strategies.
Important observation: the linear term easily majorizes the remaining logarithmic terms , even at small values of the order of +10. You need to have 25 thousand subscribers to get the effect similar to one article in 10 pluses (or register 150 employees). The effect of an article from +20 by subscribers alone is virtually impossible to obtain.
Strategy one: regularly write many small articles on ~ + 10, for example, every week. Then, the company's rating gets plus ~ 3 * 5 * 10 ~ = 150 and easily passes to the first page, provided that the other parameters have at least some realistic value (for example, 5 employees and 100 subscribers): this strategy is sufficiently effective, See Microsoft's strategy, which is now ranked first. The strategy looks sensible if you are a big company and you have a lot of info leads.
Strategy two: write one or two thoughtful articles per month for 50-100 plus points. You are guaranteed to get to the top and first page of companies. Minus the strategy - to write articles of such quality in such quantity is incredibly difficult. With this, for example, cope in Mosigre, see visualization below.
Attempts to wind up subscribers are not particularly effective strategies, since the logarithm quickly goes to a constant (for any reasonable number of subscribers). It makes sense to register all employees on a blog, but it also has an extremely limited effect, even with Yandex, which has 577 employees, the effect is comparable to one “permanent” article at + 12-13.
And today we will deal with combining the pleasant with the useful: analyze the interesting (practical) analytical task and at the same time analyze a number of factors that determine the (non-) applicability of neural networks to analytical tasks.
')
Imagine, you work as an analyst in some company, which is important for her appearance on Habré (let's call it Mail.com). And then a girl from the PR department comes to you and says: “The managers and I have identified the company's Habra-rating as an important KPI. We have a budget and we want to figure out how to distribute it in order to maximize the Habra-index. We need so that you identify the key factors that influence it and bring out the most sensible strategy. Try any neural networks there. "
During this speech, your eye begins to twitch, but after a couple of minutes you make a list of questions for analysis:
- Q 1 : What are the key factors affecting the company's Habra index?
- Q 2 : Where to find data?
- Q 3 : What will be the optimal strategy according to the restored empirical dependence?
Article structure
- Identify potential factors
- Data collection
- The effect of karma and rating of subscribers and employees
- Final formula
- Analysis of the applicability of neural networks
- Analysis of the optimal strategy
Yellow offtopic: serious passions around Habra blogging companies
Sometimes the whole debate about how to drive corporate blogs, for example, is such an old discussion.
Initial comment:

And the answer ( from here ):

In general, the seriousness of the approach is already visible from the company's presentations on the topic:

Initial comment:
And the answer ( from here ):
In general, the seriousness of the approach is already visible from the company's presentations on the topic:
Identify potential factors
If you look at the company profile, the following possible candidates are evident:
Moreover, the parameters may consist of a whole group of variables: karma and employee rating, number of views, favorites, advantages of articles, as well as their number, etc.
And here the most interesting moment: feature construction, and what exactly is the factor determining the Habra index? And why is this so important? For example, in order for the machine learning algorithm to “learn” a real source function, it is necessary that the source function be defined in the correct space, which we do not have!
In a sense, this is a vicious circle - you need to know that space (or subspace) contains key factors in order to restore dependence. But in this situation, if the key factors are known (or their superset), then the problem is actually solved.
The correct representation of the space characteristics (feature space)
A little more formally, it can be described as follows: local patterns are present in our data representation, that is, we have a “correct representation” of all the parameters of the function that we want to learn. If the present function is f (X, Y, Z), and in our representation there is only X and Y, then we are looking for a function in the obviously wrong class F (X, Y) that does not take into account Z. By this, the real tasks differ significantly from Kaggle , nothing is given.
Scientific method spear
How to determine which factor is important? We know that dependence is deterministic, that is, there is some analytic function by which TM uniquely counts the index. We denote the index function for f , then f depends on the factor x i , if and only if for any x i it is true that:
and with we will call the magnitude of the effect.
This definition does not imply independence between variables. If the variables are dependent, then c for the i -th factor may change depending on the other variables.
We also know from our experience that the function must satisfy the boundary condition:
An important point: the integration of strong a priori ideas about what the function should be in neural networks is a completely non-trivial task.
Thus, the key observation in question Q 1 : it is necessary to adequately transform the data from the company profile (for example, listed above) and measure the effect, removing the confounding variables one by one. You will also need to check the factorization condition, that is, the variables are independent of each other:
Data collection
We go to the address: https://habrahabr.ru/companies/ on the very last page and see the most valuable material:
Followers
This is a set of companies with zero publications and a small number of employees (one or two) and a small number of subscribers. Choosing two companies - xPrecision and Pocket DS with the same number of employees and the difference in one subscriber, we found a non-zero difference in the Habra index.
Bingo: the first factor determining the Habra index is the number of subscribers ! Note that the growth is clearly not linear - just look at the companies at the beginning, middle and end of the list. It is logical that the function should be saturated with a sufficient number of subscribers so that there are no markups and in general the subscribers factor does not dominate the articles themselves. So the function should grow slowly and at some point go almost to a constant. Hmm, logarithm!
log (2) = 0.69
log (4) = 1.39
log (5) = 1.61
.....
So, we make sure that the function looks like:
Note that the function does not depend on the subscribers karma, since log (8) = 2.08:
Moreover, the coefficient is 1 if the company has no publications, and is 3 if it is (as shown by further analysis).
Employees
Consider page 15 and take two companies with the same number of subscribers and different numbers of employees:
The second factor: the logarithm of the number of employees . Again, this is logical, it is impossible for the presence of employees to dominate the articles. Moreover, the multiplier in front of the logarithm also depends on other parameters.
The formula takes the form:
Influence of old merit (by articles)
Pluses for old articles (~ more than a month) do not affect the rating:
As we see old articles, even in a big plus, they have no influence.
Lack of data
The most important condition for the use of neural networks is the presence of a significant amount of data in which the "signal is stronger than noise", and the feature space must be appropriate. That is, even if we had a lot of noise points, the existing patterns would be determined through noise. As you can see, we actually have no data at all, all the more clearly demonstrating patterns. And the space of features is small and has some simple structure (it is practically factorized). Thus, Q 2 tells us that you should not use neural networks if you do not have a large amount of adequately marked data.
Conclusion: the data must come from somewhere. Albeit in very small quantities, but they are needed for the accurate formation of hypotheses.
Where can I get quality historical data when they are not? Internet Time Machine !
For example, we determine that the time constant for the rating of corporate blogs is about a month, looking at the company's history:
http://web.archive.org/web/20151220201116/http://habrahabr.ru/company/oda/
We also want to understand how the pluses to articles affect. To do this, we need to find out the rating of the company immediately after the pluses for the articles cease to be taken into account - it’s virtually impossible to find such data among the companies on the list, since practically all parameters should coincide with the pluses of the article.
Thus, the formula takes the form:
Moreover, if we make an analysis of the rating before and after the post, we will understand that if a company has at least one post, then the rating from subscribers and employees triples and the coefficients are as follows:
Note that the estimate of the linear member coefficient is approximate, but the nature of the dependency itself is more important to us than the absolutely exact value of the coefficient.
Determine the effect of karma and the rating of subscribers and employees.
Employee rating
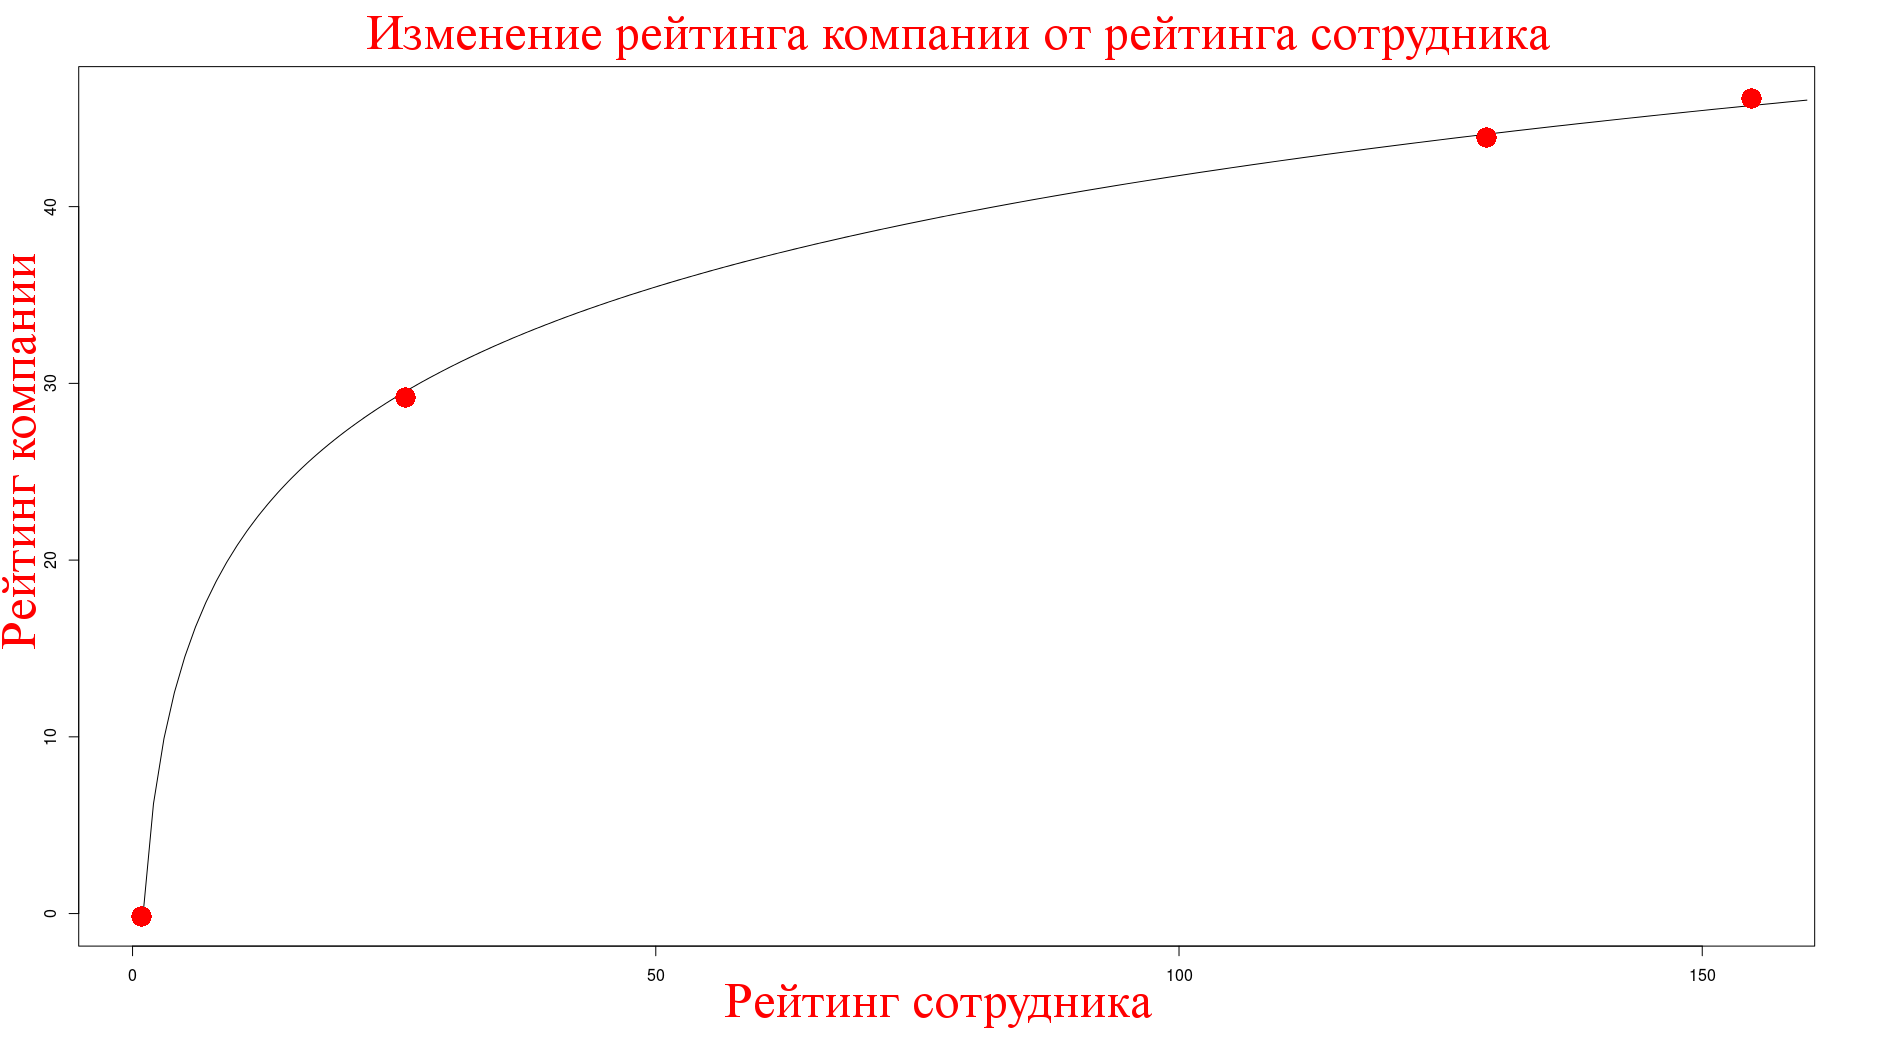
To analyze this effect, it is necessary to collect such non-trivial data that even the Internet Time Machine is powerless. But let's not despair, I just had access to the control panel of one company and there is visible rating in time:
These points correspond to the moment when I had a rating from other articles. The rating of workers means the Habra-index, the analysis shows that again it is logarithmically, with a coefficient approximately equal to 9:
Employee Karma Received in Corporate Posts
We measure the effect of the karma of the employees as follows, we know that the posts of Mosigra are written by one person and they received the karma exactly at these posts, so I measured the indicators at the moment when they did not have active articles (which was not trivial at all) and got the following:
name,blog,employees,subscribers,rating,size ..... mos_igra,115,10,4877,59.48,101_200 The author's karma was of the order of ~ 850, hence the dependence on the karma obtained at these posts is also logarithmic with a coefficient approximately equal to ~ 3.
As you can see, information was also collected on the size of the company. The impact of company size on the index turned out to be zero.
Subscribers Rating
This shows that the growth is also logarithmic by the rating of subscribers, and the coefficient equal to three, observed earlier in the presence of articles, appears here:
Final formula
Hence, the formula for the case with publications is:
Moreover, the coefficient in front of a large bracket (where the sum of all logarithms) is 3 if the company has publications and 1 if not. Pluses to posts are considered the same as pluses to posts of users (that is, they are kept for 30 days).
About the importance of collecting quality data
If you skim through the article, it may seem like data collection is only a minor step. In fact, this is actually a key step in solving the problem; it allowed us to significantly narrow the space of hypotheses and get rid of secondary factors that do not affect the index.
It was the data from the Internet Time Machine and the company's time series panel that was not enough for me when I made the first attempt to analyze the dependence of the Habra-index (~ in August 2015) to derive key factors. For example, the interaction of parameters: the coefficient depending on the availability of articles directly affects the group of parameters.
Analysis of the applicability of neural networks
A short list of important points by which you can recognize that a task can potentially be solved by neural networks:
- There is a collected (marked up) dataset, of substantial size (the one in which the signal is clearly stronger than noise *)
- The space of features of substantial size (imagine that each pixel together with the color in the picture is one input feature, as well as a combination and superposition, collectively, we are talking about 1M + model parameters)
- Features and patterns have a hierarchical structure - present the analysis of numbers: the points are assembled into straight lines, the combination of straight lines into a squiggle, squiggles of digits (you can simply think of the network as some kind of compressive display)
- There are no significant a priori ideas about the nature of dependence, if we know that dependence is linear (quadratic, seasonal, generally not too variable function), then it is probably worth looking for solutions in this class right away
- No analysis of the resulting dependency is required. When we want to get a black box predicting actions is quite a good solution - “this move to GO is intuitively good”, but if we need to perform a dependency analysis, this turns into a completely non-trivial task for neural networks (for example, see this article )
In the problem we have analyzed, none of these conditions is fulfilled.
Still, what have diet pills?
This is nothing more than an allusion to the "magic pill", which will come to the rescue and solve the problem. The point is that in real life the tasks are multifaceted and are not solved by a single universal hammer, but require analysis and selection of the right tool. Even if the symptoms in two cases coincide, the causation may be different and may require two completely different solutions.
Otherwise, it all starts to remind the approach of the underpowered gnomes.

Otherwise, it all starts to remind the approach of the underpowered gnomes.
Analysis of the optimal strategy
Having a formula with the main factors determining the Habra index, we can answer the question Q 3 - assess the effectiveness of various blogging strategies.
Important observation: the linear term easily majorizes the remaining logarithmic terms , even at small values of the order of +10. You need to have 25 thousand subscribers to get the effect similar to one article in 10 pluses (or register 150 employees). The effect of an article from +20 by subscribers alone is virtually impossible to obtain.
Strategy one: regularly write many small articles on ~ + 10, for example, every week. Then, the company's rating gets plus ~ 3 * 5 * 10 ~ = 150 and easily passes to the first page, provided that the other parameters have at least some realistic value (for example, 5 employees and 100 subscribers): this strategy is sufficiently effective, See Microsoft's strategy, which is now ranked first. The strategy looks sensible if you are a big company and you have a lot of info leads.
Strategy one: several small articles
Strategy two: write one or two thoughtful articles per month for 50-100 plus points. You are guaranteed to get to the top and first page of companies. Minus the strategy - to write articles of such quality in such quantity is incredibly difficult. With this, for example, cope in Mosigre, see visualization below.
Strategy two: one or two detailed articles
Attempts to wind up subscribers are not particularly effective strategies, since the logarithm quickly goes to a constant (for any reasonable number of subscribers). It makes sense to register all employees on a blog, but it also has an extremely limited effect, even with Yandex, which has 577 employees, the effect is comparable to one “permanent” article at + 12-13.
Source: https://habr.com/ru/post/278409/
All Articles