Dollar
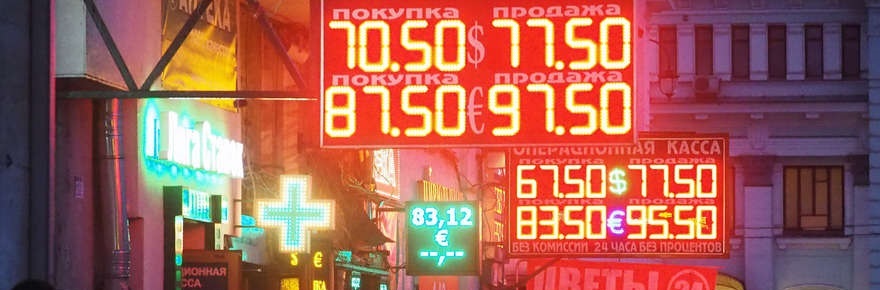
For the last two years, the whole country has been closely following the dollar rate. News bulletins are full of loud reports about the dollar. Everyone is talking about the dollar. And what if we are against the background of hot interest, let's look at how the dollar price is formed, let's see who and how trades currency? All the results presented in this article were obtained on the basis of the official trading data full orders log (full order book) purchased on the Moscow Exchange . We will show the real trading from the inside. In parallel, we will get acquainted with the standard methods of market analysis. This kind of analytics costs a lot of money and a limited number of “companies” can allow it.
Java data analysis tool. Analyzed stock instrument - USDRUB_TOM . Our task is to extract curious details from the available data and try to draw certain conclusions.
All over the world, foreign exchange transactions are mainly carried out on the interbank market and on specialized electronic trading platforms where the largest banks, treasuries and so on are connected. Typical representatives of such sites FXall or Atriax.
')
In Russia, the currency is predominantly traded on the stock exchange, where huge amounts are held. The share of the Moscow Exchange accounts for 45-50% of the total world trading volume for the pair USD / RUB. This is a huge share, a few countries can boast such a share. Therefore, the course of the Moscow Exchange, without exaggeration, is a world benchmark. The exchange rate of the Central Bank is formed at the exchange rate, the settlement prices of futures contracts are based on exchange fixing ... Hundreds of banks are connected and trading to the foreign exchange market, the Central Bank comes out with interventions and buys the currency, exporters change the currency, the largest European and American investment companies are connected.
Further, along the way, I will use the terms "spread" and "glass" (quotes). Who hears for the first time, take a look.
The explanation on the fingers
Spread - the difference between the purchase and sale price. In the exchanger, the purchase price is 75 rubles, the sale price is 80 rubles. Here the spread is 5p.
A glass of quotes is the entire list of buyers and sellers on the market, arranged by price. A glass of quotes briefly and clearly describes the state of the market and looks like this. In the terminals we usually see 10-20 price levels. And they can be much more. For a dollar, this is about 200-300 levels. And in 1 second the glass can be changed tens or hundreds of times.

The trading mechanism is well known to many: the newly arrived order, depending on the price, becomes a queue (in a glass). As soon as the counter application arrives that satisfies ours, it is executed, a transaction occurs. Otherwise, it remains in the queue. This application can be withdrawn before it is fulfilled.
A glass of quotes is the entire list of buyers and sellers on the market, arranged by price. A glass of quotes briefly and clearly describes the state of the market and looks like this. In the terminals we usually see 10-20 price levels. And they can be much more. For a dollar, this is about 200-300 levels. And in 1 second the glass can be changed tens or hundreds of times.
The trading mechanism is well known to many: the newly arrived order, depending on the price, becomes a queue (in a glass). As soon as the counter application arrives that satisfies ours, it is executed, a transaction occurs. Otherwise, it remains in the queue. This application can be withdrawn before it is fulfilled.
We have on hand data on the trading process for February 2, 2016, containing all bids that are set, deleted or executed in the transaction. They can track the life of each application. The data is impersonal, we do not know who submitted the applications, but we see all its main parameters: time, price, volume, direction, id ... In the previous post I described in detail the format of this data.
Let's remember what was the second of February. Nothing special, a normal day without features and anomalies. And so much the better.
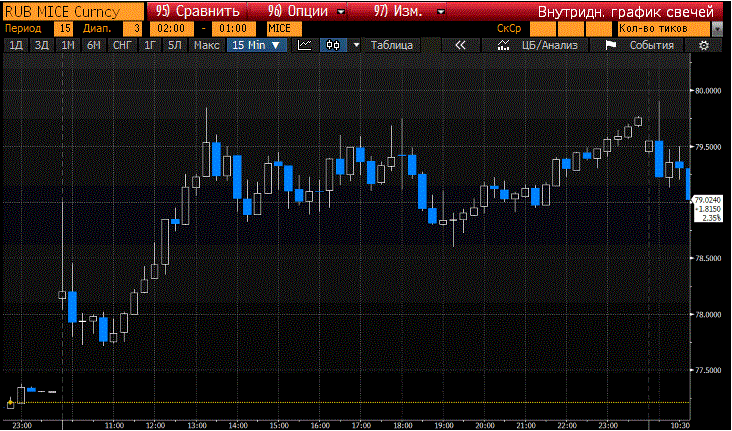
Let's start with the simple. On this day, 105 thousand transactions were made for a total of 504 billion ₽ . Price movement is higher on the chart.
1. Let's see, what volumes of orders are bidders submit most often? The minimum possible order amount is $ 1000 (1K $).

As you can see, the overwhelming majority of them trade in volumes of $ 50K and $ 100K, in the third place a million bucks ($ 1M). Yes, it's all big. I wonder what the picture will be for stocks or futures, where a lot of nat. individuals? Physicists have been admitted to the foreign exchange market relatively recently;
2. Orders come to the trading system. And after what time they are executed?

Rather smooth distribution. Surprisingly, more than half of trades are executed in less than a second. Here it is necessary to exclude the second participant in the transaction, because his application is executed instantly. And even more interesting is the picture within a few milliseconds, where a very large number of transactions take place. High frequency robots? How do most applications get to the right place in a few milliseconds? The question is open, there are opinions ?! Offer.
3. Orders arrive in the trading system and are deleted by the participant. So after what time are most applications filmed?

Immediately striking is the fact that an overwhelming number of applications are withdrawn in 1-2 milliseconds. We also see that participants like whole numbers. Peaks on the graph clearly follow with an interval of 50 milliseconds (no more, no less).
I suppose that most people in the algorithms like to use integers (50, 100, 200 ...). Then, looking intently at the spreading of the peaks, one can estimate the remoteness of the location of the bidders due to the existence of delays in the data. If all participants were located in the colocation zone (in the same room with the trading system, microscopic delay), then we would see peaks in the form of sticks, without spreading. Your thoughts?
4. Each transaction has an initiator: the seller or the buyer. Sold more or bought more?

Data from 10:00 until closing time is 23:50. The ratio of sellers and buyers directly depends on the price movement. Here on the graph we see the nature of applications, i.e. as participants indicate the price in the application.
5. What is the volume of transactions?

All the same $ 50K and $ 100K, also there were volumes 5K $ and 10K $.
Piece of magic code
All of the above distribution obtained by the tool HashMap. Main couple of lines of code:
if(mySet.containsKey(key)){ mySet.put(key, mySet.get(key)+1); }else{ mySet.put(key, 1); } Next comes the heavy artillery. For me, the most interesting part. For further metrics you need to be able to build a glass of quotes. How to build a glass, I described in the previous article with examples.
Every 10 seconds we reproduced a glass of quotes and took readings. The results in paragraphs 6 and 7.
6. Picture the depth of the market. And how many goods?

The top chart is the one you want to buy. Lower - the amount that they want to sell. A large trade volume always moves the price up or down. The meaning of the picture is to understand how much the transaction will shift the price by 0.5% or 1% for a certain time. The picture makes it clear when it is better to enter the market in order to realize a large volume.
Example (see top chart). If at 12:00 we would like to sell the currency in the amount of 50M $, the price would go down by 1%. And if the same thing was done at 14:30, the price would have left a maximum of 0.5% (here is our savings).
7. Picture the depth of the market. Inverse problem

Gives an answer to the question: how much will the price move depending on a certain volume? A picture for the whole trading day. Before a large participant comes to a particular market, he first studies the data, conducting similar research. If the market is small, there is no sense to enter.
Conclusion
From the historical data you can still pull a lot of interesting things. You can study the habits of the entire ensemble of participants in certain events and improve their trading algorithms.
Now we have an idea who and how trades currency, what volumes are spinning and at what speeds. Felt the bottom of the dollar market.
Well that's all. Thank you for attention. If there are thoughts / assumptions on any of the items, write.
Special thanks to one good habraiser who helped with data visualization. He promised to write a separate post on visualization on the example of financial information using Python + MatPlotLib.
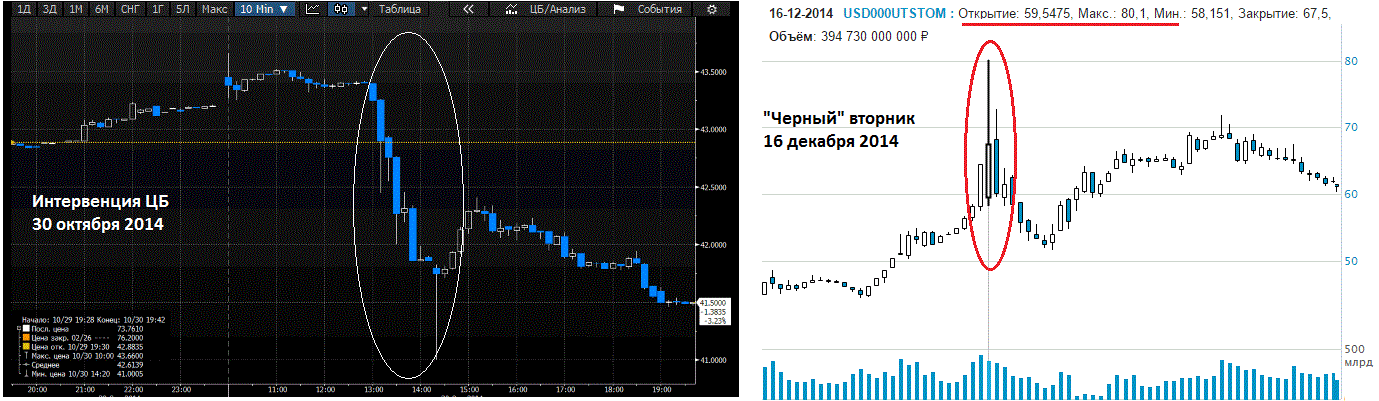
In the next part, we dive even deeper and consider some interesting situations on the market (the intervention of the Central Bank and Black Tuesday). Any wishes ?! I'll keep in mind the next article, let me know
Source: https://habr.com/ru/post/278403/
All Articles