Habr dies?
I love to write texts based on the projects that I do. Over the last year I posted more than 20 posts on Habré. I was constantly amazed at how little intelligent comments could be obtained here. There are a lot of views, but few comments and most are out of business. Recently, I began to notice, bumping into old posts for 2012, 2013, that the discussion in them seemed to be more meaningful. I decided to check it out quantitatively. I downloaded the info on all posts for all the years and built some simple graphs. What I saw surprised me and even a little scared. I decided to place the observations here, to check whether I draw the right conclusions and whether I took everything into account.
For all the posts published on Habré, I collected publication dates, number of views, number of likes and dislikes, number of stars and comments, a list of hubs and the names of company blogs. In the course of pumping, I learned that the number of pluses and minus ones can be fractional and even negative, the post can be published on blogs of several companies and may not have an author . If anything, the table can be downloaded from the repository: github.com/alexanderkuk/analyze-habr/blob/master/data/posts.csv

')
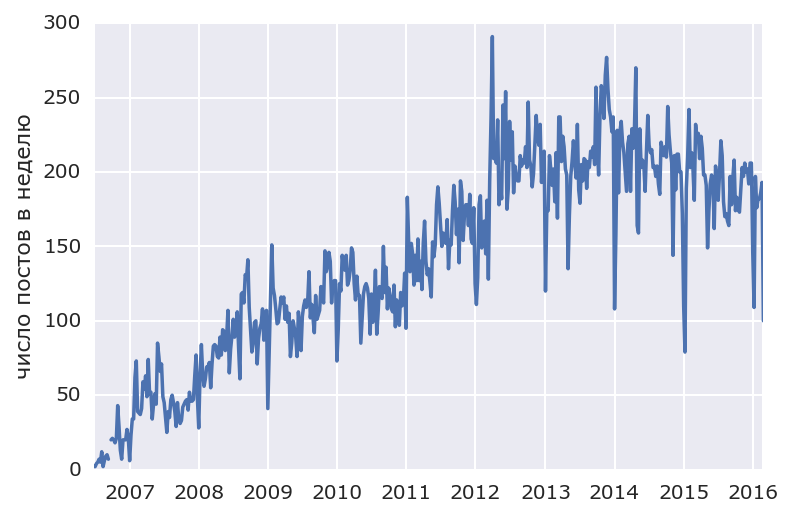
First of all, I looked at how the total number of posts changed over time. It stopped growing in 2013 and drops slightly from 2014, which is already a bit alarming:
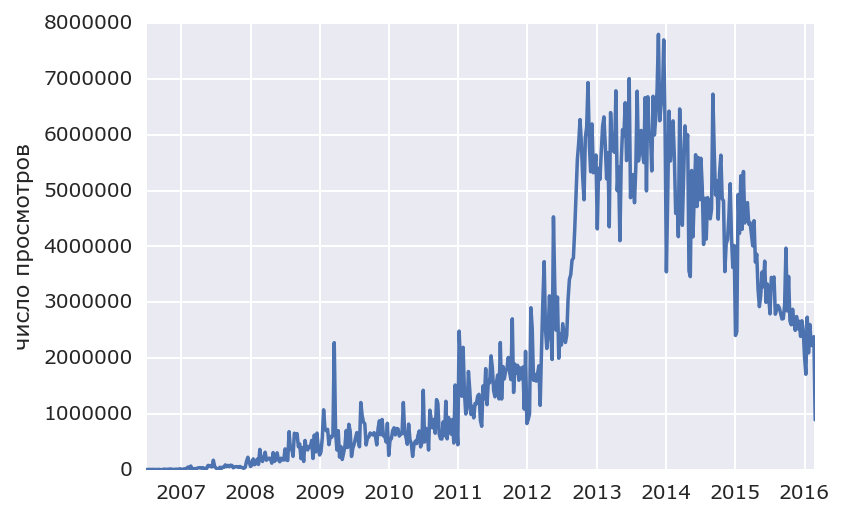
Then I built the same schedule for the total number of views and was scared. Since 2014, it has dropped 3.5 times:
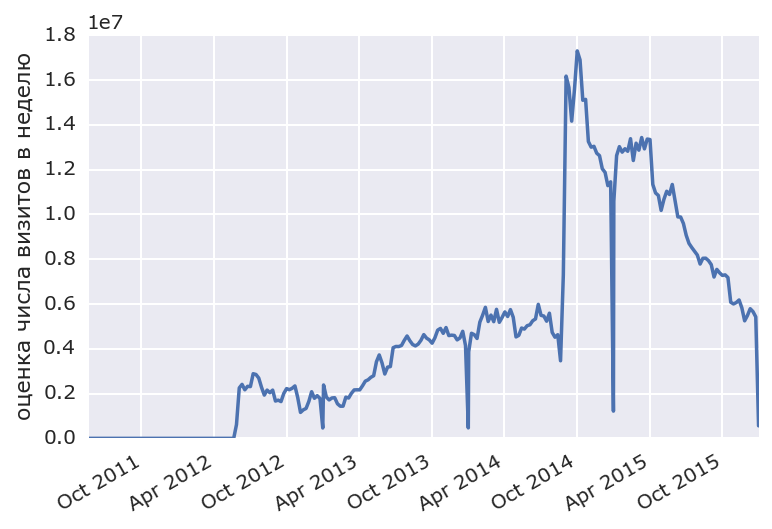
This is a serious statement, so I decided to check with Similarweb .
They give only estimates, but in 2014, 2015 the trend is also clearly negative:
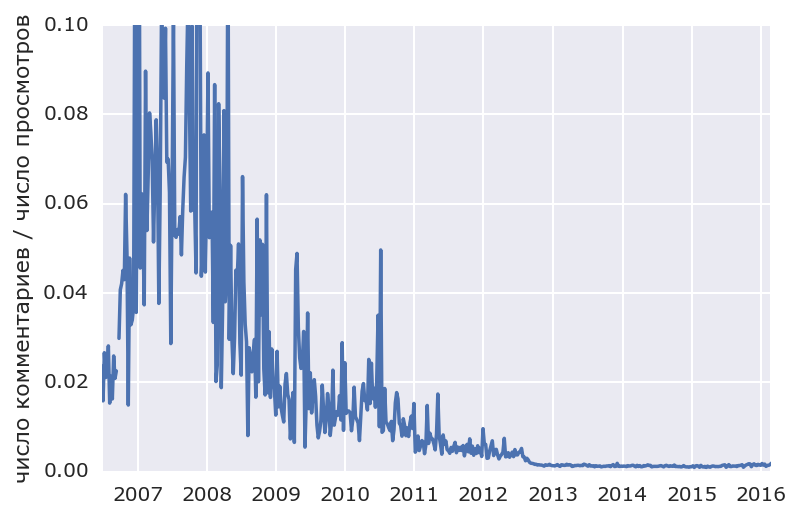
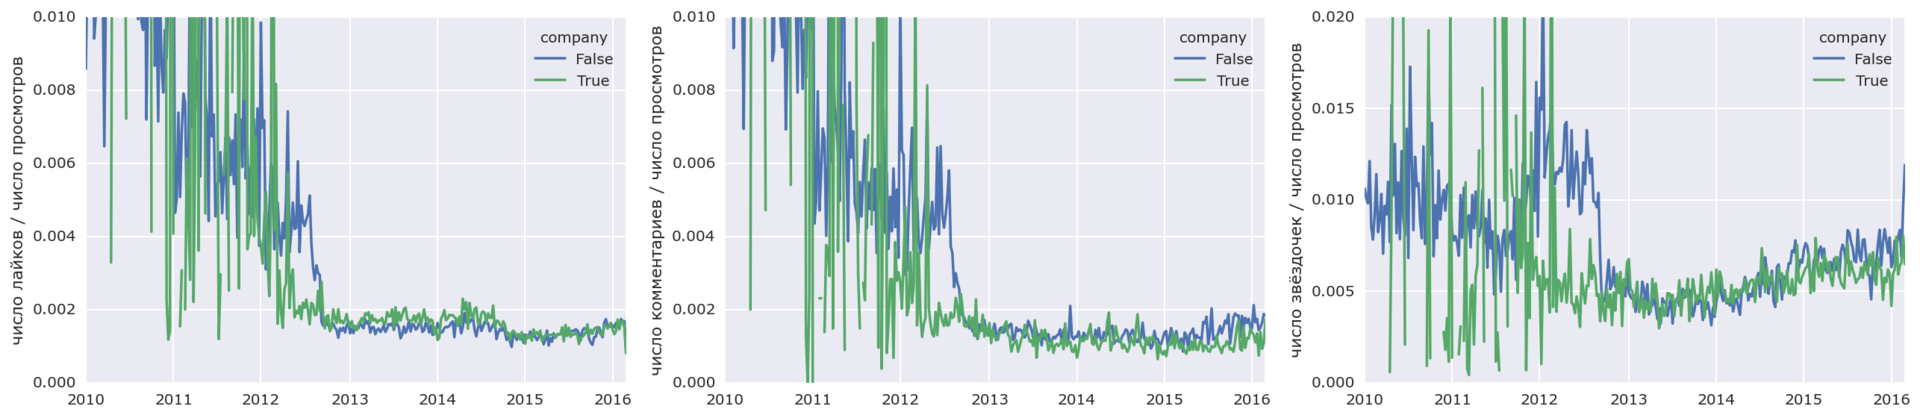
The ratio of comments to the number of views in time looks interesting. Since 2008, it falls, and in the middle of 2012 the step almost disappears.
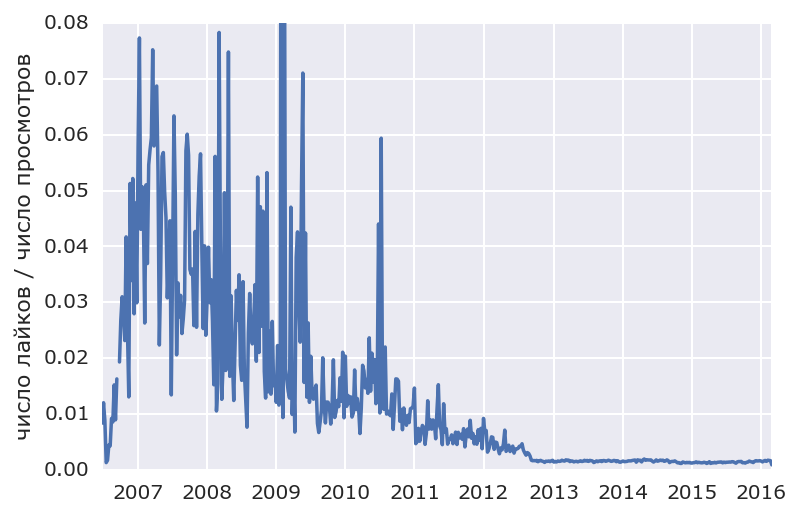
Share likes also behaves:
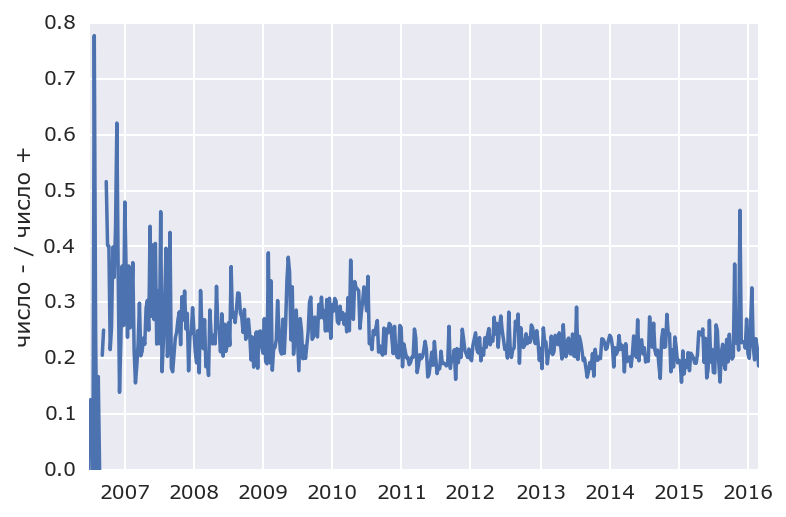
By the way, the attitude of likes and dislikes almost does not change. Cons are always about 25% of the benefits:
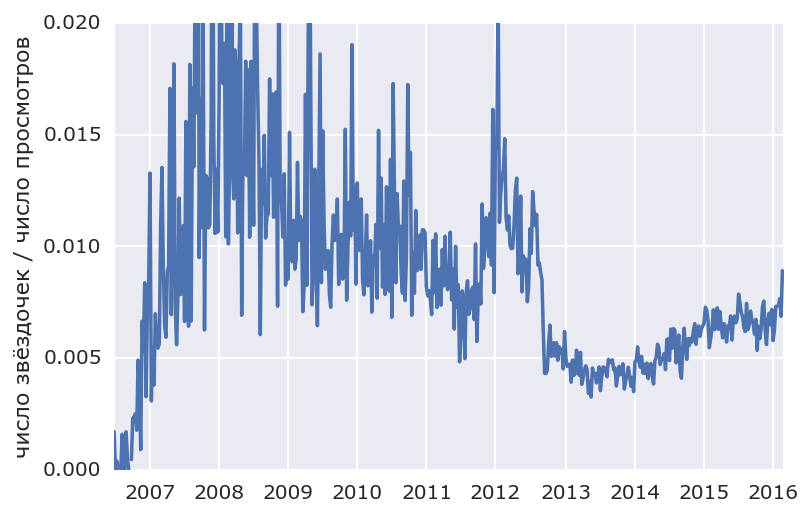
The proportion of stars behaves interestingly. For some reason, it has been growing smoothly lately. Why is that?
In short, in mid-2012, something happened. Maybe someone knows the answer from the story? I did not use Habrom then and therefore try to find a clue in the data.
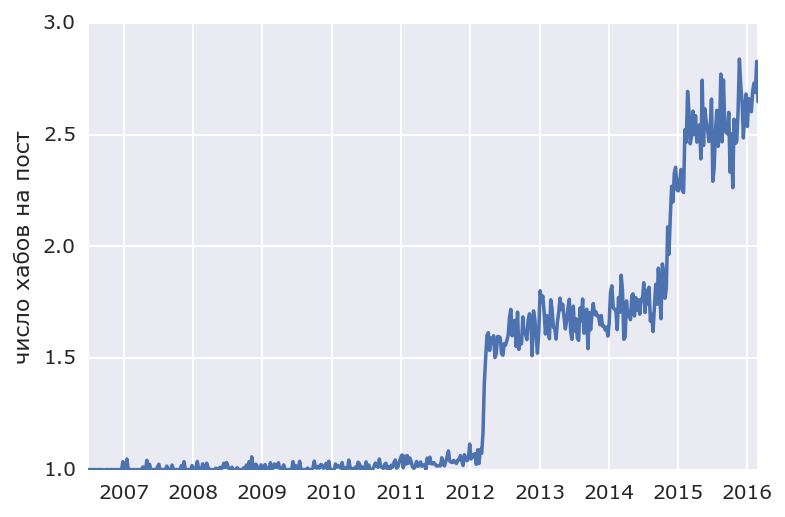
First, I noticed that the step changed the average number of hubs in which posts were simultaneously placed. Apparently, raised the limits?
Secondly, and more importantly, blogs of companies appeared:
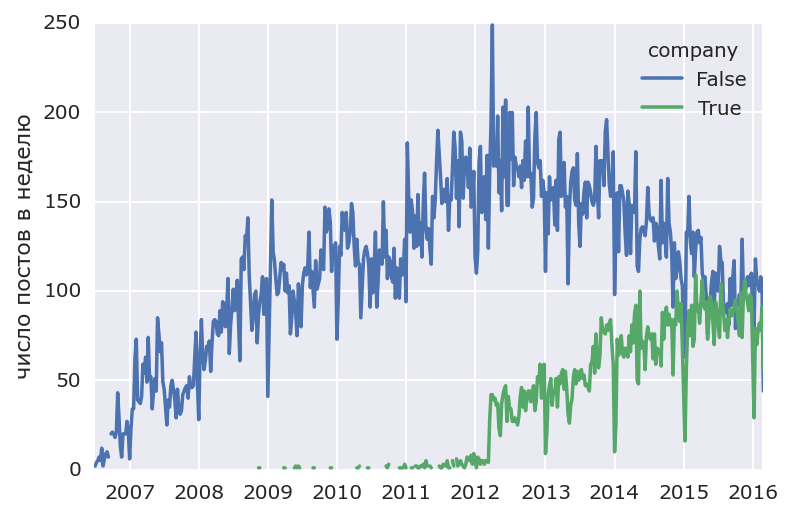
Did they really have such an impact?
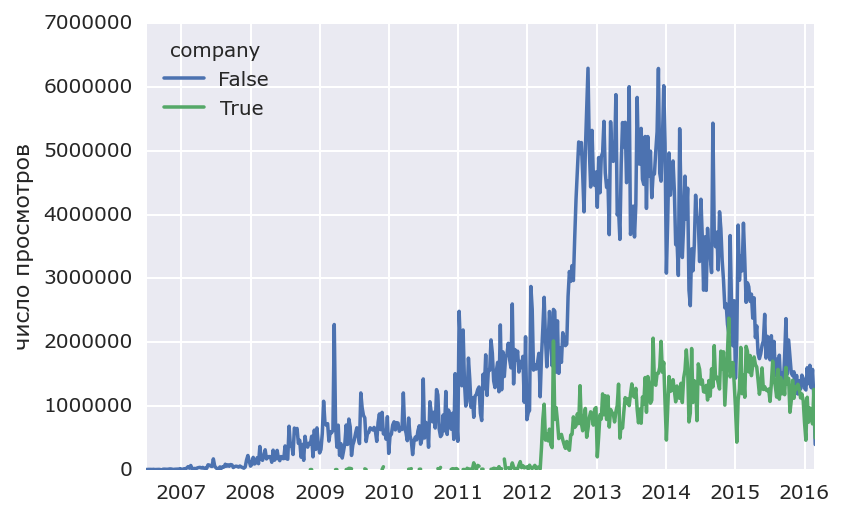
By the way, the number of views at the posts of companies, which all the time slowly grew, has also been falling recently. This is the most frightening:
Shares of likes, asterisks, and comments from regular posts and from company posts are almost the same. This is also unexpected, I thought commercial posts accept worse:
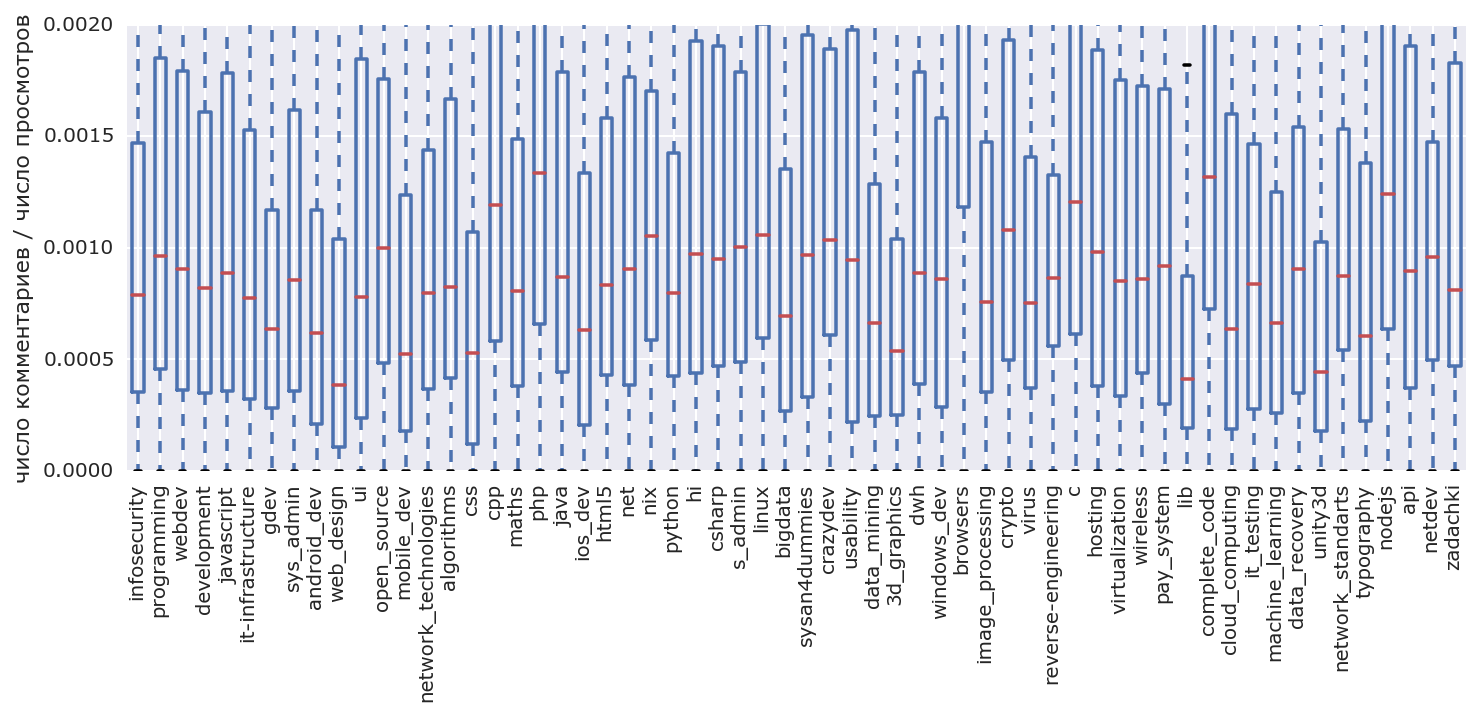
I also thought that maybe the situation is worse in the hubs, in which I write, and in others it is normally commented. Yes, it is valid in the big data and data mining of comments less, but only slightly.
In short, is it really that bad?
If anything, all the calculations in the repository github.com/alexanderkuk/analyze-habr/blob/master/notes.ipynb
Update: all the charts in which the number of views before 2012 appears are wrong. Check out habrahabr.ru/post/278325/#comment_8788985
For all the posts published on Habré, I collected publication dates, number of views, number of likes and dislikes, number of stars and comments, a list of hubs and the names of company blogs. In the course of pumping, I learned that the number of pluses and minus ones can be fractional and even negative, the post can be published on blogs of several companies and may not have an author . If anything, the table can be downloaded from the repository: github.com/alexanderkuk/analyze-habr/blob/master/data/posts.csv
')
First of all, I looked at how the total number of posts changed over time. It stopped growing in 2013 and drops slightly from 2014, which is already a bit alarming:
Then I built the same schedule for the total number of views and was scared. Since 2014, it has dropped 3.5 times:
This is a serious statement, so I decided to check with Similarweb .
They give only estimates, but in 2014, 2015 the trend is also clearly negative:
The ratio of comments to the number of views in time looks interesting. Since 2008, it falls, and in the middle of 2012 the step almost disappears.
Share likes also behaves:
By the way, the attitude of likes and dislikes almost does not change. Cons are always about 25% of the benefits:
The proportion of stars behaves interestingly. For some reason, it has been growing smoothly lately. Why is that?
In short, in mid-2012, something happened. Maybe someone knows the answer from the story? I did not use Habrom then and therefore try to find a clue in the data.
First, I noticed that the step changed the average number of hubs in which posts were simultaneously placed. Apparently, raised the limits?
Secondly, and more importantly, blogs of companies appeared:
Did they really have such an impact?
By the way, the number of views at the posts of companies, which all the time slowly grew, has also been falling recently. This is the most frightening:
Shares of likes, asterisks, and comments from regular posts and from company posts are almost the same. This is also unexpected, I thought commercial posts accept worse:
I also thought that maybe the situation is worse in the hubs, in which I write, and in others it is normally commented. Yes, it is valid in the big data and data mining of comments less, but only slightly.
In short, is it really that bad?
If anything, all the calculations in the repository github.com/alexanderkuk/analyze-habr/blob/master/notes.ipynb
Update: all the charts in which the number of views before 2012 appears are wrong. Check out habrahabr.ru/post/278325/#comment_8788985
Source: https://habr.com/ru/post/278325/
All Articles