Experiment: the creation of an algorithm for predicting the behavior of stock indices
Scientists at the Faculty of Computer Science from the Azad Islamic University, located in the UAE, published a paper on predicting the behavior of stock indices based on neural network technologies, genetic algorithms and data mining using reference vectors. We bring to your attention the main thoughts of this document.
Introduction
One of the most popular areas of financial analysis in recent years is the prediction of stock prices and the behavior of stock indices based on data from previous trading periods. To obtain any relevant results, you must use the appropriate tools and correct algorithms.
')
Scientists have set as their goal the development of special software that could generate predictions of the behavior of stock indices using predictive algorithms and mathematical rules.
Stock indices themselves are unpredictable, since they depend not only on economic events, but they are also influenced by the political situation in different parts of the world. Therefore, it is extremely difficult to develop a mathematical model for processing such unpredictable, nonlinear and non-parametric time series.
When working on the stock market using two types of analysis.
1) Technical analysis
Used for short-term financial strategies. It is used to predict price changes based on patterns and price changes in a similar way in the past. As a rule, price charts are analyzed on which patterns of certain patterns in price dynamics stand out. In addition to studying the dynamics of price changes, technical analysis uses information on trading volumes and other statistical data.
2) Fundamental analysis
Fundamental analysis is used for long-term investment strategies. It implies using for forecasting the stock price of a certain company, information on financial and industrial indicators of its activities.
Also, when predicting possible price movements, it is necessary to understand the risks existing in the financial market for the players acting on it:
- Trading risk - the amount of funds at risk for the trader. For example, if he buys a financial asset for a thousand dollars, then the trading risk will be equal to that amount.
- Market risk - what can happen on the market under the influence of global economic events or events in a particular country where the financial market is located or shares of companies from which are traded on the stock exchange.
- Marginal risk - if borrowed funds are used to make transactions, a marginal risk arises. Borrowed, for example, from a broker, the money will ultimately have to be returned, and if the trader has not enough free funds in the account for this, his positions will be forcibly closed even if it was not implied by his trading strategy.
- Liquidity risk - not every financial instrument can be quickly “exited”.
- The risk of moving overnight positions - maintaining positions in the interval between trading days or for several trading days carries a risk, since the trader cannot know what will happen at the time when the stock exchange is not working. Perhaps an event will affect the opening of the trading day, and the stock price will immediately shift in an unprofitable way for the investor.
- Volatility risk - stock prices fluctuate in certain ranges. The wider the range of price fluctuations, the higher the volatility of a particular financial instrument.
Forecasting stock index behavior
One of the popular tools used to solve stock pricing problems is the decision tree. In turn, the most effective method of collecting and analyzing data is data mining. There are several models of using data mining, which implement various approaches to collecting and analyzing the information received.
In our case, the researchers chose the CRISP-DM (Cross-Identity Standard Process for Data Mining) model. This method was developed by a consortium of European companies in the mid-nineties of the last century. The model includes seven basic steps:
- Definition of targets for information retrieval (data about which promotions are needed).
- Find the right data.
- Ordering data in the classification model.
- The choice of technology for the implementation of the model.
- Evaluation of the model using known methods.
- Applying the model in the current market conditions to generate a recommendation for a target action — for example, buying or selling a stock.
- Evaluation of the results.
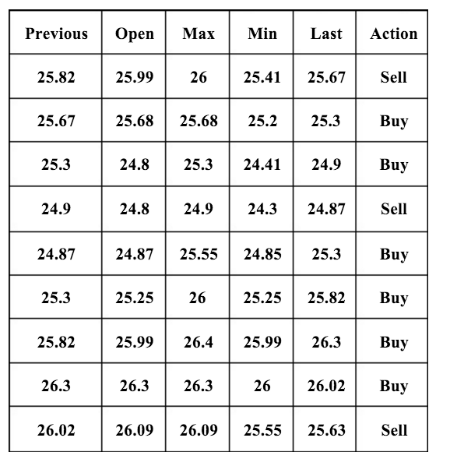
After collecting data, a classification tree is used for decision making. This approach has three main advantages: it is fast, simple and allows you to achieve high accuracy. In this case, the previous price, opening price, maximum, minimum, closing and target action (previous, open, max, min, last, action) were chosen as model parameters.
Also, genetic algorithms are used for prediction. They are used to solve complex problems, in cases where the exact relationship between the elements involved is unknown and may not exist in principle.
The task is formalized so that its solution can be encoded as a vector of genes (“genotype”), where each gene can represent a bit, a number, or some other object. Further, a set of genotypes of the initial “population” is randomly created, which are estimated using a special fitness function. As a result, each genotype is assigned the value of "fitness" - it determines how well it solves the problem.
For continuous optimization of the parameters involved in the trading strategy, optimization methods are used. For example, a gene can be represented as a vector, and the corresponding optimization algorithm applies an intermediate recombination mechanism to it.
One of the methods for generating predictions about future price movements is machine learning. In this case, the researchers used the support vector method. Researchers have collected financial data from the NASDAQ, as well as some financial instruments and indices. As a result, for NASDAQ, the accuracy of the system-generated predictions was 74.4%, 77.6% for the DJIA index and 76% for the S & P500.
The following formulas were used for machine learning:
First of all, x i (t) was defined, where i ∈ {1, 2, ...}.
F = (X 1 , X 2 , ... X n ) T , where

To evaluate the model used, the method used to calculate the root-mean-square error (RMSE, Root of Mean Square Error) was used:

Multiclass classification
To minimize risks and increase profits, the support vector model is used. It implies data classification in three categories: positive, negative and neutral. This helps to identify the most risky forecasts and reject them. To create such a multiclass classifier, it is not necessary to determine the width of the central zone:

tp: true positive
fp: false positive
fn: false negative
Proposed model
As noted above, the data collected had six attributes. For use in a decision tree, data must be converted to discrete values. To do this, you can use the criterion based on the market closing price. If the value of open, max, min and last exceeds the previous value of the attribute during the current trading day, then the positive value should be replaced with the previous attribute. On the contrary, a negative value is set instead of the previous attribute, and if the values are equal, then the corresponding attribute is set.
This is how the data set for six attributes looks like before they are converted to discrete values:
And so after the transfer:

After obtaining such a set of discrete values, it is necessary to build a classification model using a decision tree.
This study explores two possible scenarios of action.
Scenario # 1
It is necessary to do the following:
- Collect financial data on the auction for 30 days.
- Select data on six attributes at 9 points in time during one trading day.
- For each set to form a matrix.
- Calculate XX ^ T and apply the support vector method to generate the eigenvalue.
- Calculate average sales and purchases.
- Calculate the average of each trading day.
- Assigning different weights for the first day, the seventh and the thirtieth day, as well as the average value of the month.
- To generate a recommendation for action, it is necessary to compare the current value with the first, seventh, and thirtieth day, as well as the average value for the entire month.
- If the prediction result for 4 trading days is the same, then a purchase should be made, if there is a match for three trading days, the purchase will have a risk of 25%, for two days the risk will be 50%.
For each trading day out of thirty, it is necessary to generate a matrix in which Xi represents nine different moments in one day:

After that, R = XX T is calculated - each matrix must be multiplied by the transposed version. Then the reference vector and its eigenvalue are calculated.
Scenario 2
In this case, all the same steps are performed, but the support vector method is applied not to the “raw” data, but to the matrix obtained after autocorrelation. An autocorrelation matrix is generated for each trading day:

The following formula is used here:

After autocorrelation, we get a new matrix ( Toeplitz matrix ):

And already for it the reference vector and the eigenvalue are calculated. To compare deviations from the average among different trading days, the average value, variance, and standard deviation, which are stored in the vector, are calculated.
Conclusion
To obtain the best results, the researchers applied all the described methods step by step: starting with fundamental analysis, using the genetic algorithm, neural networks, machine learning and the support vector machine.

At the same time, it was not possible to achieve 100% accuracy of forecasts of changes in stock index values. For various financial instruments, the accuracy of predicting the behavior of indices in a single trading day interval is quite different:
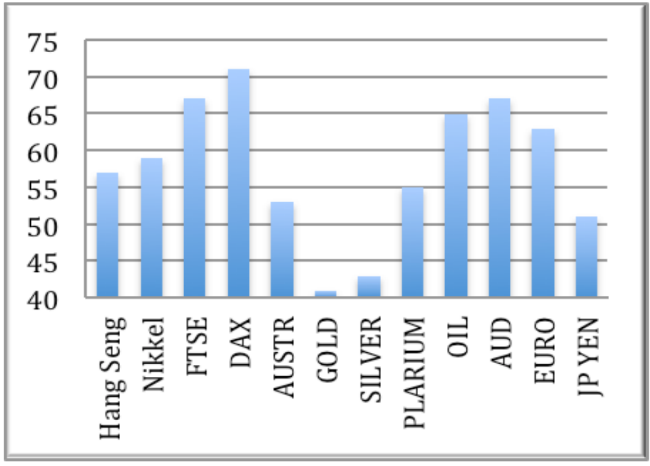
The best result was an accuracy of 70.8% for the German DAX index. To achieve greater accuracy with long-term forecasts (a period longer than 30 days), the following formula was used:
Pr {v t + 1 - v t > c t }, where c t = - (v t-ts - v t )
In this case, the best result of forecast accuracy was 85.0%.
Other materials on stock price forecasting and the use of algorithms in the stock market:
- Machine learning techniques for predicting stock prices: indicator functions and news analysis
- How to predict a stock price: An adaptive filtering algorithm
- Detection of insider trading: Algorithms for identifying and patterns of illegal transactions
- Machine learning as a method of analyzing the microstructure of the market and its application in high-frequency trading
- Algorithms and trading on the stock exchange: Hiding large transactions and predicting the price of shares
Source: https://habr.com/ru/post/278023/
All Articles