DevTips: Web Developer Tips (49-64)
Hi, Habr! On this wonderful Friday day, we invite you to familiarize yourself with the next part of the advice translation cycle for web developers. Previous parts: 1-16 , 17-32 , 33-48 .
Content:
49 Cyclic switching between panels using shortcuts
50 Checking and activating CSS media queries, as well as finding these rules in code
51 Preset resolution of a new device
52 Breadcrumbs Improvements in the Elements Panel
53 Printing a frame in the console
54 Detection of long frames (not to be confused with iframe)
55 Advanced query filtering in the Network panel
56 Search by project with the ability to specify a file
57 New Experimental Page Layout Editor
58 DOM duplication
59 View screenshots of page behavior
60 Editing html-code in the panel "Console"
61 Simple keyboard tricks to control the Styles panels.
62 Choosing a color generated by a palette
63 Increment and decrement of numbers in DOM attributes
64 Network Requests in the Timeline Panel
Use Cmd +] / Cmd + [ to cycle through the panels in DevTools. In addition, there is a shortcut Cmd + Alt + i for opening developer tools.
')
The Media Query Inspector tool will help you in inspecting and activating registered CSS media queries. To open it, in Device Mode, click on the icon resembling a ladder in the upper left corner of the page. You can activate various breakpoints by simply clicking on the lanes that appear. At the same time, right-clicking on them allows you to open a specific place in the code where this Media Query is defined.
Do you often have to emulate the resolution of a new device? Device Mode allows you to set and remember the profile of such a device.
The device added above will appear in the Devices menu in the upper left corner.
Did you know that there are bread crumbs in the Elements panel? They can help you keep track of complete nesting when you are working with a DOM tree. Activate the experimental Material Design in Canary and you will get some nice features:
Do not forget that by clicking on a specific segment of bread crumbs the corresponding DOM element will be highlighted.
Calling the
Its features are:
The Canary's Timeline panel may highlight some frames in red. This warning means that the time spent in it has gone beyond 18ms. When you click on a specific frame, you will receive detailed information about the causes of the problem. If the refresh rate of the monitor is 60Hz (most displays do this), then the frame should not exceed 16ms, because 1000ms / 60 frames per second = ~ 16ms.
To reduce the number of network requests found, use advanced filtering:
Here are some more requests that you can experiment with:
Autocomplete searches help you find all filters and determine the type of their values. In this case, all the values shown are taken from the recorded requests during the last session.
You can search all files using the shortcut Cmd + Opt + F / Ctrl + Shift + F. If the search returns too many results, you can limit the selection by specifying a specific file by changing the query
Layout Editor is a hidden experiment of Canary developer tools. Although some functionality from this tool may change or disappear altogether, I will tell you something about it:
DevTools allow you to very easily modify the DOM-tree, without changing the pieces of html-code.
In addition, the Cut function is available to you (it is also called by Cmd + x / Ctrl + x ). In contrast to copying, it will move the item to a new location in the tree.
Experiment: Try to add more links to the header / footer of a website with the help of copy-paste technique and find out which layout sites need improvement!
The Timeline panel allows you to take screenshots of page behavior. When you move the heading from the beginning to the end of the recording, you will see the visual state of the web application changing over time.
Then you can match the frames with peaks or warnings with the received screenshots to determine why the page worked with unsatisfactory performance.
The context menu of the DOM element, familiar to you from the Elements panel, is also available in the Console panel.
The Tab key allows you to navigate through CSS properties in the following order:
If the end of the CSS rule is reached, the cursor will be moved to the next. In addition, the combination Shift + Tab switches the focus in the opposite direction. Suppose you start typing
To delete a property, you can erase its name or value with Backspace , and then just press Enter .
The Canary DevTools Color Picker tool again received an update. He has now received a new color palette, which is automatically generated based on the set of colors already presented in your style sheets.
You can modify the DOM attribute in the same way as the class name using the ↑ / ↓ keys. Suppose that on some element the class
This feature can be very useful if you are using a CSS grid system that includes specific numbers in the element class names.
The developers of Canary DevTools made a new experiment Network on Timeline : the Timeline panel now displays network requests that could affect the page display process.
Content:
49 Cyclic switching between panels using shortcuts
50 Checking and activating CSS media queries, as well as finding these rules in code
51 Preset resolution of a new device
52 Breadcrumbs Improvements in the Elements Panel
53 Printing a frame in the console
54 Detection of long frames (not to be confused with iframe)
55 Advanced query filtering in the Network panel
56 Search by project with the ability to specify a file
57 New Experimental Page Layout Editor
58 DOM duplication
59 View screenshots of page behavior
60 Editing html-code in the panel "Console"
61 Simple keyboard tricks to control the Styles panels.
62 Choosing a color generated by a palette
63 Increment and decrement of numbers in DOM attributes
64 Network Requests in the Timeline Panel
49. Cyclic switching between panels using shortcuts
Use Cmd +] / Cmd + [ to cycle through the panels in DevTools. In addition, there is a shortcut Cmd + Alt + i for opening developer tools.
')
View screencast

50. Validation and activation of CSS media queries, as well as finding these rules in the code
The Media Query Inspector tool will help you in inspecting and activating registered CSS media queries. To open it, in Device Mode, click on the icon resembling a ladder in the upper left corner of the page. You can activate various breakpoints by simply clicking on the lanes that appear. At the same time, right-clicking on them allows you to open a specific place in the code where this Media Query is defined.
View screencast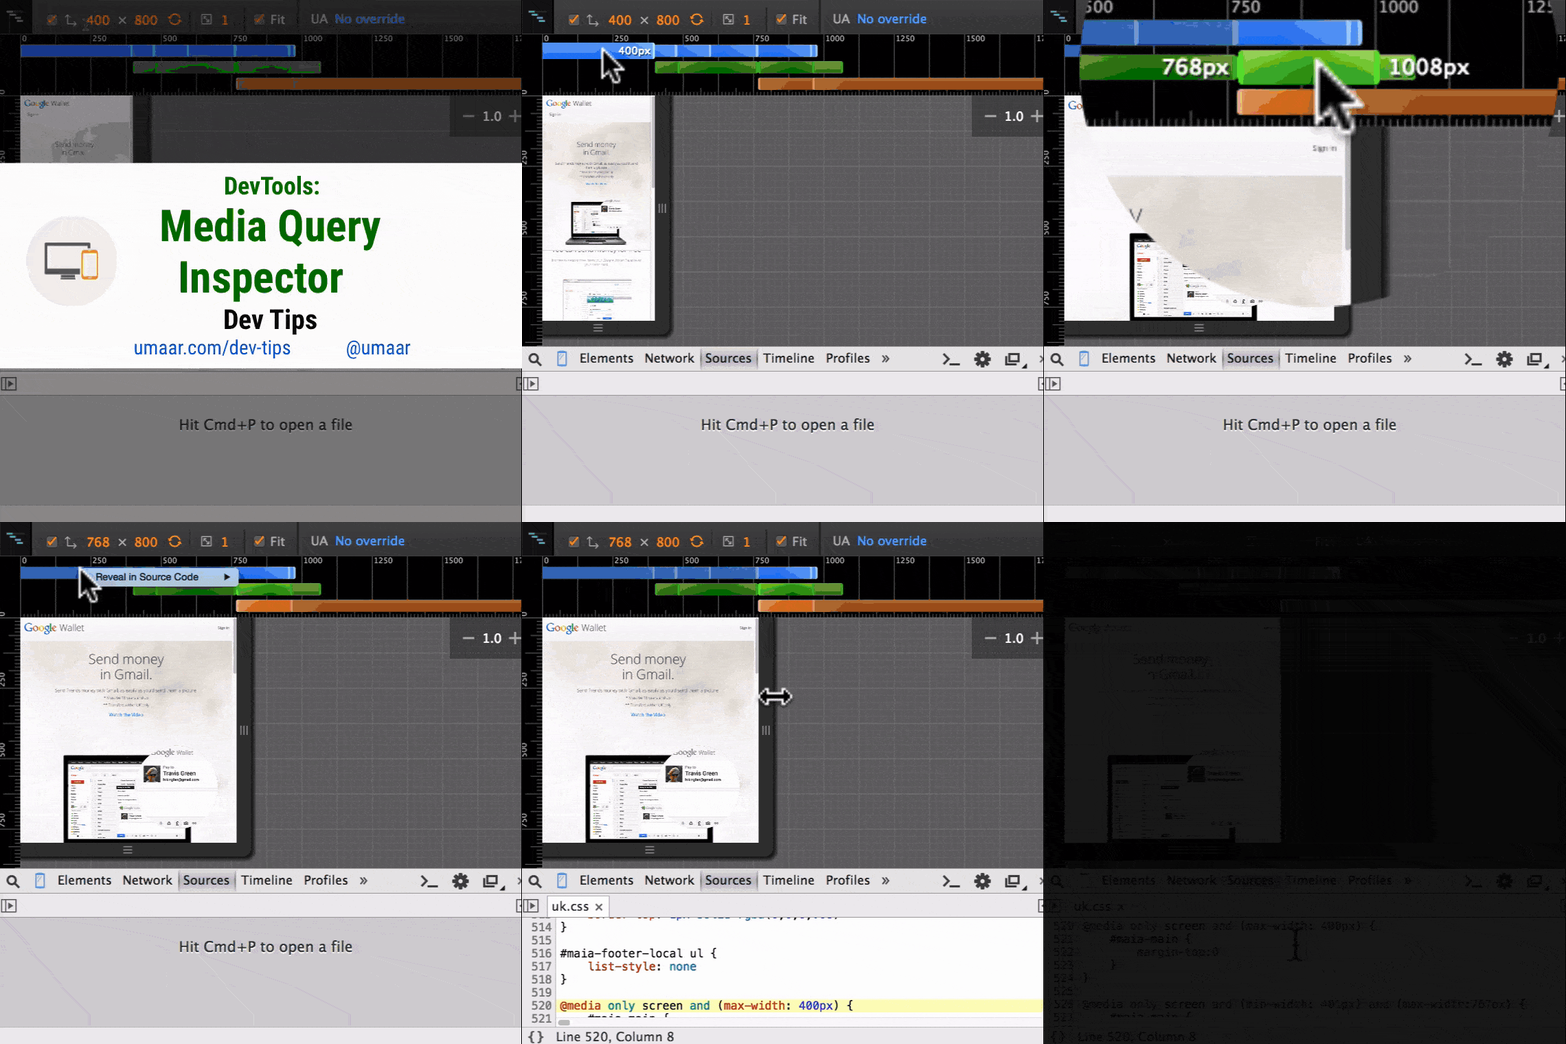

51. Preset resolution of a new device
Do you often have to emulate the resolution of a new device? Device Mode allows you to set and remember the profile of such a device.
- Open the Devices panel in the DevTools settings.
- Select Add custom device .
- Enter the device information.
- Click on Add Device .
The device added above will appear in the Devices menu in the upper left corner.
View screencast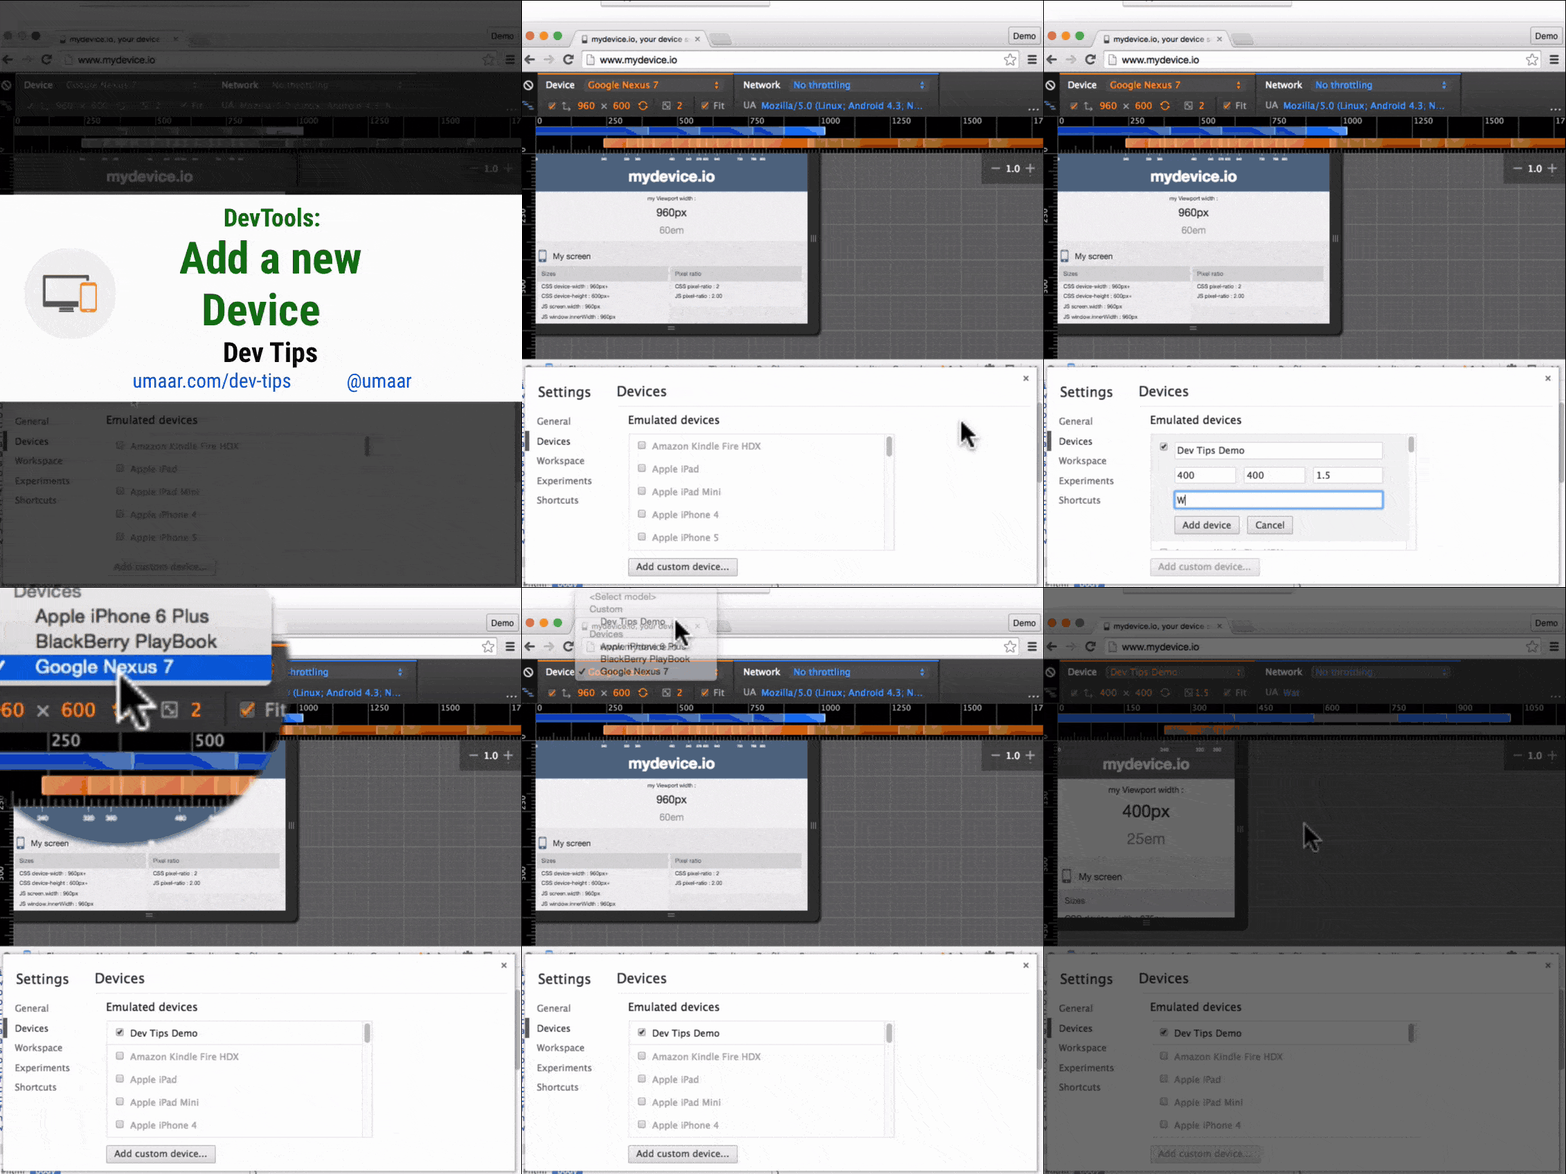

52. Breadcrumbs improvements in the Elements panel.
Did you know that there are bread crumbs in the Elements panel? They can help you keep track of complete nesting when you are working with a DOM tree. Activate the experimental Material Design in Canary and you will get some nice features:
- In the new design "bread crumbs" look much better.
- Now they are on top of the Elements panel, which improves their visibility.
- In general, the DevTools interface has become more structured.
Do not forget that by clicking on a specific segment of bread crumbs the corresponding DOM element will be highlighted.
View screencast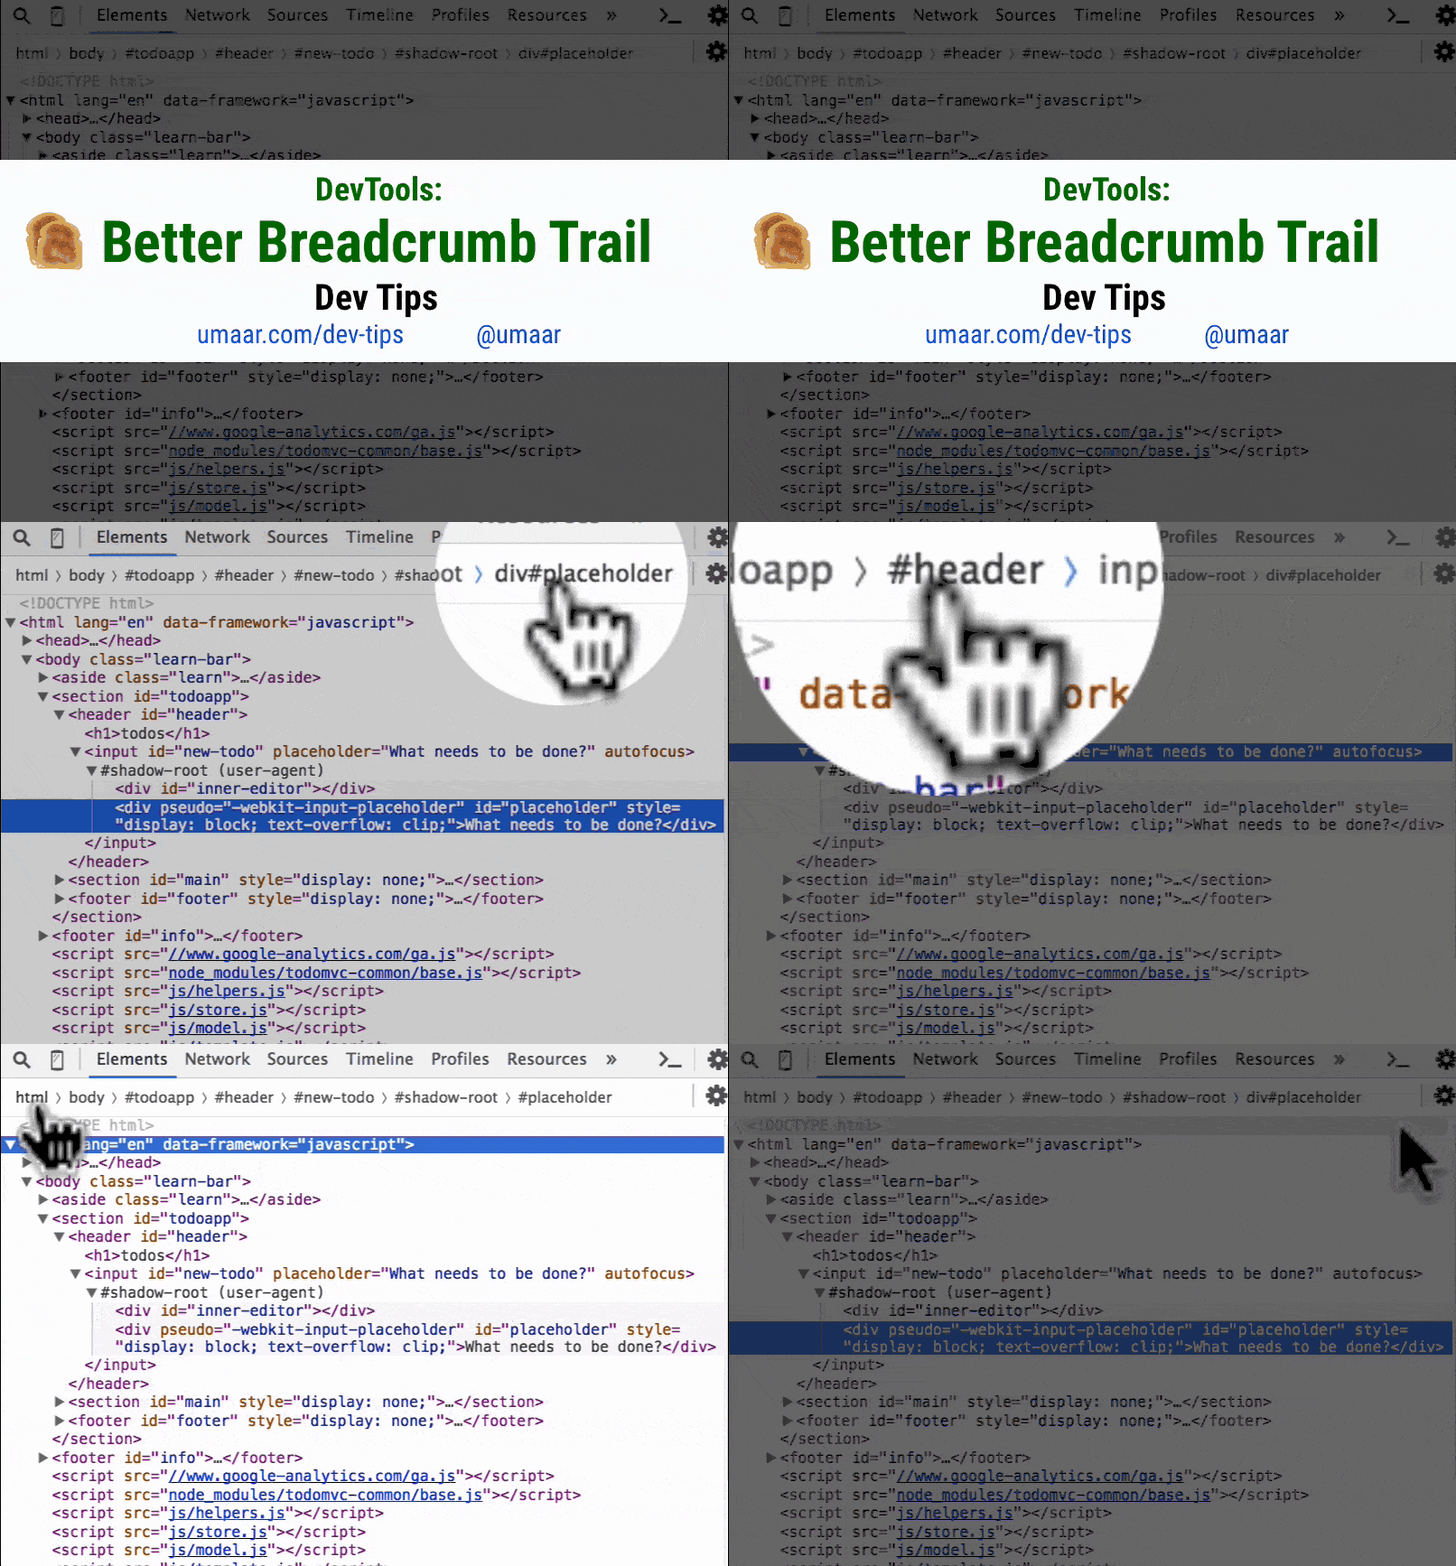

53. Printing the frame in the console
Calling the
console.trace() function can help you quickly and easily get a template for a better understanding of the flow of control of your program.Its features are:
- You will get the file names and line numbers by clicking on which you move to the appropriate place in the code.
console.tracecompatible with snippets.- This method is part of the Console API (along with
console.log).
View screencast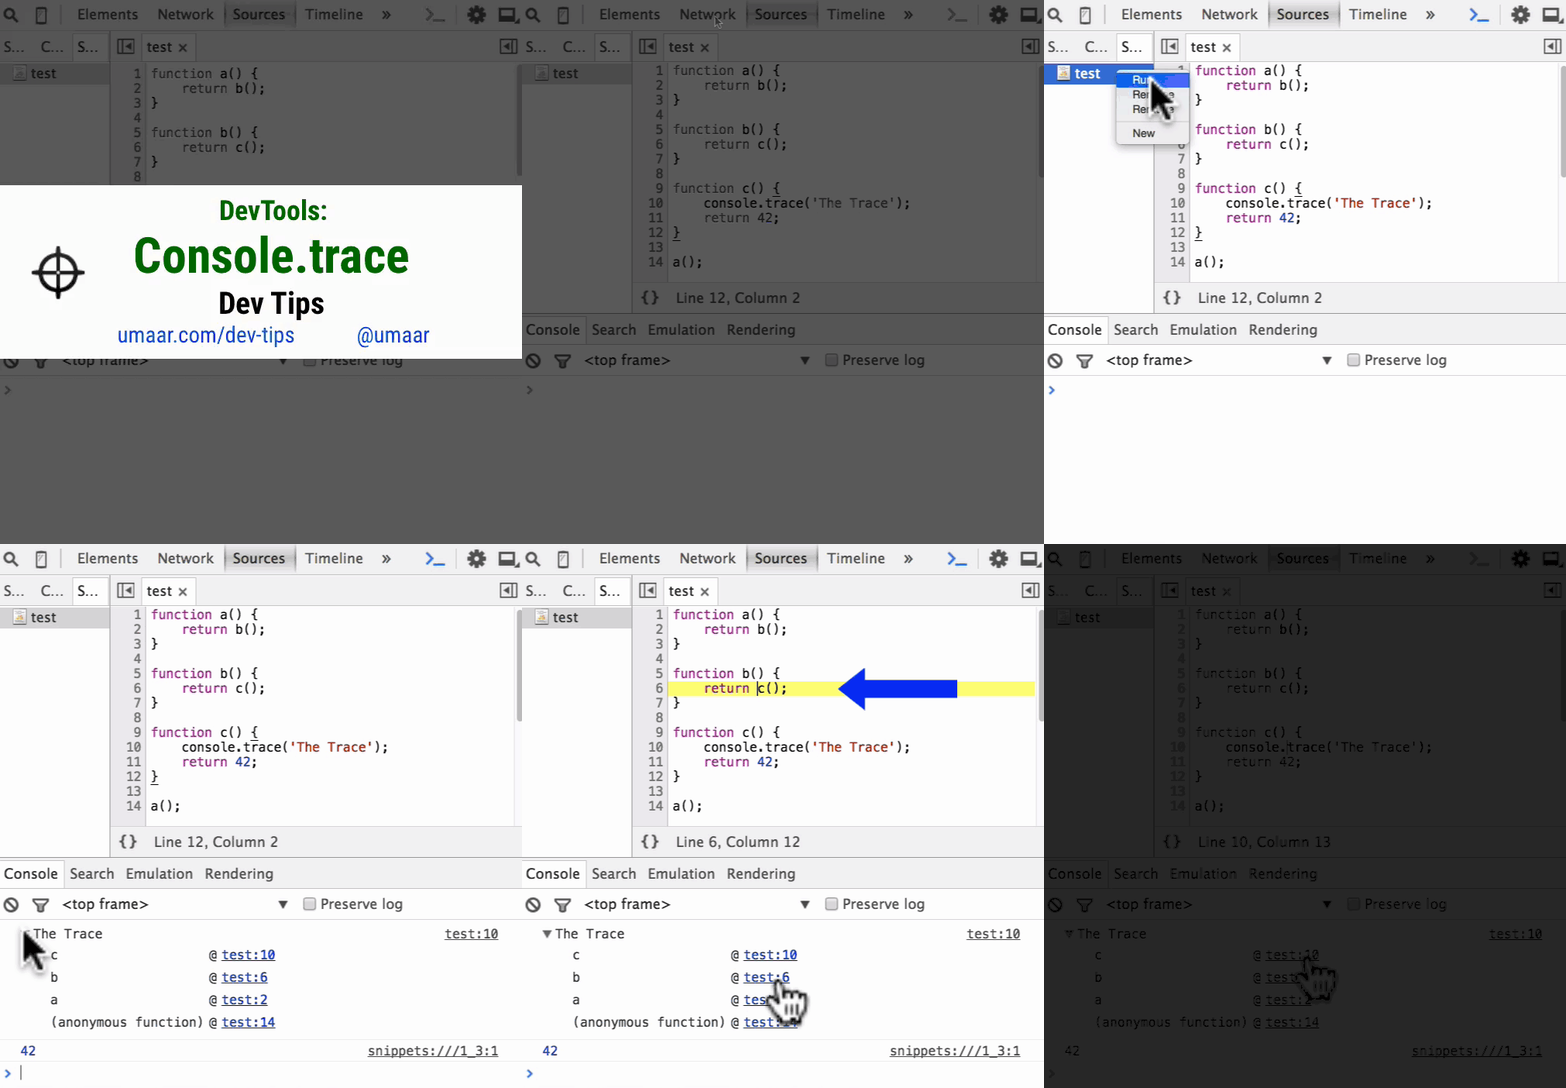

54. Detection of long frames (not to be confused with iframe)
The Canary's Timeline panel may highlight some frames in red. This warning means that the time spent in it has gone beyond 18ms. When you click on a specific frame, you will receive detailed information about the causes of the problem. If the refresh rate of the monitor is 60Hz (most displays do this), then the frame should not exceed 16ms, because 1000ms / 60 frames per second = ~ 16ms.
View screencast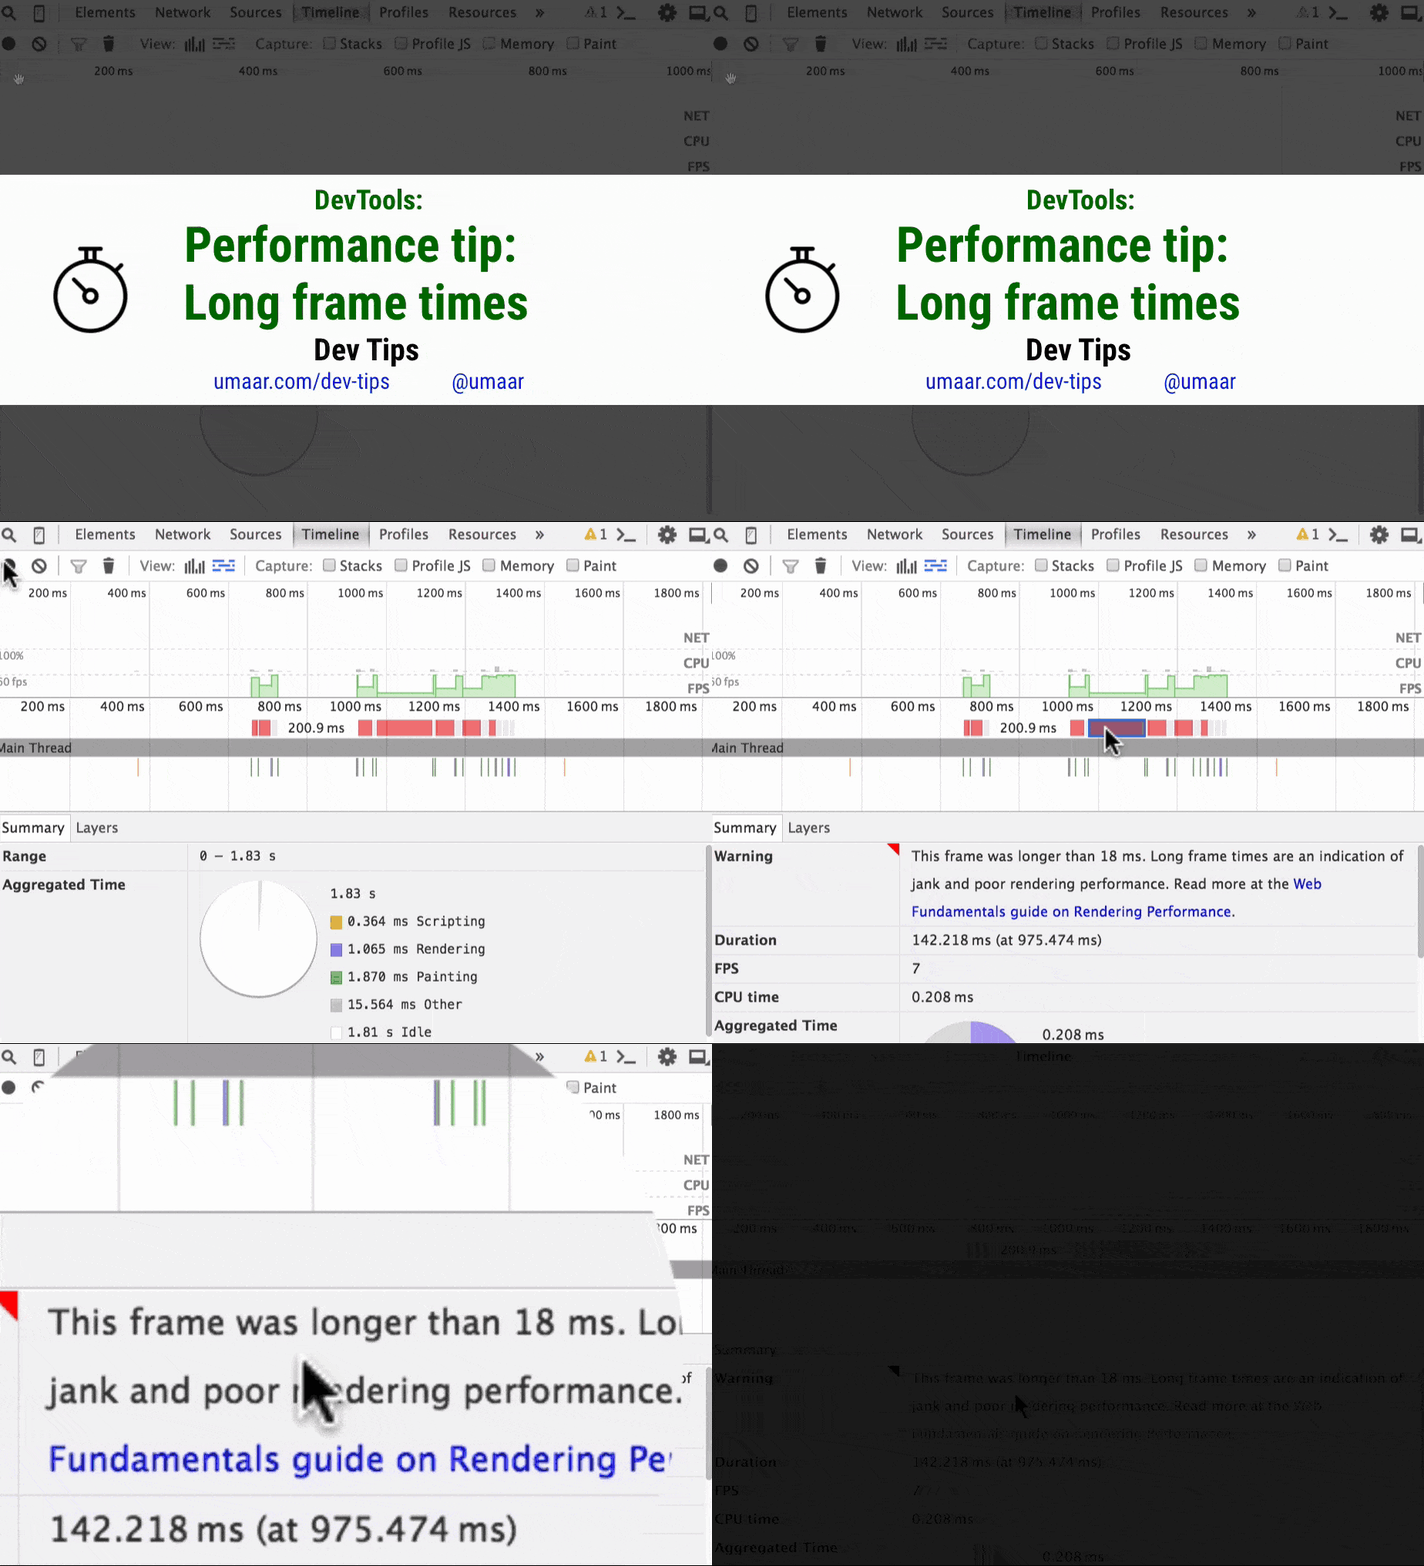

55. Advanced filtering requests in the panel "Network"
To reduce the number of network requests found, use advanced filtering:
larger-than:100will display all resources larger than 100 bytes.-larger-than:50kwill find all requests that do not exceed 50Kb.status-code:200will show all replies with status200.
Here are some more requests that you can experiment with:
- domain
- mime-type
- scheme
- set-cookie-domain
- set-cookie-value
- has-response-header
Autocomplete searches help you find all filters and determine the type of their values. In this case, all the values shown are taken from the recorded requests during the last session.
View screencast

56. Project search with the ability to specify a file
You can search all files using the shortcut Cmd + Opt + F / Ctrl + Shift + F. If the search returns too many results, you can limit the selection by specifying a specific file by changing the query
query to query file:main.js or query file:main .View screencast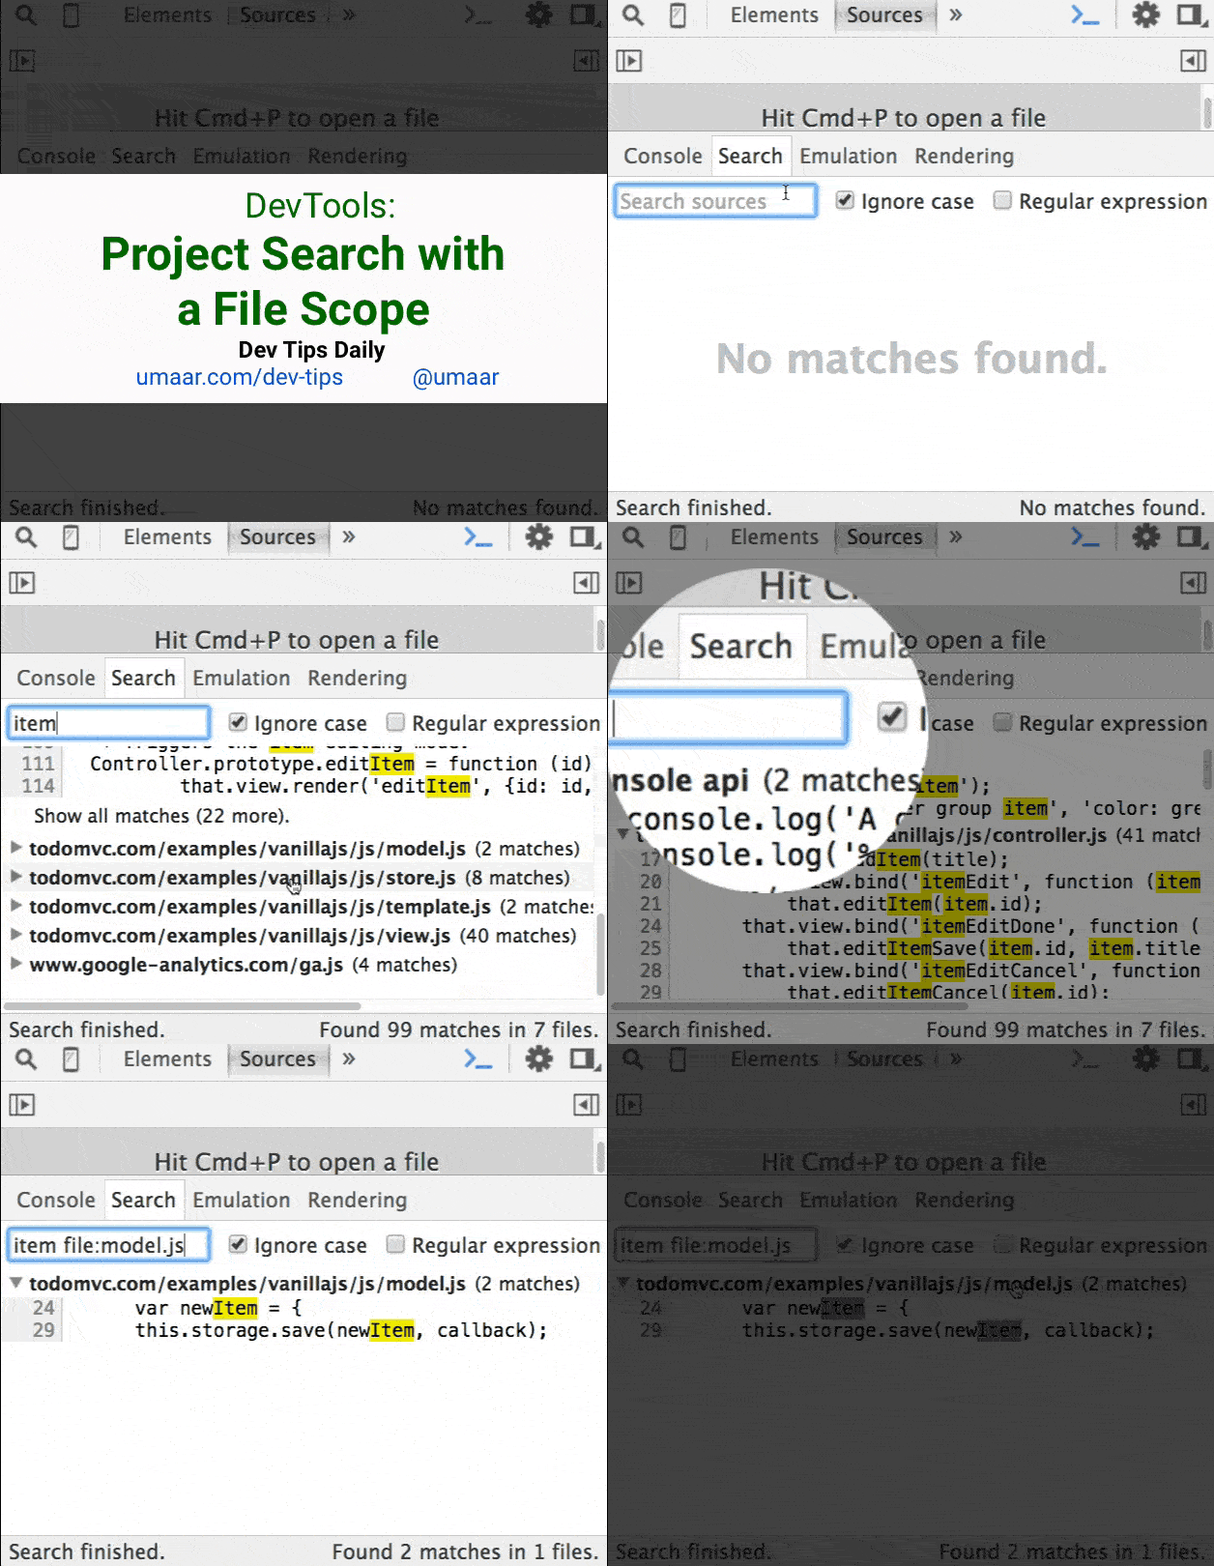

57. New Experimental Page Layout Editor
Layout Editor is a hidden experiment of Canary developer tools. Although some functionality from this tool may change or disappear altogether, I will tell you something about it:
- When you inspect an item, markers appear near its borders.
- By pulling them, you change the indents ( margin or padding ) of this node.
- These markers also display the current indentation value as they change.
View screencast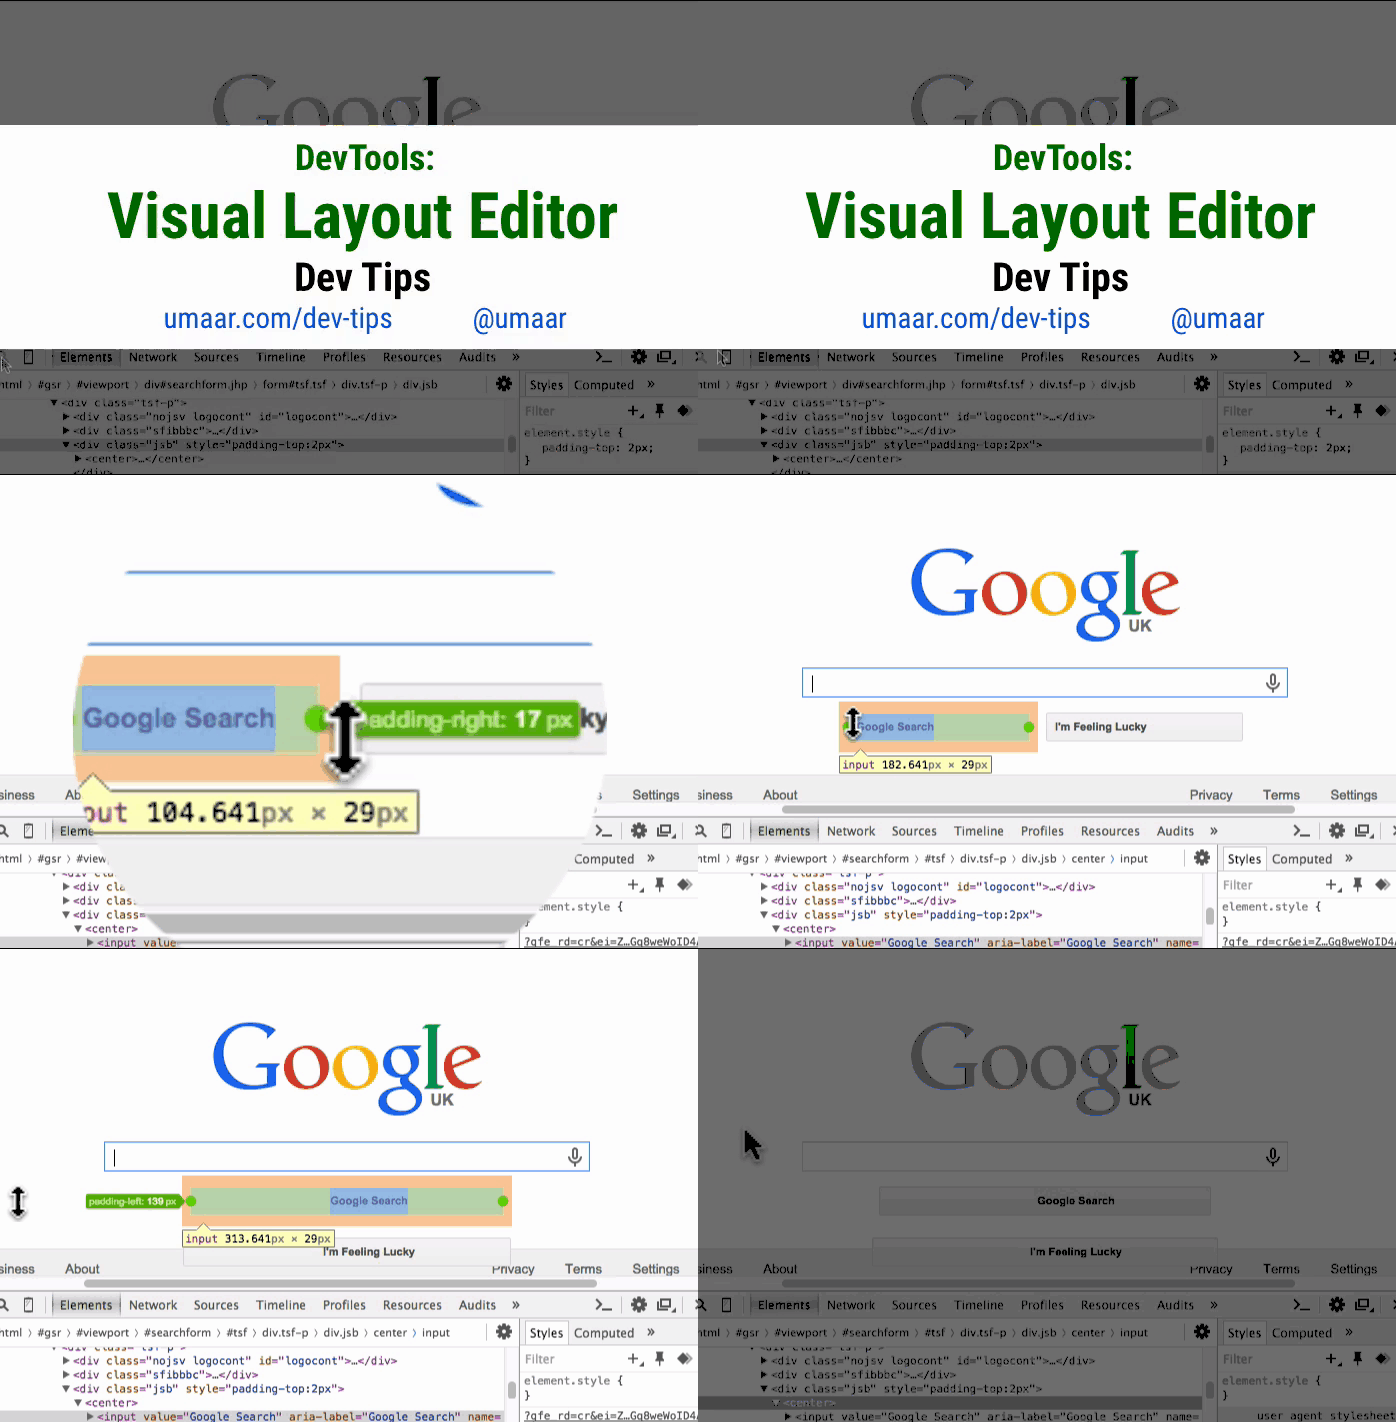

58. DOM duplication
DevTools allow you to very easily modify the DOM-tree, without changing the pieces of html-code.
- Right-click on an element in the Elements panel and select Copy .
- Now you can insert this element into a text editor or, for prototyping, into any other place in the DOM tree. The copied node is added as the child of the selected item. In the video, I climbed from the child node to the parent using ← to insert an element into it.
In addition, the Cut function is available to you (it is also called by Cmd + x / Ctrl + x ). In contrast to copying, it will move the item to a new location in the tree.
Experiment: Try to add more links to the header / footer of a website with the help of copy-paste technique and find out which layout sites need improvement!
View screencast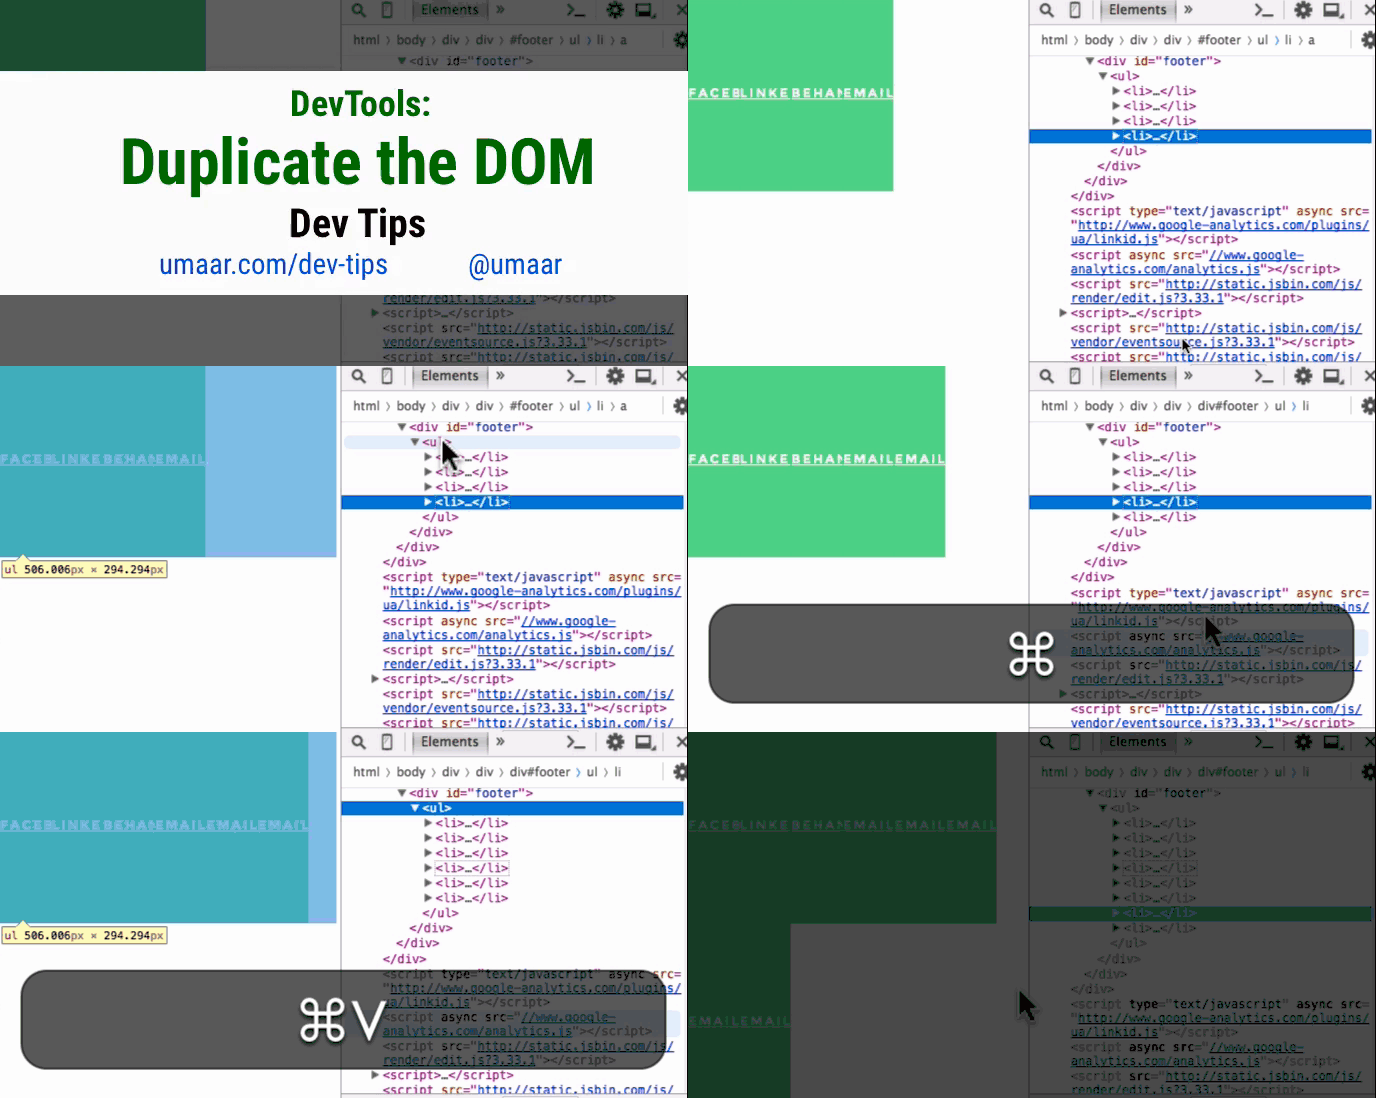

59. View screenshots page behavior
The Timeline panel allows you to take screenshots of page behavior. When you move the heading from the beginning to the end of the recording, you will see the visual state of the web application changing over time.
Then you can match the frames with peaks or warnings with the received screenshots to determine why the page worked with unsatisfactory performance.
View screencast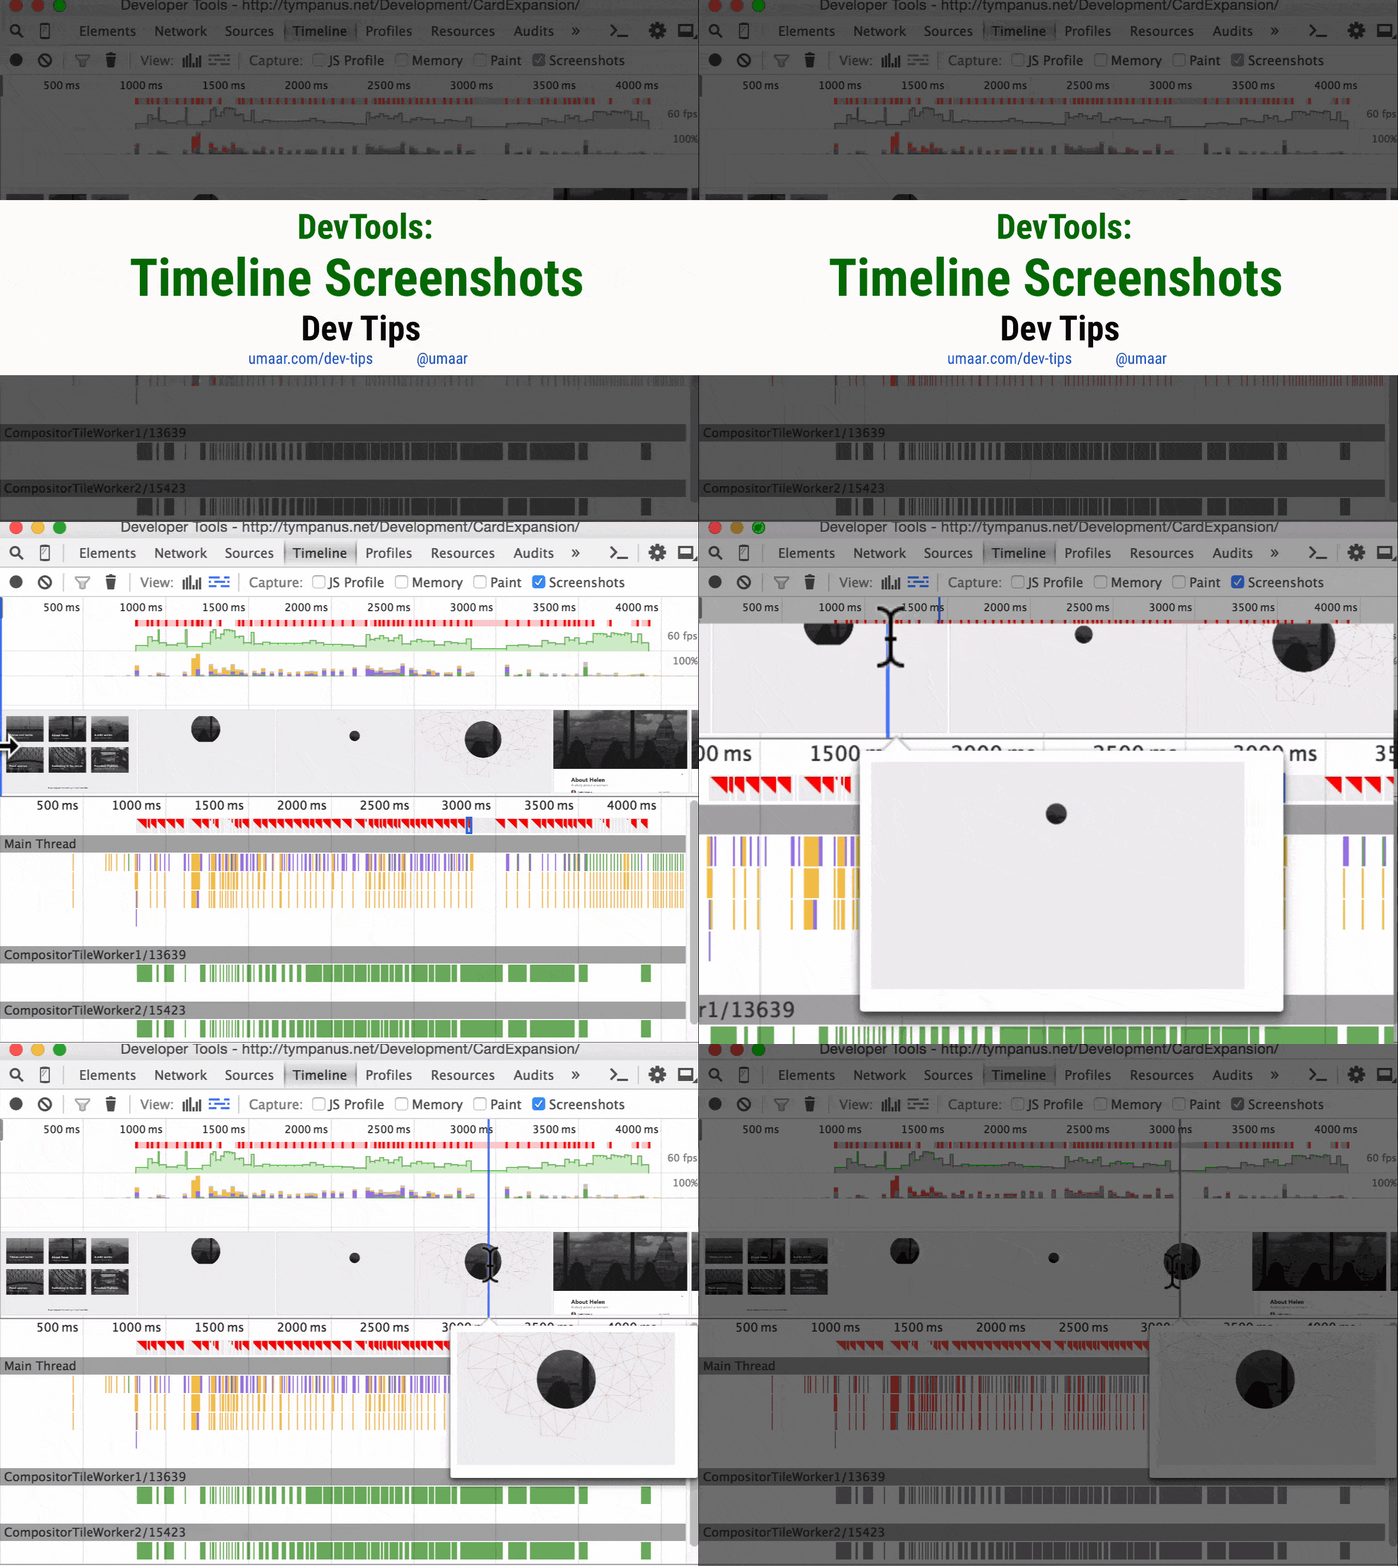

60. Editing html-code in the panel "Console"
The context menu of the DOM element, familiar to you from the Elements panel, is also available in the Console panel.
- Log the DOM node to the console and call its context menu.
- Select Edit as HTML or Edit Text and edit it.
- Notice that the original node in the Elements panel will also be changed.
View screencast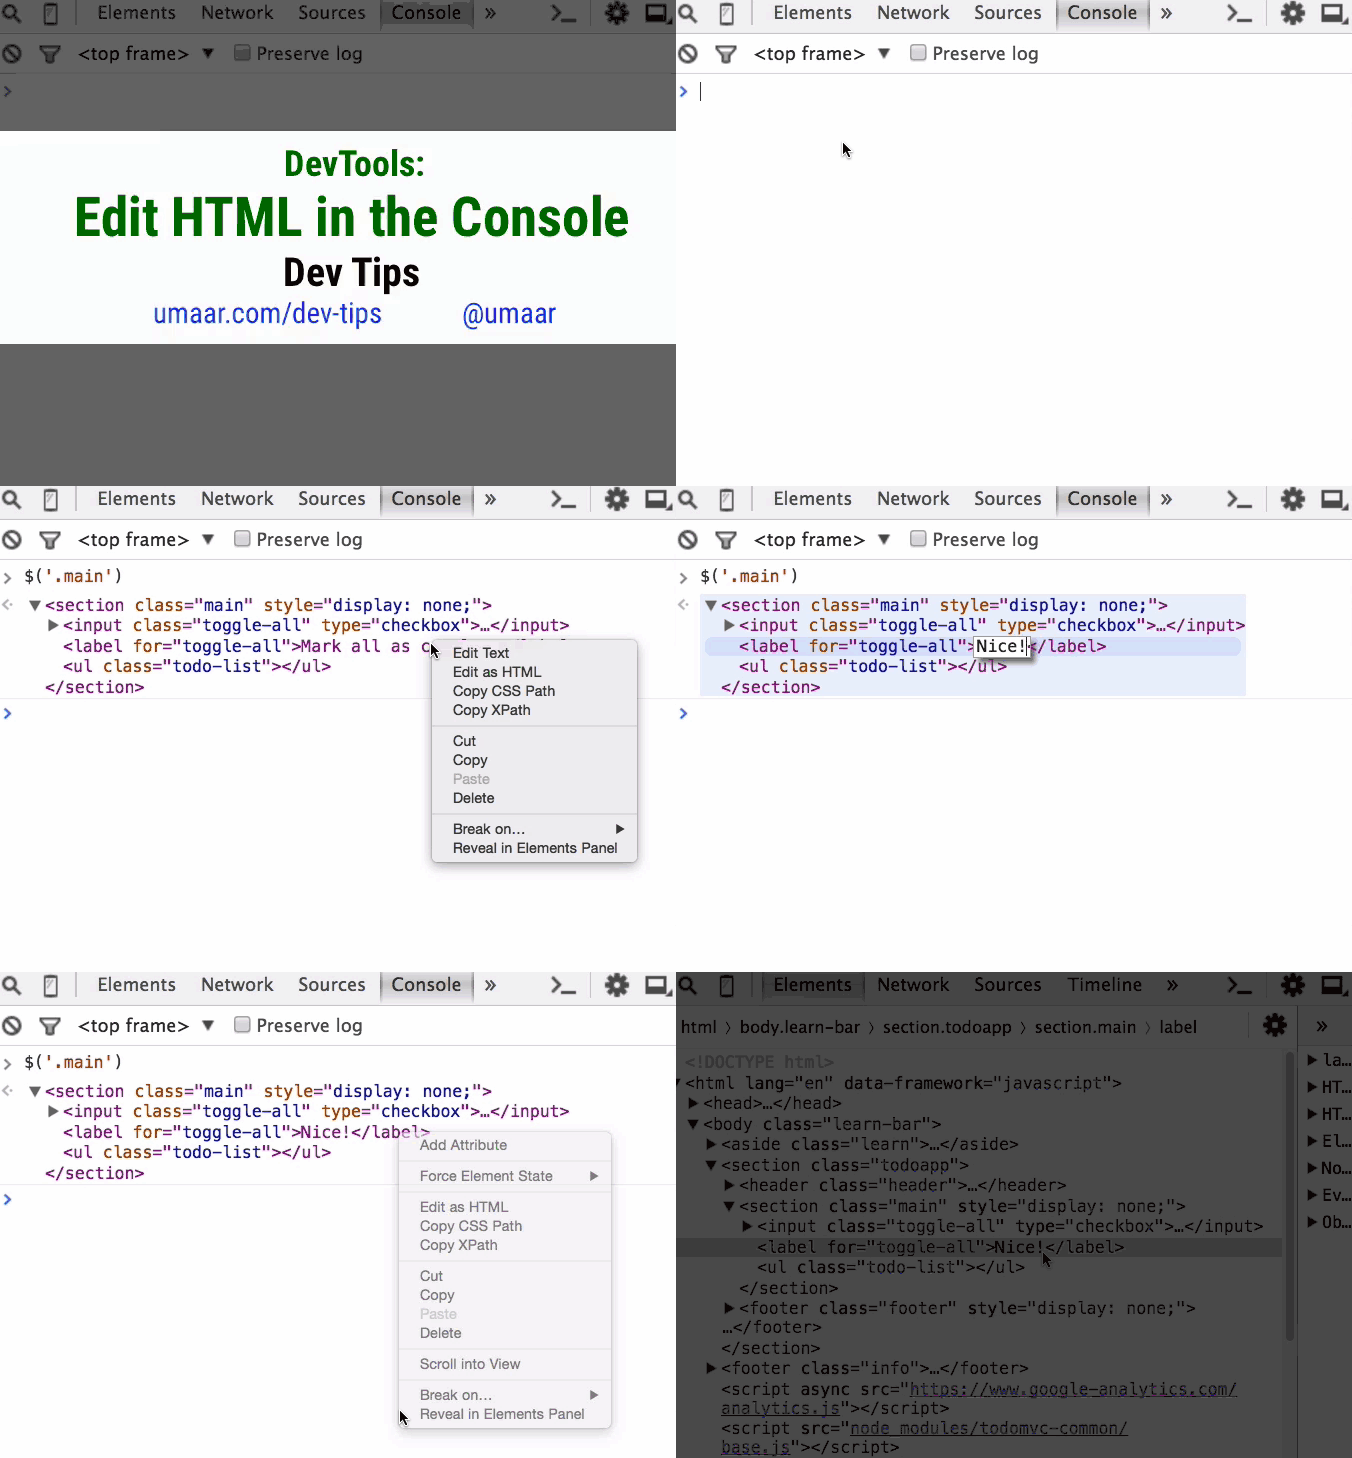

61. Simple keyboard tricks to control the Styles panels.
The Tab key allows you to navigate through CSS properties in the following order:
- Selector (for example, h1 )
- Property (for example, color )
- Value (e.g. green )
If the end of the CSS rule is reached, the cursor will be moved to the next. In addition, the combination Shift + Tab switches the focus in the opposite direction. Suppose you start typing
back in the rule name field with the intention of choosing background from the drop-down options, but you accidentally made a mistake and chose background-color . In this case, simply press the backspace key and you will be moved back to editing the property name.To delete a property, you can erase its name or value with Backspace , and then just press Enter .
View screencast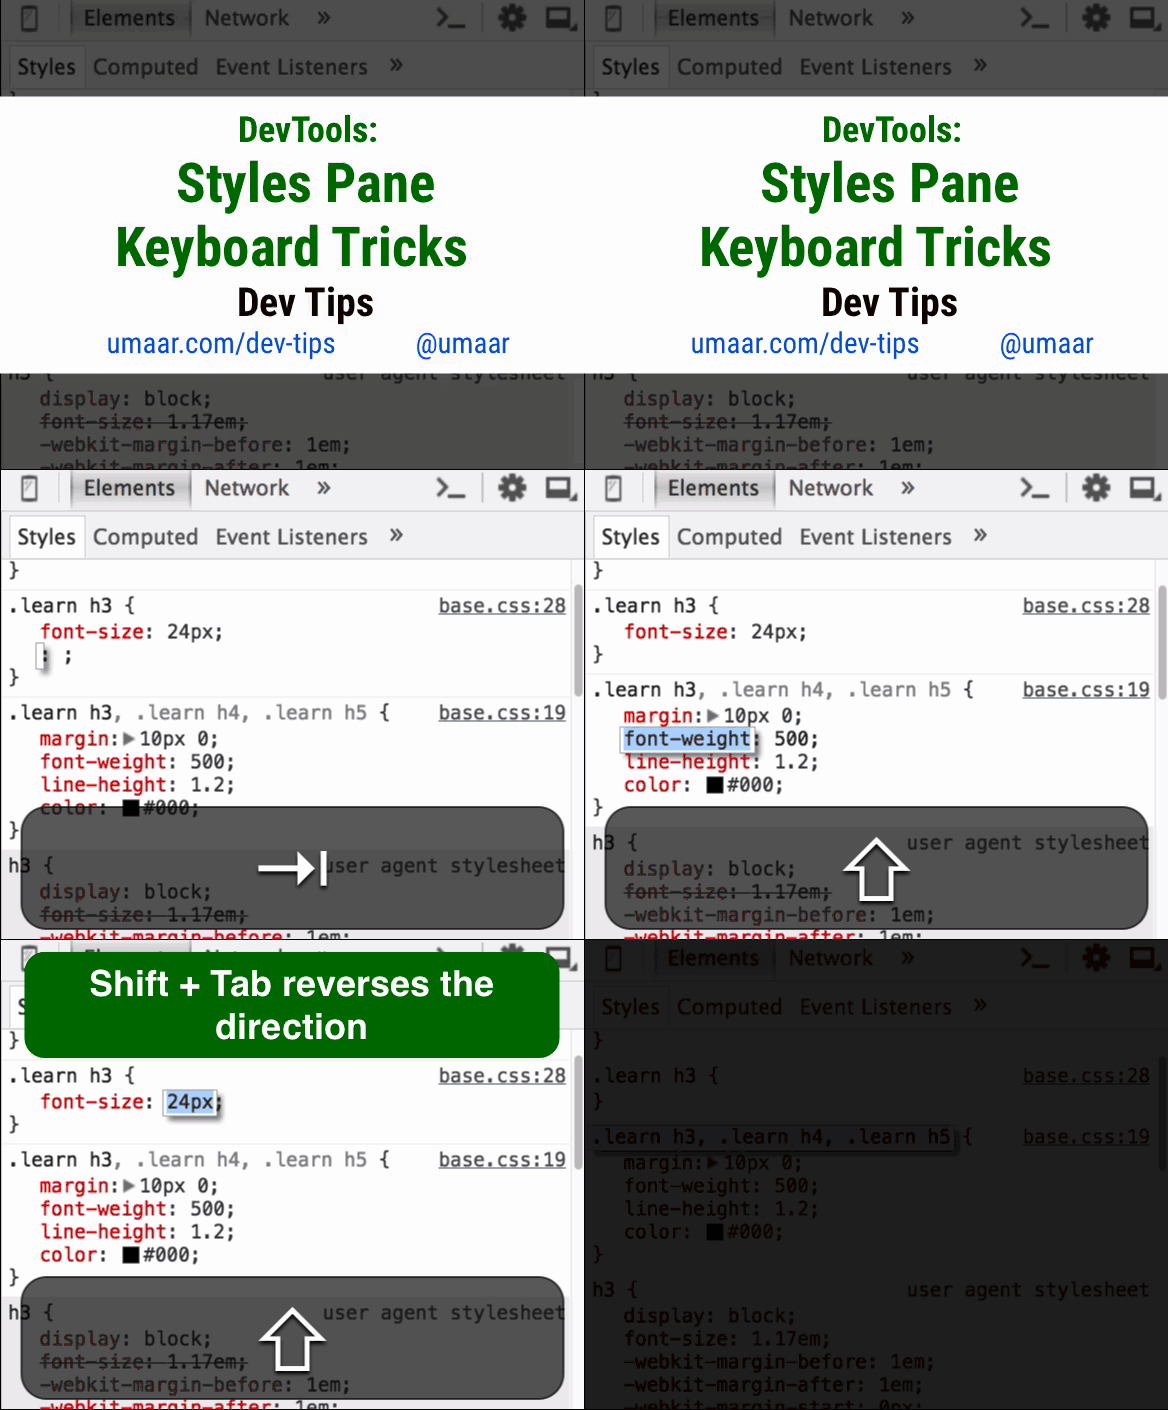

62. Choosing a color generated by the palette.
The Canary DevTools Color Picker tool again received an update. He has now received a new color palette, which is automatically generated based on the set of colors already presented in your style sheets.
View screencast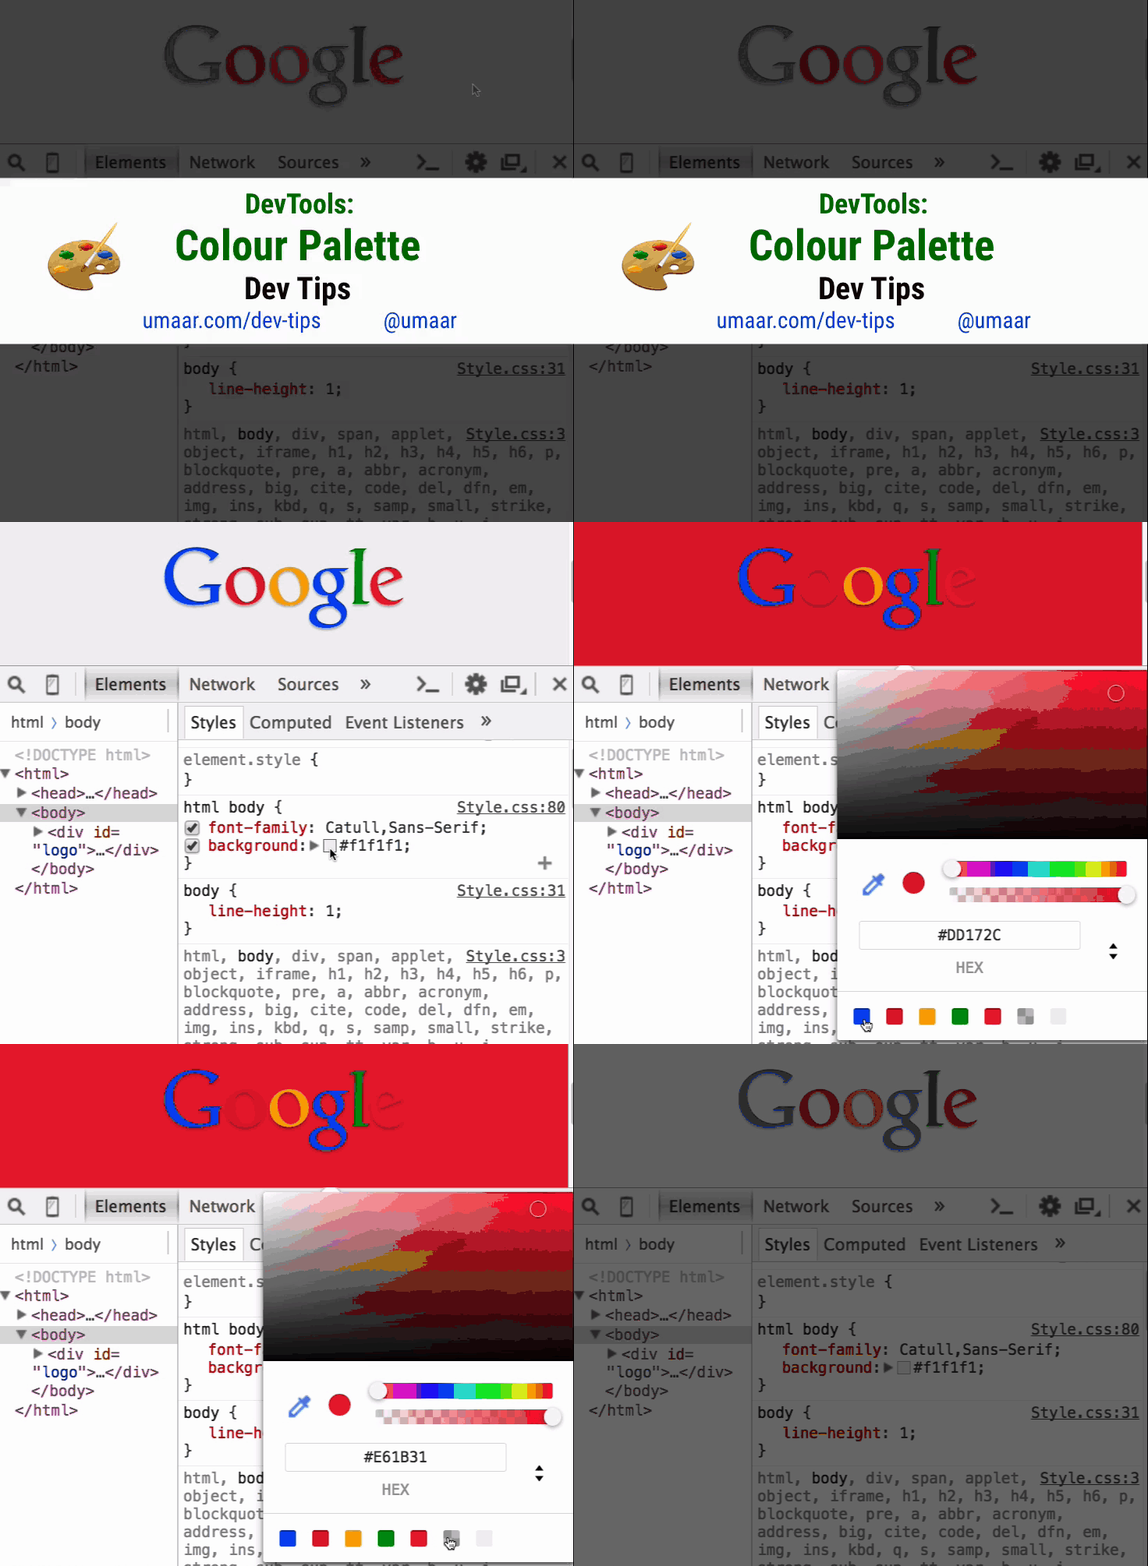

63. Increment and decrement of numbers in DOM attributes
You can modify the DOM attribute in the same way as the class name using the ↑ / ↓ keys. Suppose that on some element the class
span_1_of_7 , the arrow ↑ in this case transforms it into span_2_of_7 .This feature can be very useful if you are using a CSS grid system that includes specific numbers in the element class names.
View screencast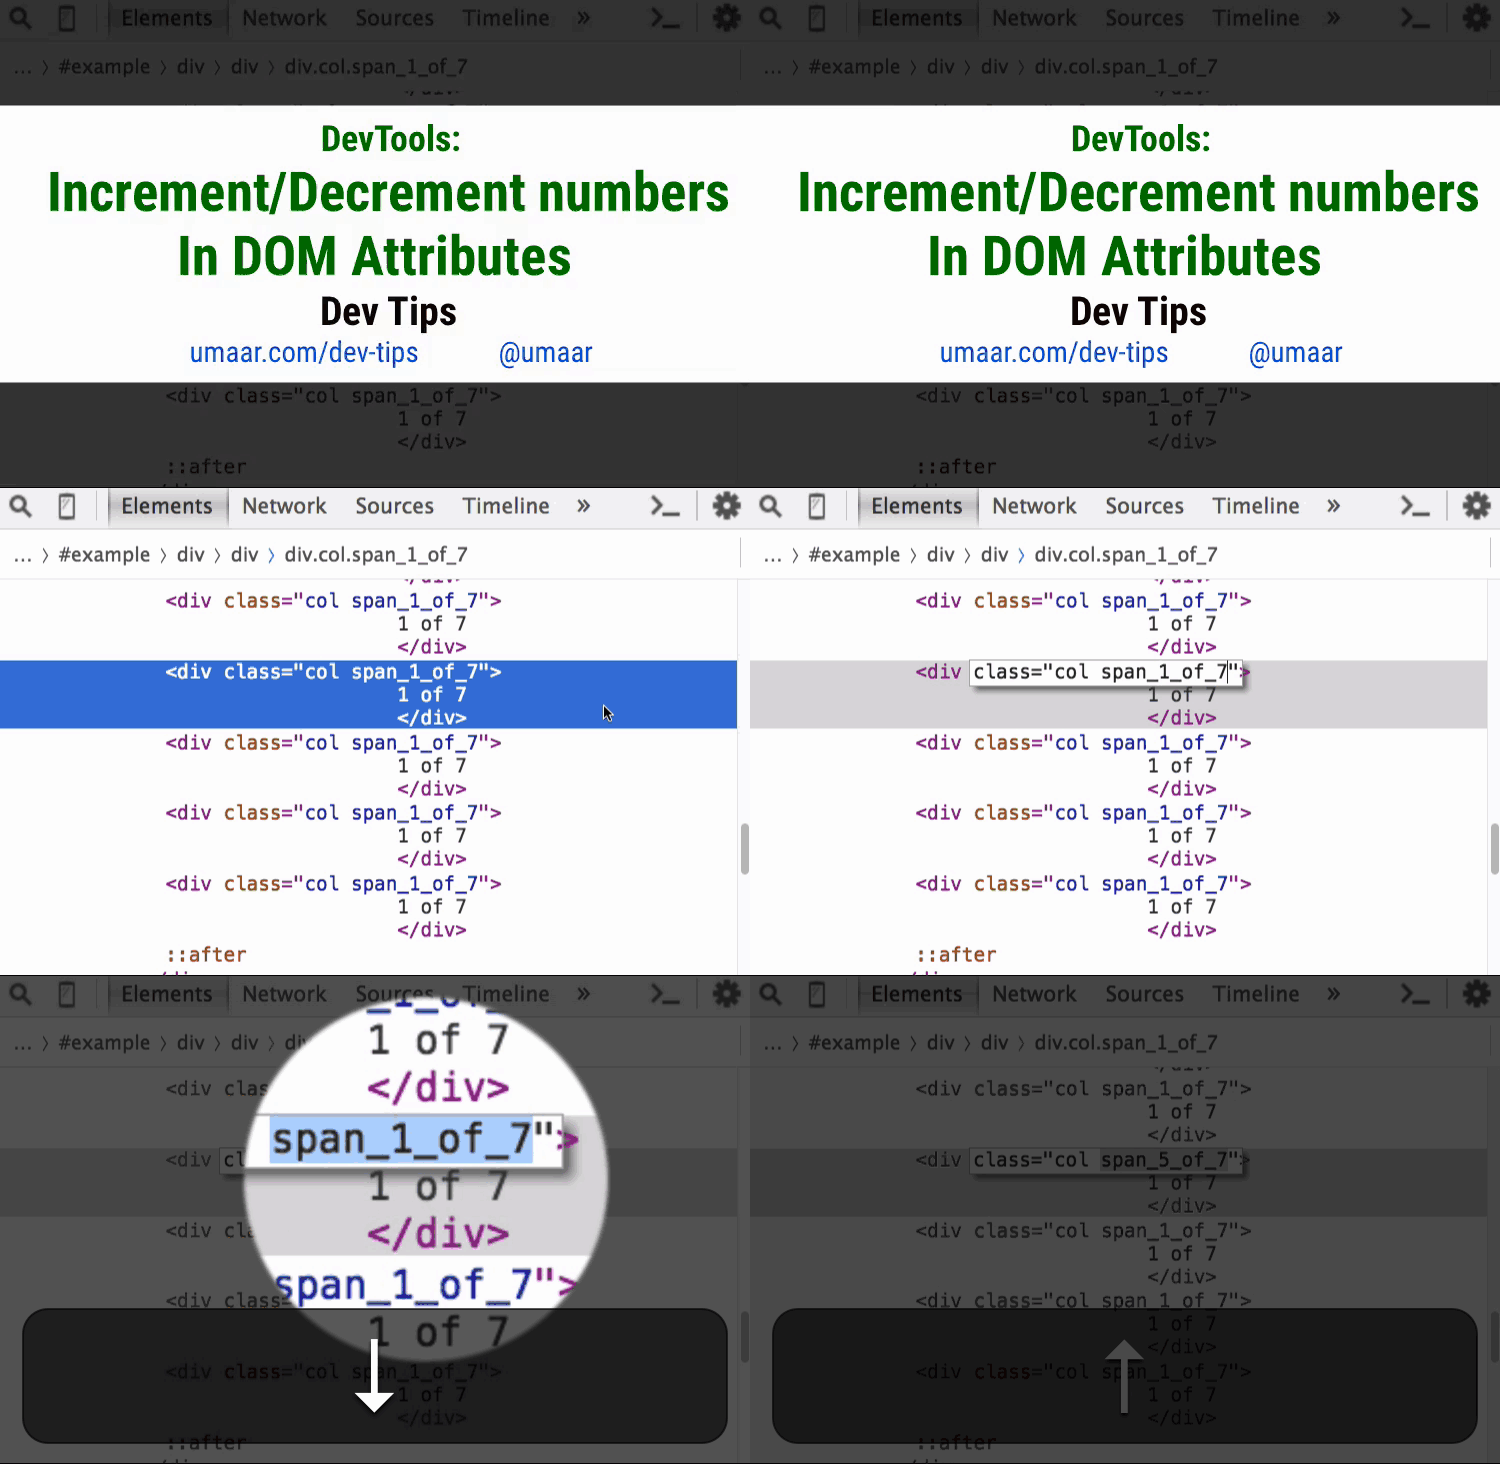

64. Network requests in the Timeline panel
The developers of Canary DevTools made a new experiment Network on Timeline : the Timeline panel now displays network requests that could affect the page display process.
View screencast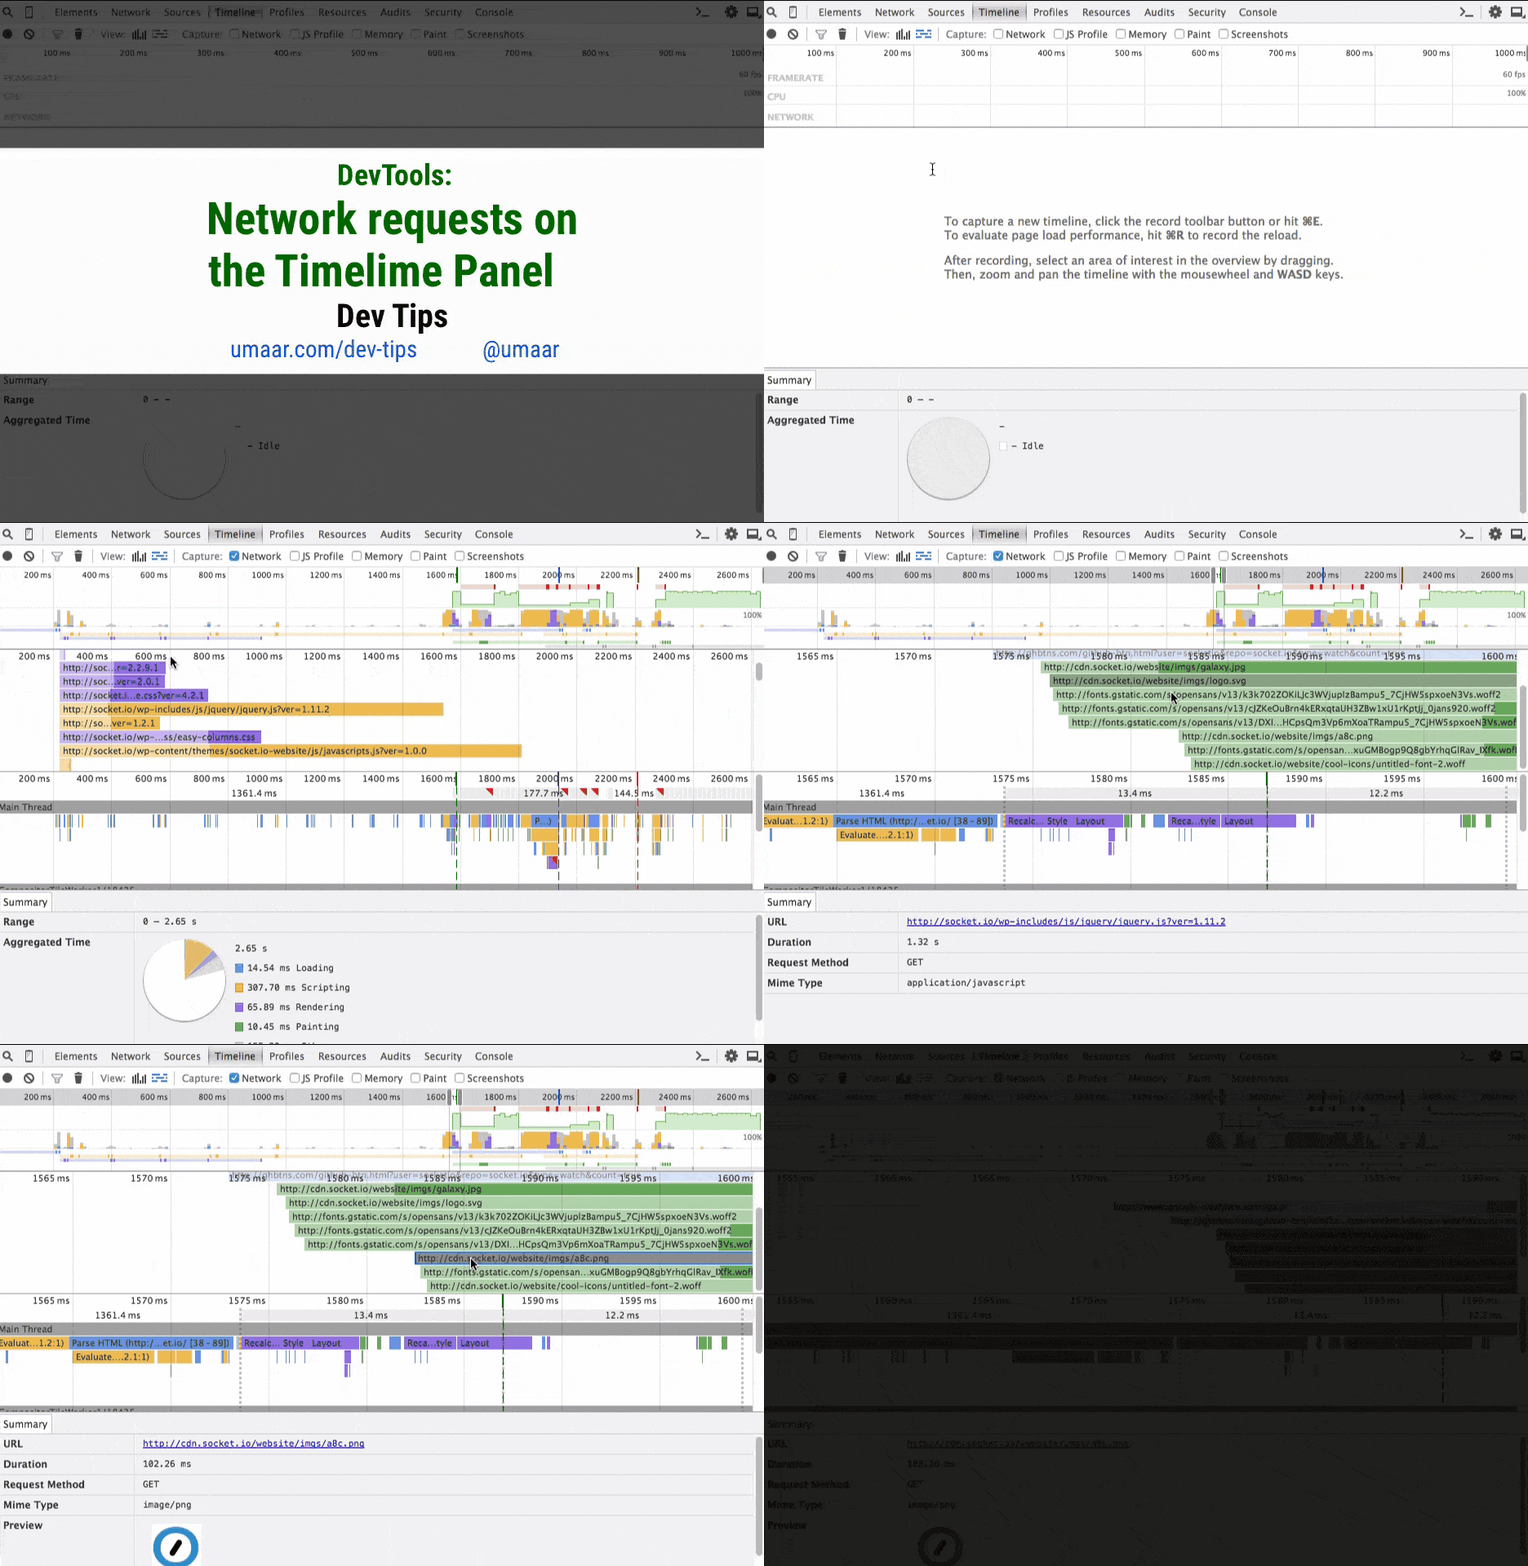

Source: https://habr.com/ru/post/278021/
All Articles